Equities
| MINTs | |
|---|---|
| JCI(IDN) | +0.02% |
| INMEX(MEX) | -1.61% |
| NGSEINDX(NGA) | +7.83% |
| XU030(TUR) | -9.43% |
| BRICS | |
|---|---|
| IBOV(BRA) | -9.81% |
| SHCOMP(CHN) | -0.84% |
| NIFTY(IND) | +4.21% |
| INDEXCF(RUS) | -2.70% |
| TOP40(ZAF) | +2.50% |
Commodities
| Energy | |
|---|---|
| Ethanol | +6.67% |
| Heating Oil | +7.38% |
| Natural Gas | +7.49% |
| Brent Crude Oil | +2.90% |
| RBOB Gasoline | +0.68% |
| WTI Crude Oil | +6.55% |
| Metals | |
|---|---|
| Copper | -7.49% |
| Platinum | -8.82% |
| Silver 5000oz | -10.11% |
| Gold 100oz | -5.52% |
| Palladium | -12.65% |
Currencies
| MINTs | |
|---|---|
| USDIDR(IDN) | +3.65% |
| USDMXN(MEX) | +7.17% |
| USDNGN(NGA) | +0.00% |
| USDTRY(TUR) | +5.40% |
| BRICS | |
|---|---|
| USDBRL(BRA) | +4.23% |
| USDCNY(CHN) | +1.54% |
| USDINR(IND) | +1.69% |
| USDRUB(RUS) | +3.25% |
| USDZAR(ZAF) | +10.07% |
| Agricultural | |
|---|---|
| Lean Hogs | +3.33% |
| Lumber | +2.78% |
| Orange Juice | +20.00% |
| Wheat | -2.56% |
| White Sugar | +2.88% |
| Coffee (Robusta) | +6.04% |
| Corn | +2.81% |
| Cotton | +0.28% |
| Soybean Meal | +18.55% |
| Soybeans | +5.17% |
| Cattle | -2.34% |
| Cocoa | -3.81% |
| Coffee (Arabica) | +1.70% |
| Feeder Cattle | +5.01% |
| Sugar #11 | +7.46% |
Credit Indices
| Index | Change |
|---|---|
| Markit CDX EM | -0.78% |
| Markit CDX NA HY | -0.24% |
| Markit CDX NA IG | +0.19% |
| Markit iTraxx Asia ex-Japan IG | +0.55% |
| Markit iTraxx Australia | -4.39% |
| Markit iTraxx Europe | -0.16% |
| Markit iTraxx Europe Crossover | +3.18% |
| Markit iTraxx Japan | -4.31% |
| Markit MCDX (Municipal CDS) | -2.00% |
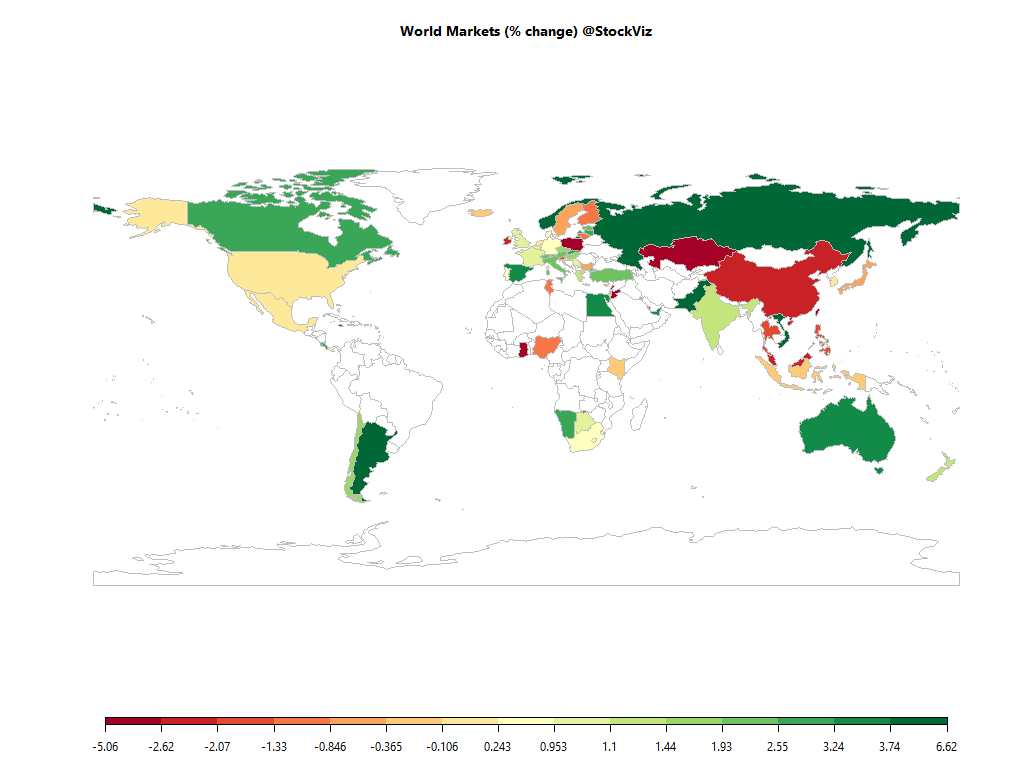
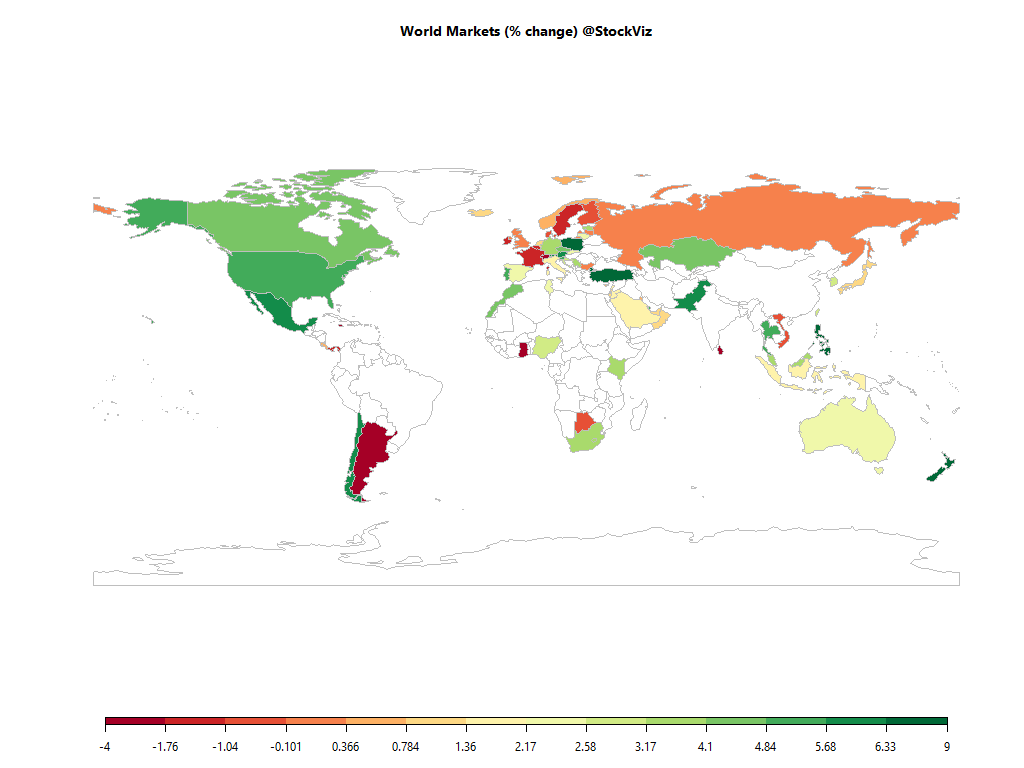
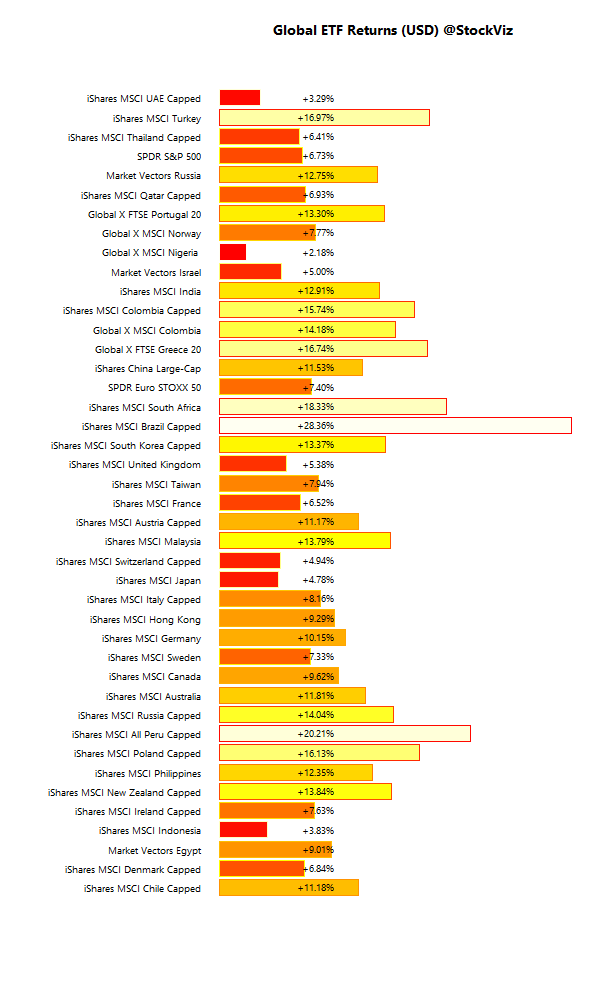
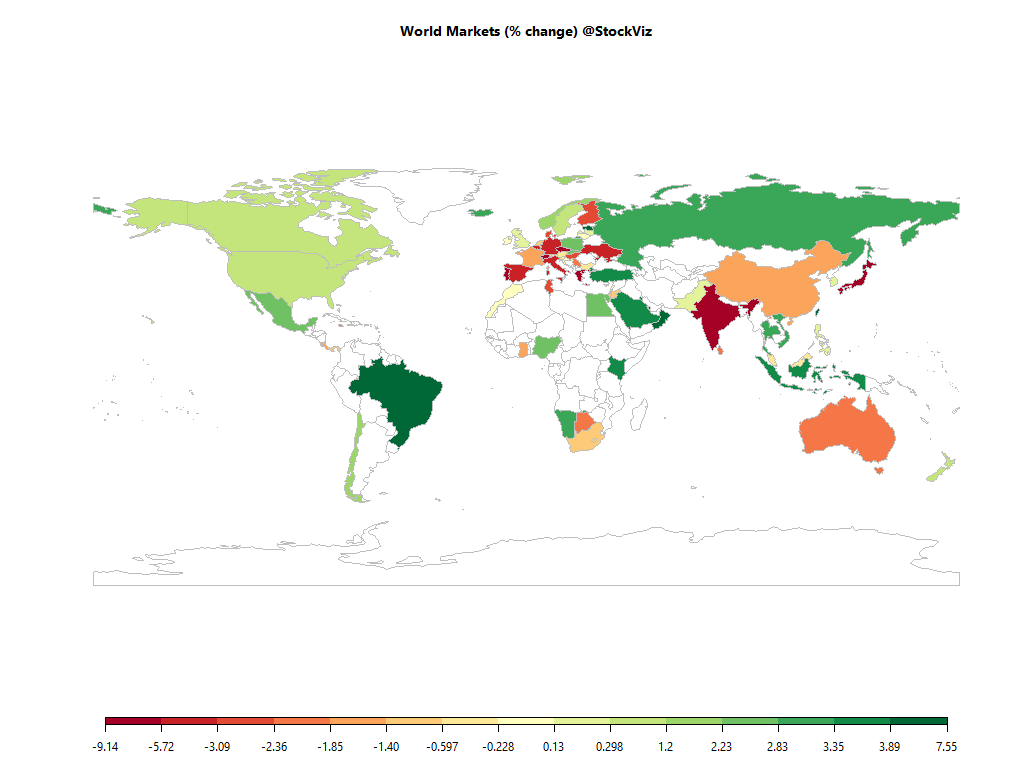
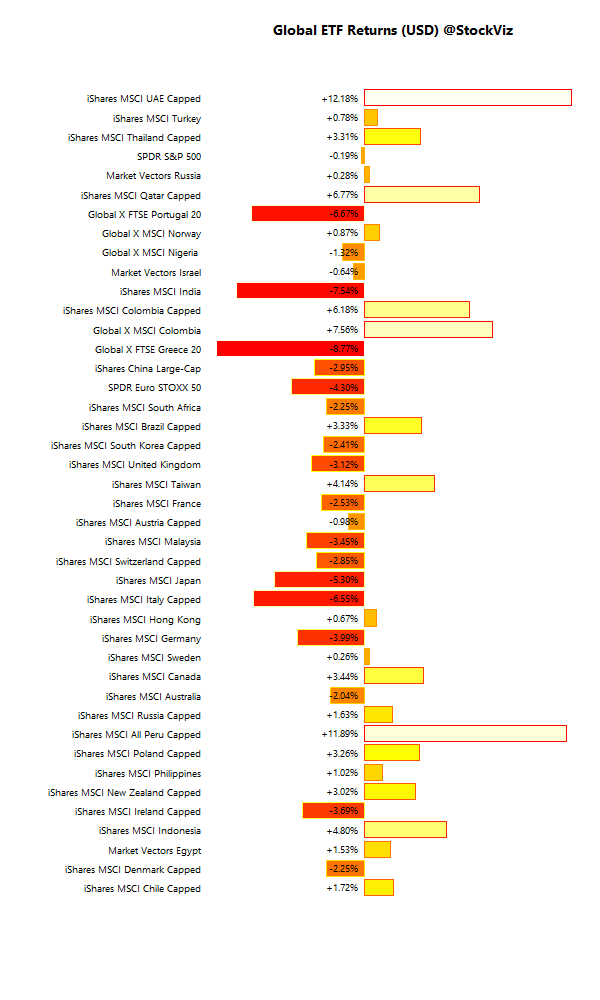
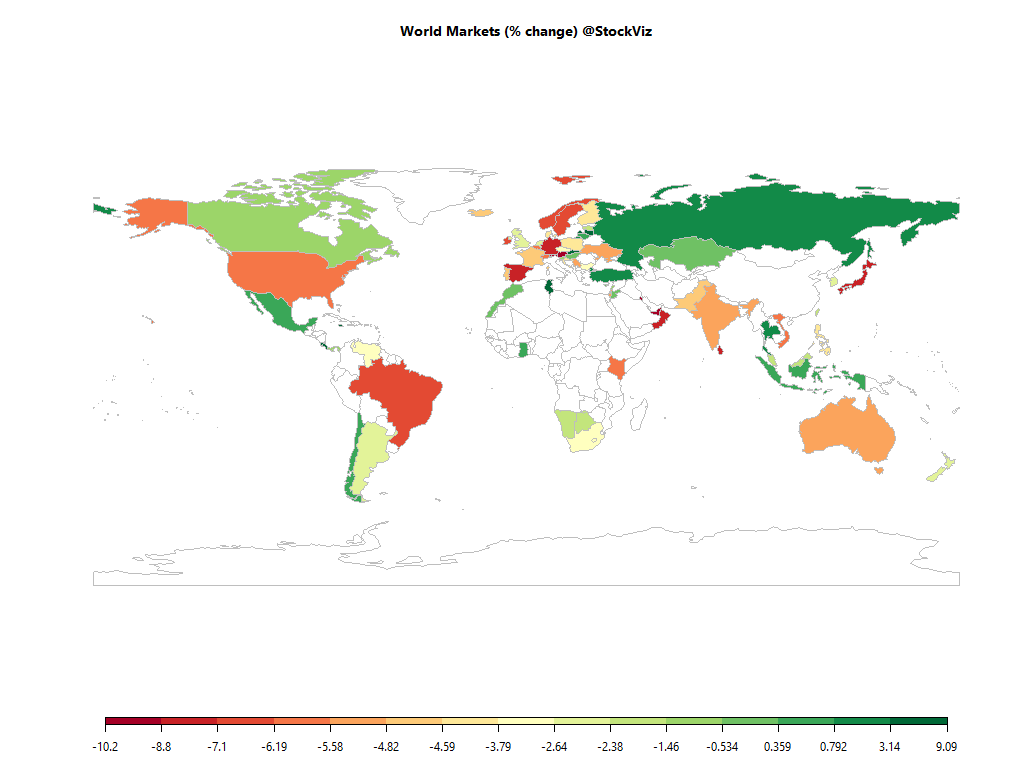
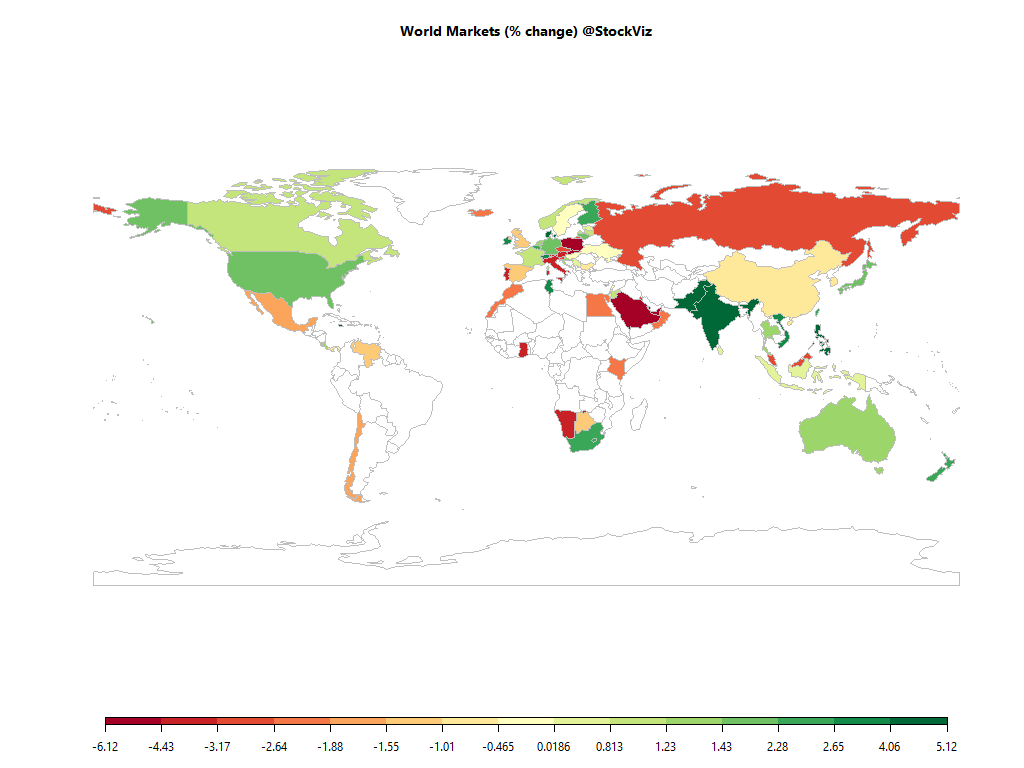
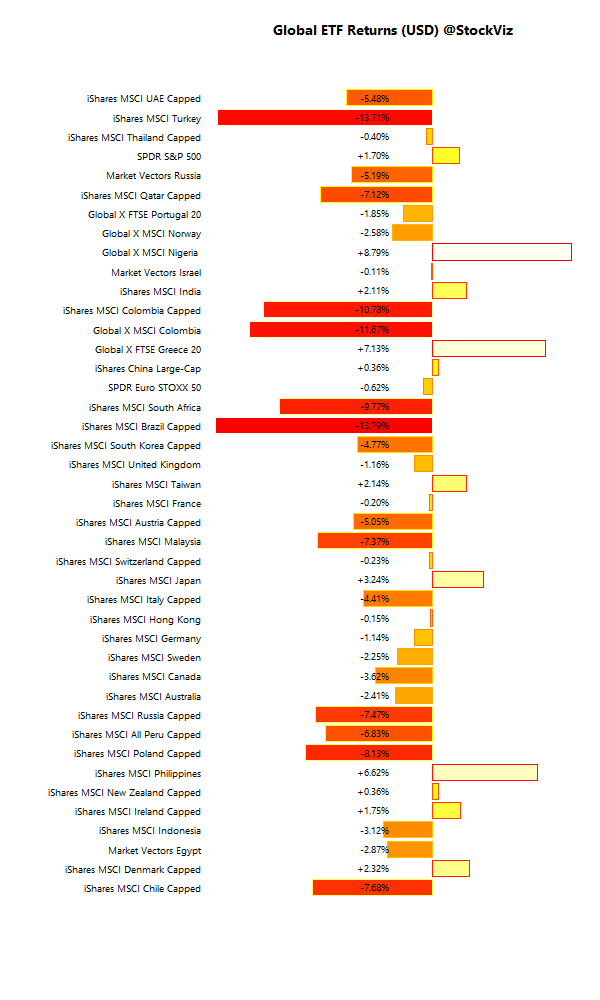
The US Dollar rallied, NIFTY was the best performing equity index…
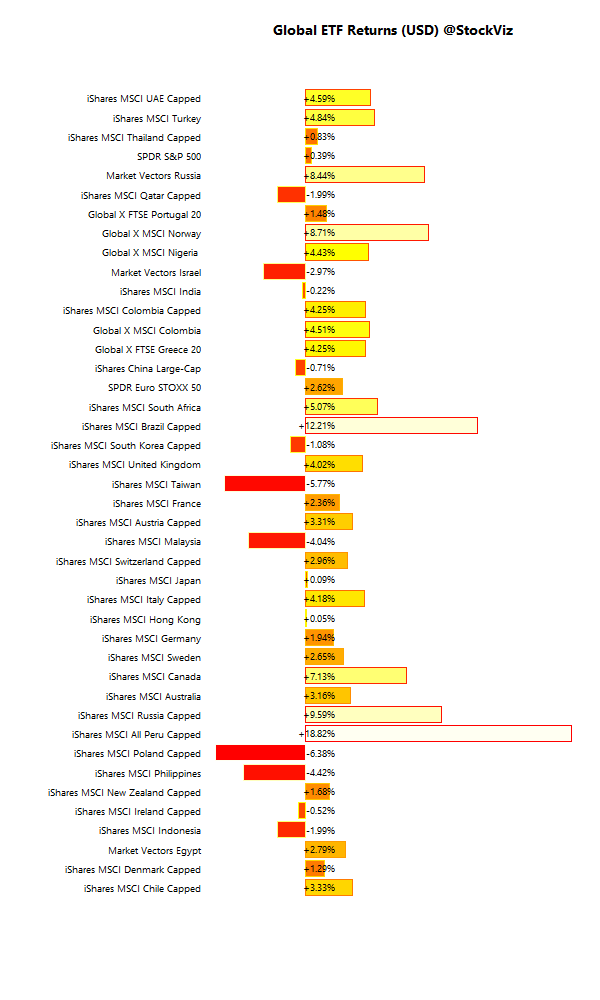
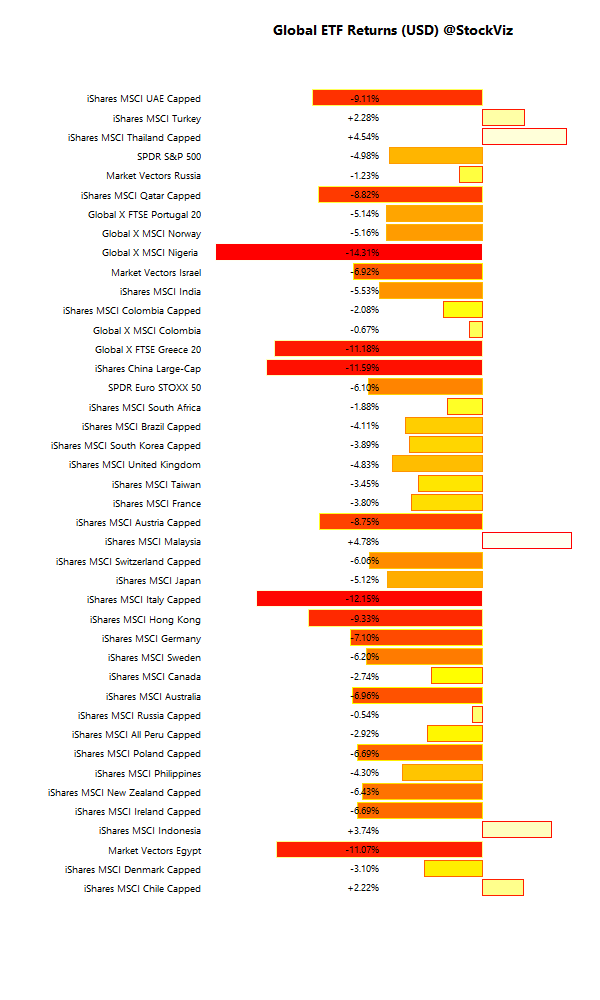
International ETFs (USD)
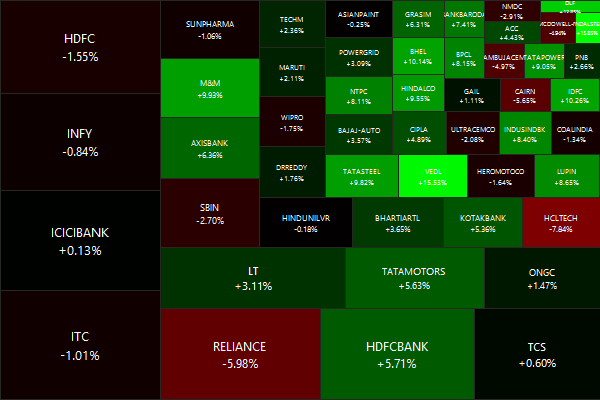
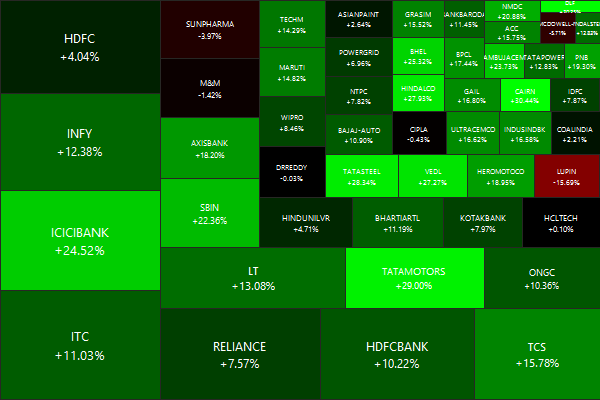
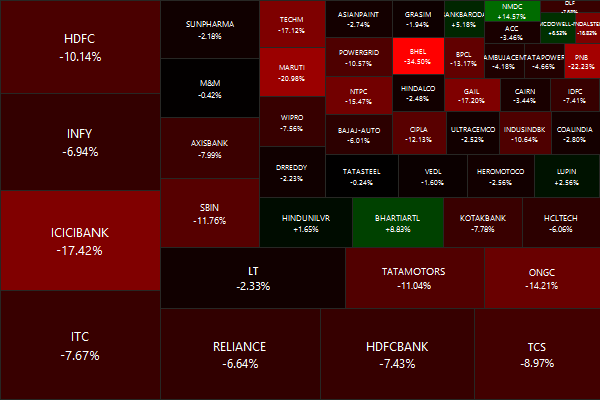
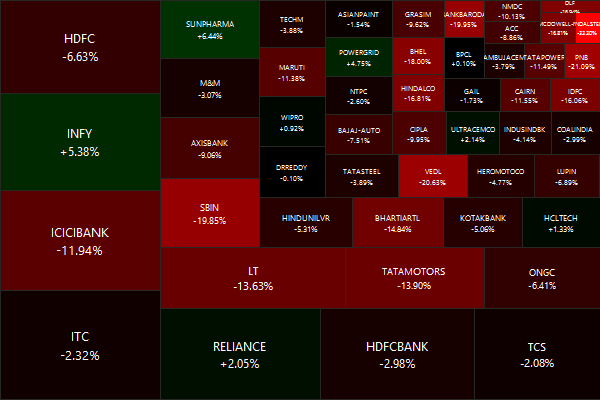
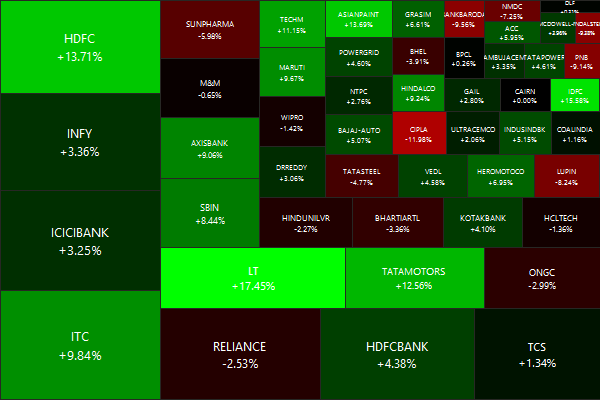
Nifty Heatmap
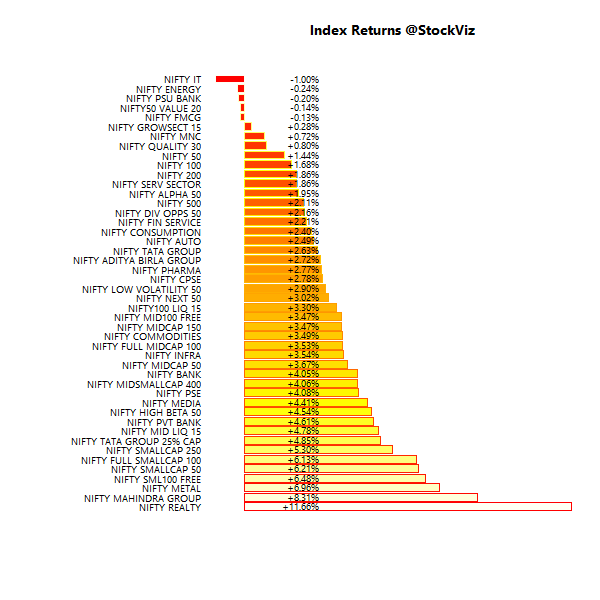
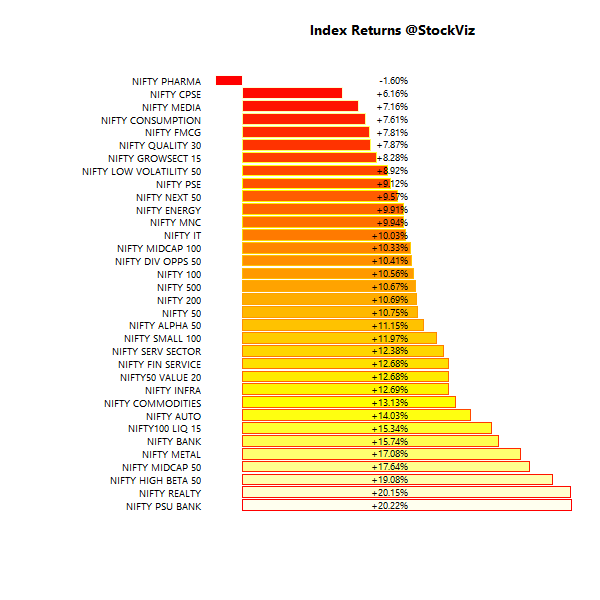
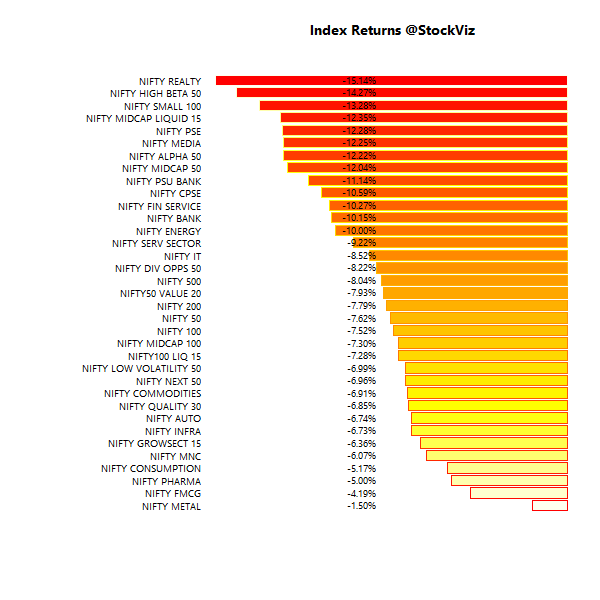
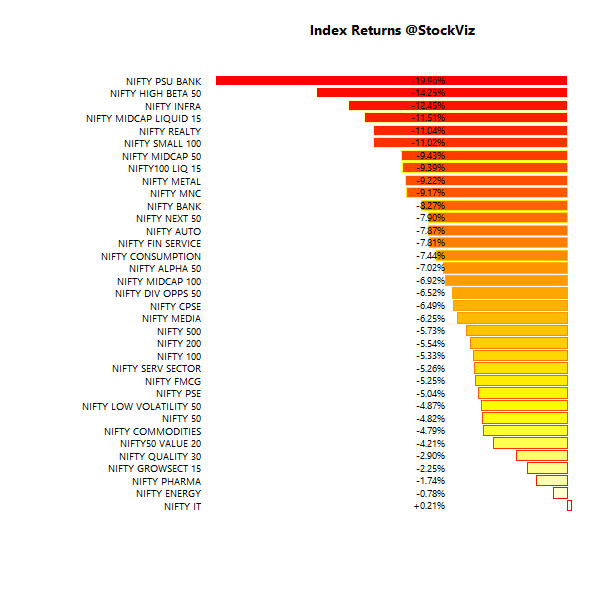
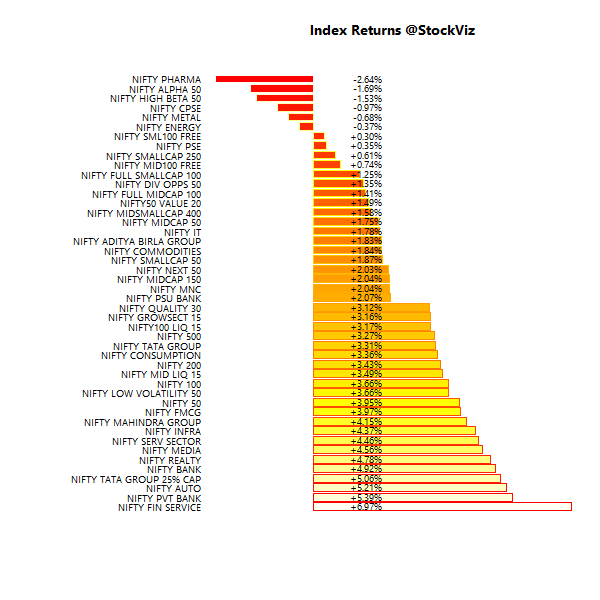
Index Returns
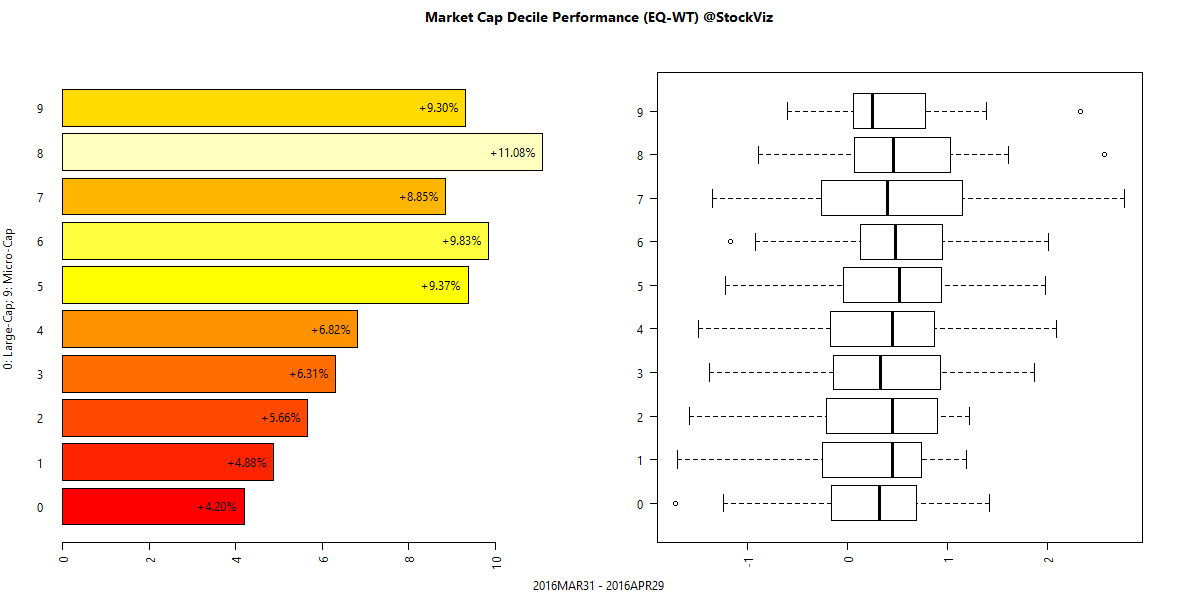
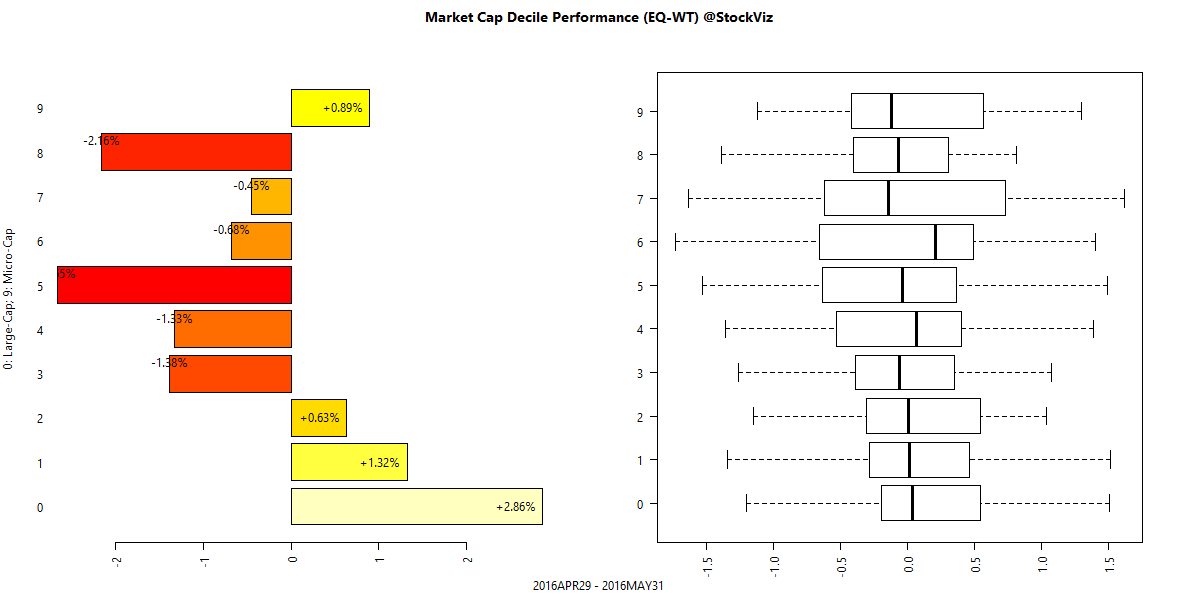
Market Cap Decile Performance
Top Winners and Losers
| PIDILITIND | +17.11% |
| LT | +17.45% |
| SRTRANSFIN | +25.19% |
| ADANIPORTS | -19.33% |
| RCOM | -16.46% |
| CIPLA | -11.98% |
Mirroring the performance of sector indices…
ETF Performance
| INFRABEES | +5.44% |
| BANKBEES | +4.88% |
| NIFTYBEES | +3.96% |
| JUNIORBEES | +2.15% |
| PSUBNKBEES | +0.93% |
| CPSEETF | -1.09% |
| GOLDBEES | -2.63% |
Infrastructure caught a bid. But for how long?
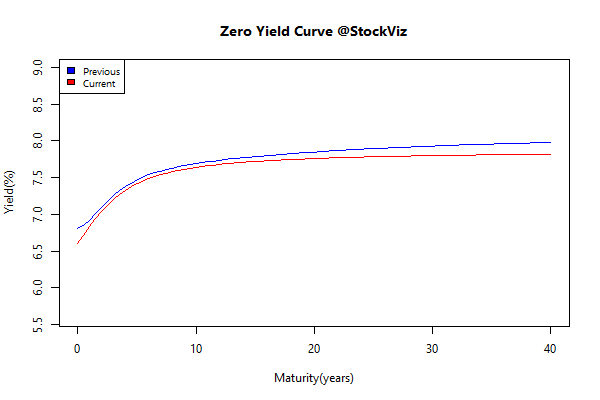
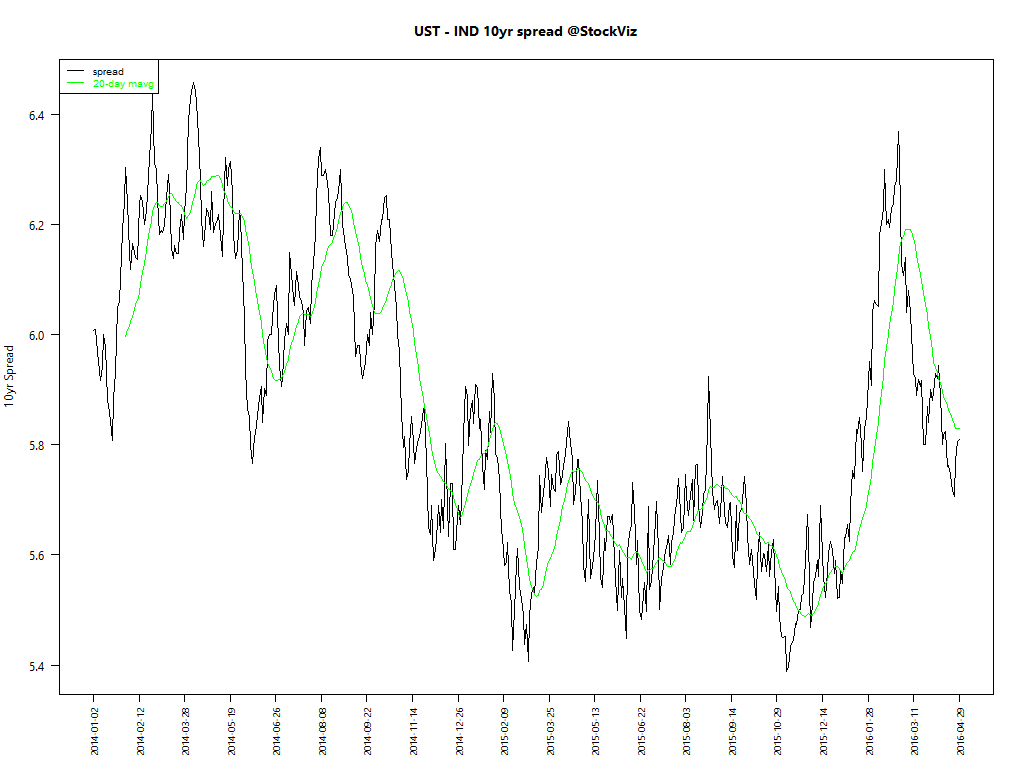
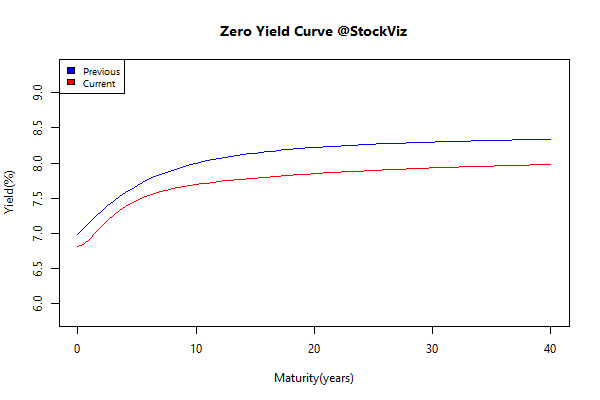
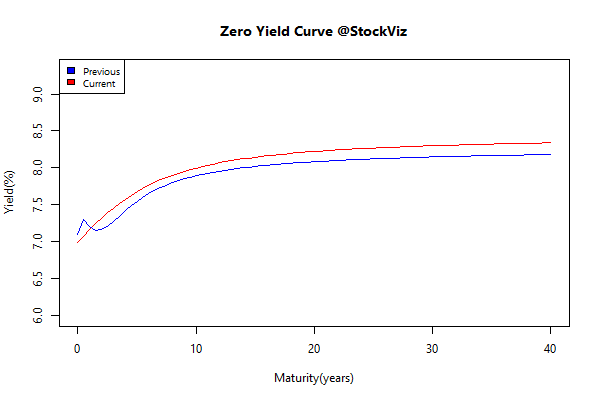
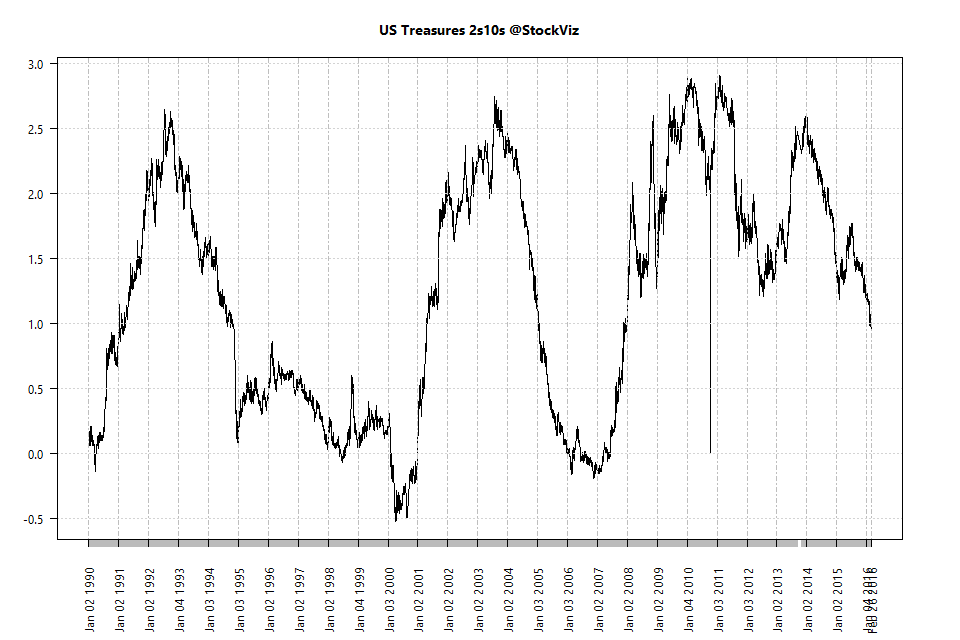
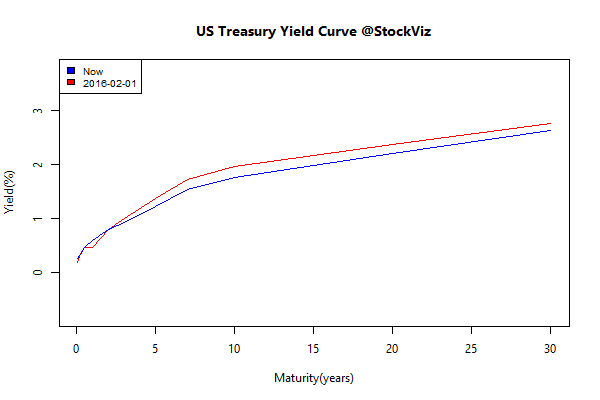
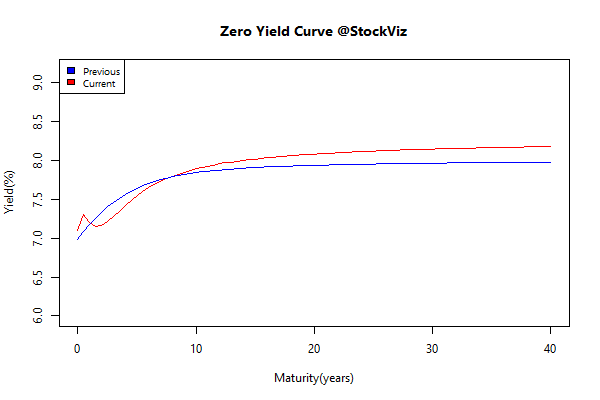
Yield Curve
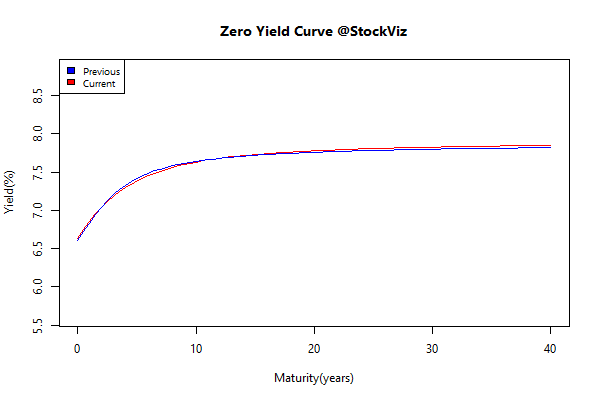
Bond Indices
| Sub Index | Change in YTM | Total Return(%) |
|---|---|---|
| 0 5 | -0.03 | +0.73% |
| 5 10 | -0.01 | +0.73% |
| 10 15 | -0.10 | +1.38% |
| 15 20 | -0.00 | +0.71% |
| 20 30 | -0.01 | +0.79% |
Bonds put in a decent performance…
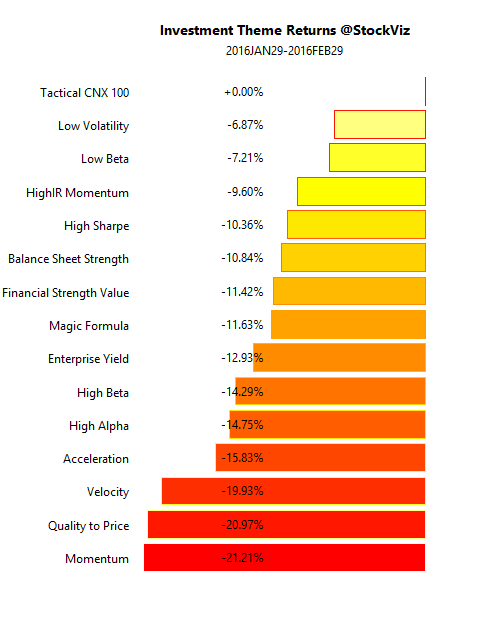
Investment Theme Performance
| Low Beta | +6.53% |
| Tactical CNX 100 | +3.05% |
| Enterprise Yield | +2.73% |
| Low Volatility | +2.72% |
| Acceleration | +2.44% |
| HighIR Momentum | +1.61% |
| Balance Sheet Strength | +1.09% |
| Financial Strength Value | +0.43% |
| Quality to Price | +0.21% |
| Magic Formula | -0.23% |
| High Beta | -1.50% |
| High Sharpe | -3.46% |
| Velocity | -4.45% |
| Momentum | -4.60% |
| High Alpha | -5.27% |
Low Beta/Volatility outperformed momentum…
Equity Mutual Funds
Bond Mutual Funds
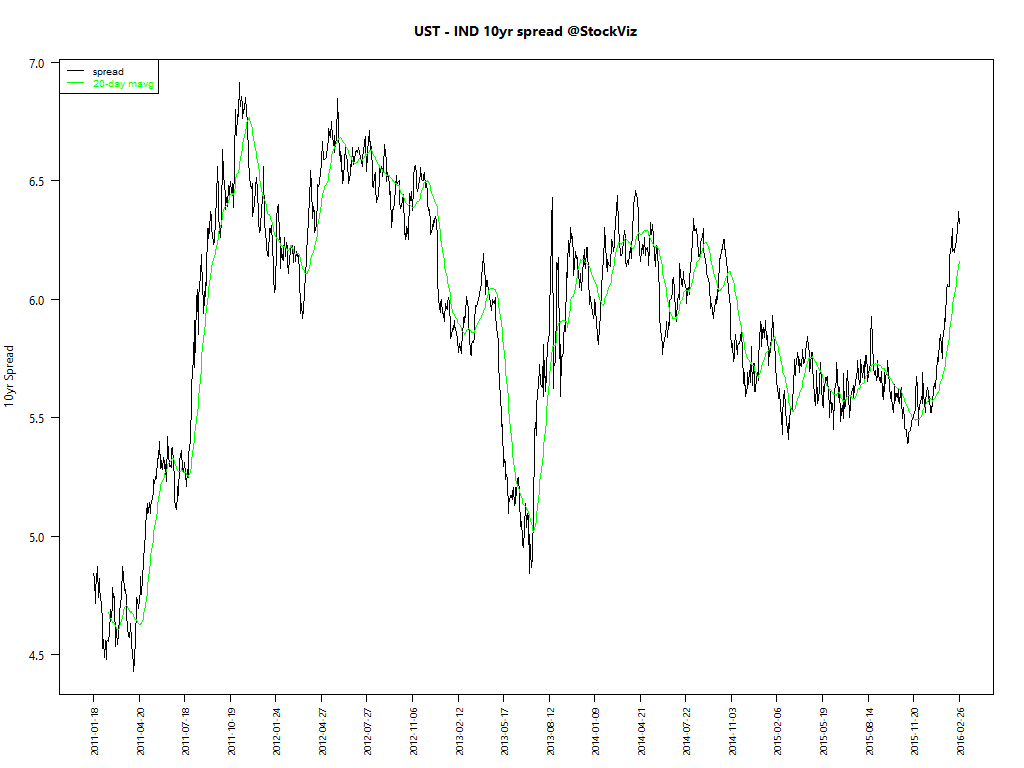
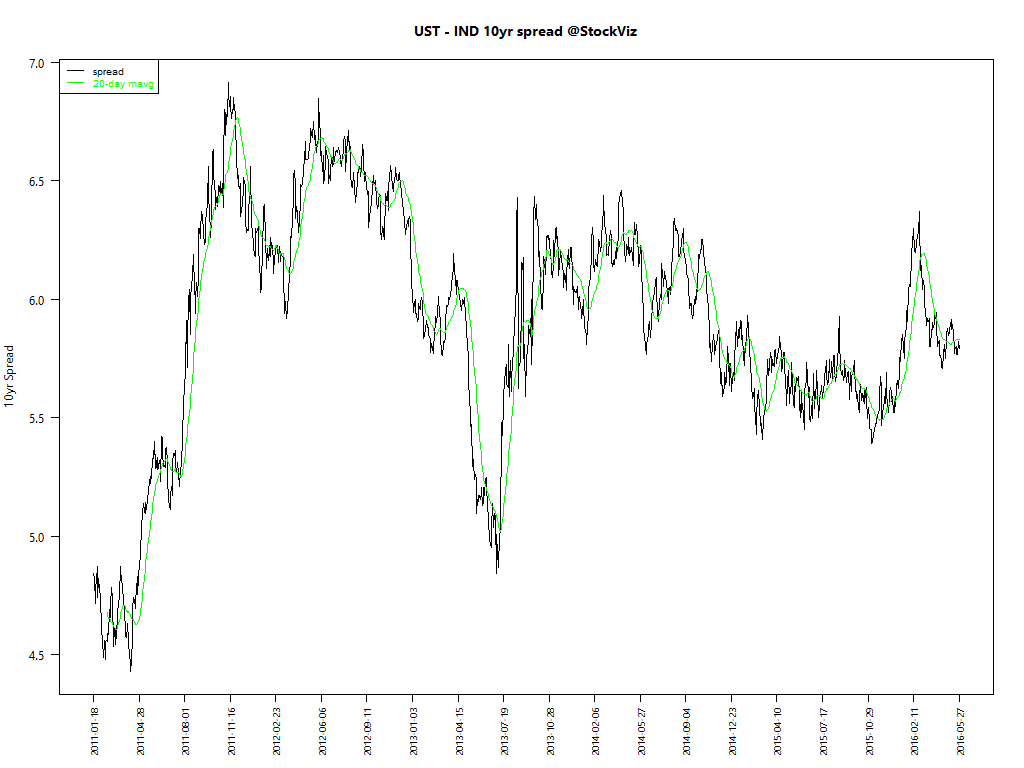
Indian bonds are cheap…
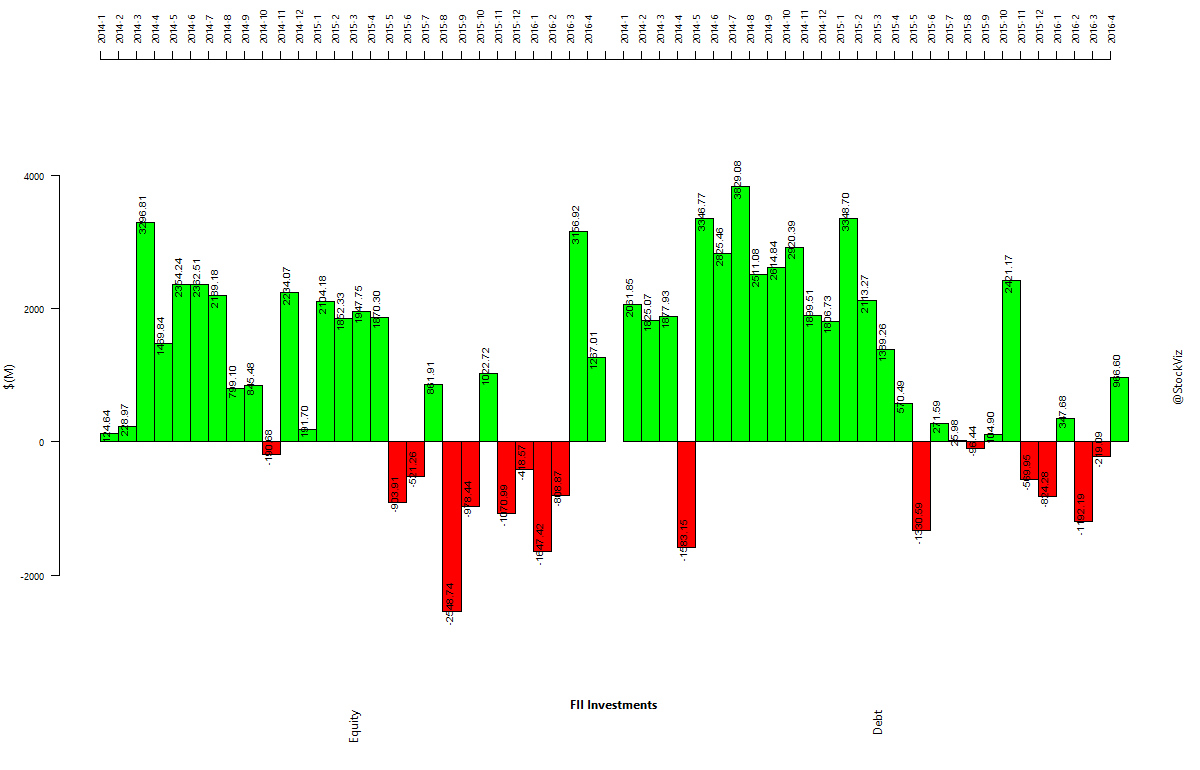
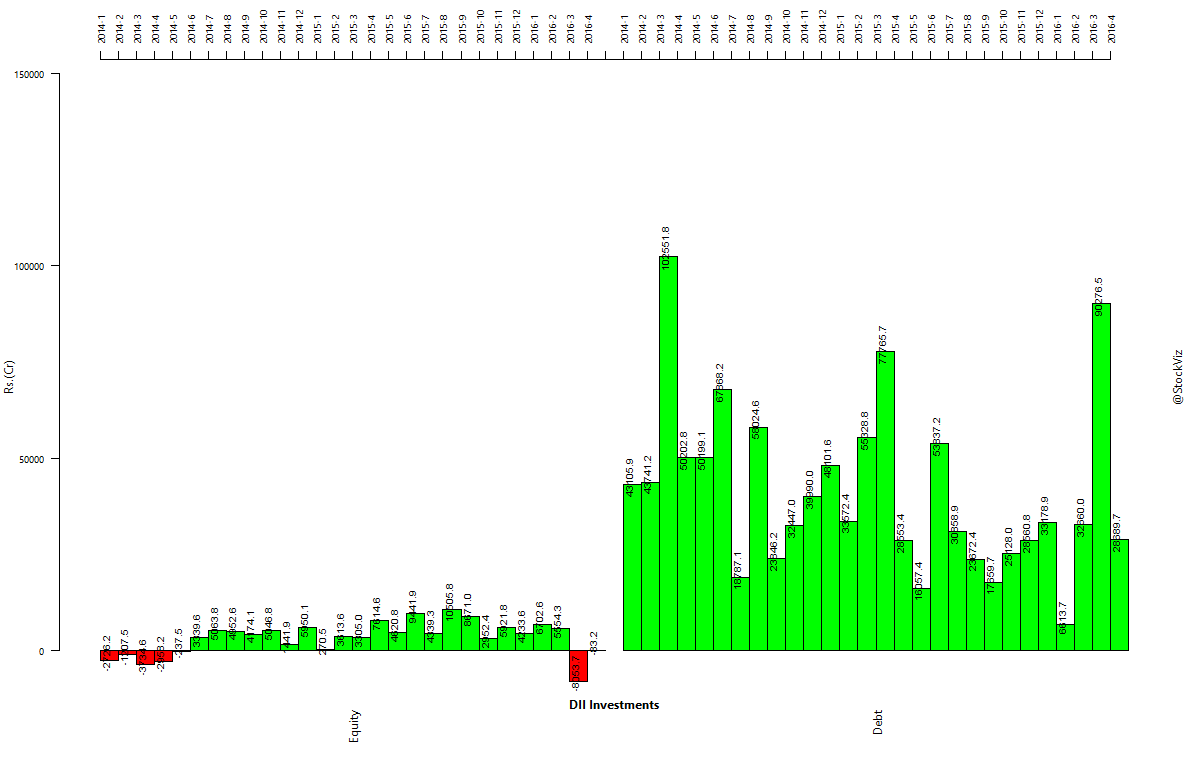
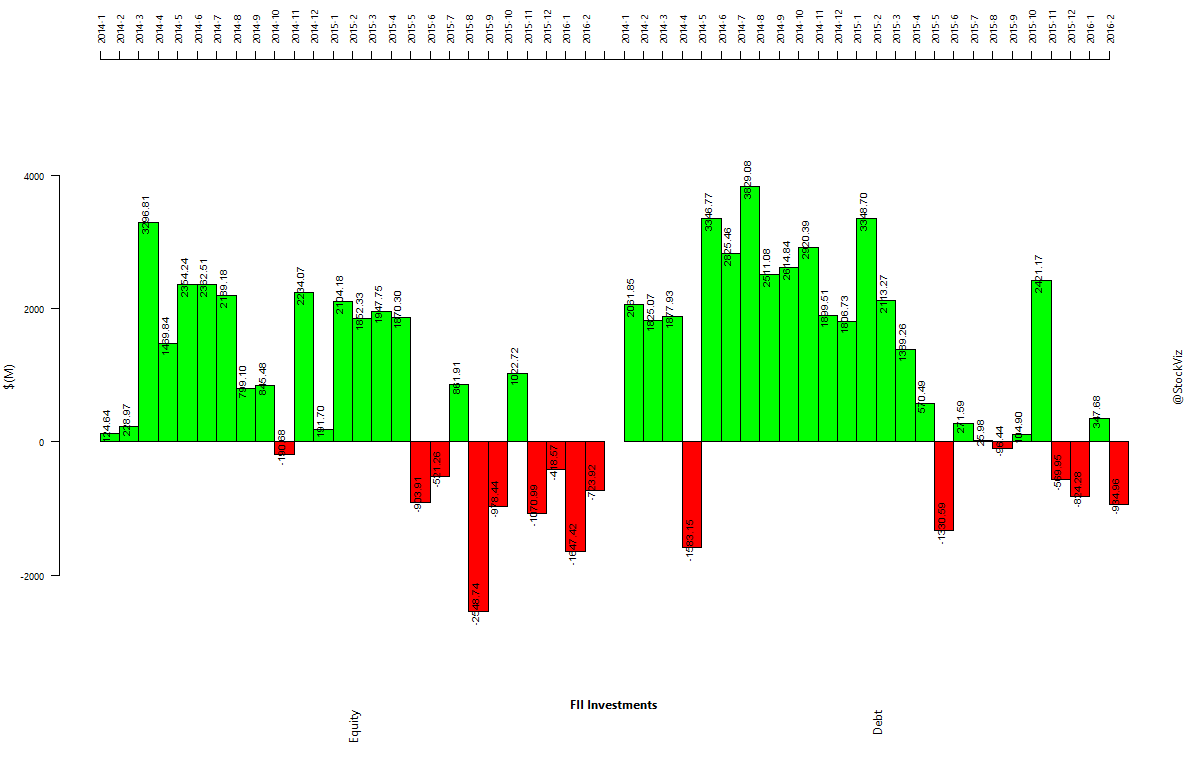
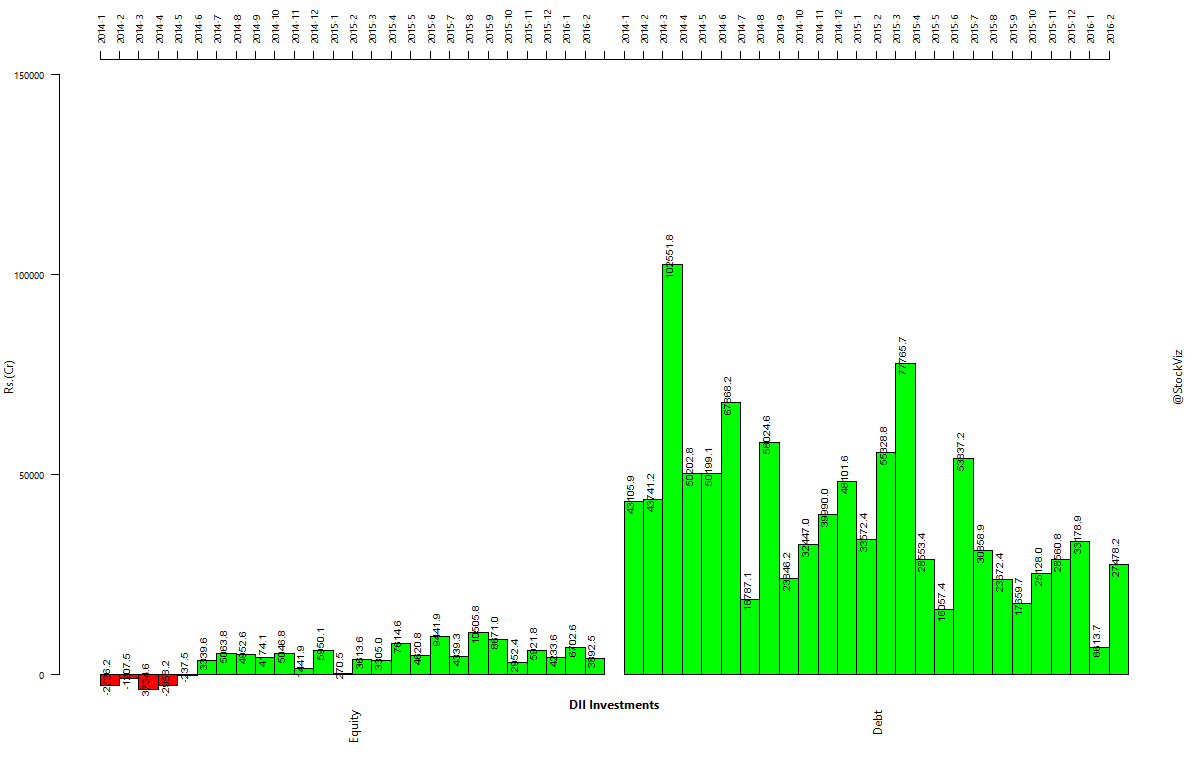
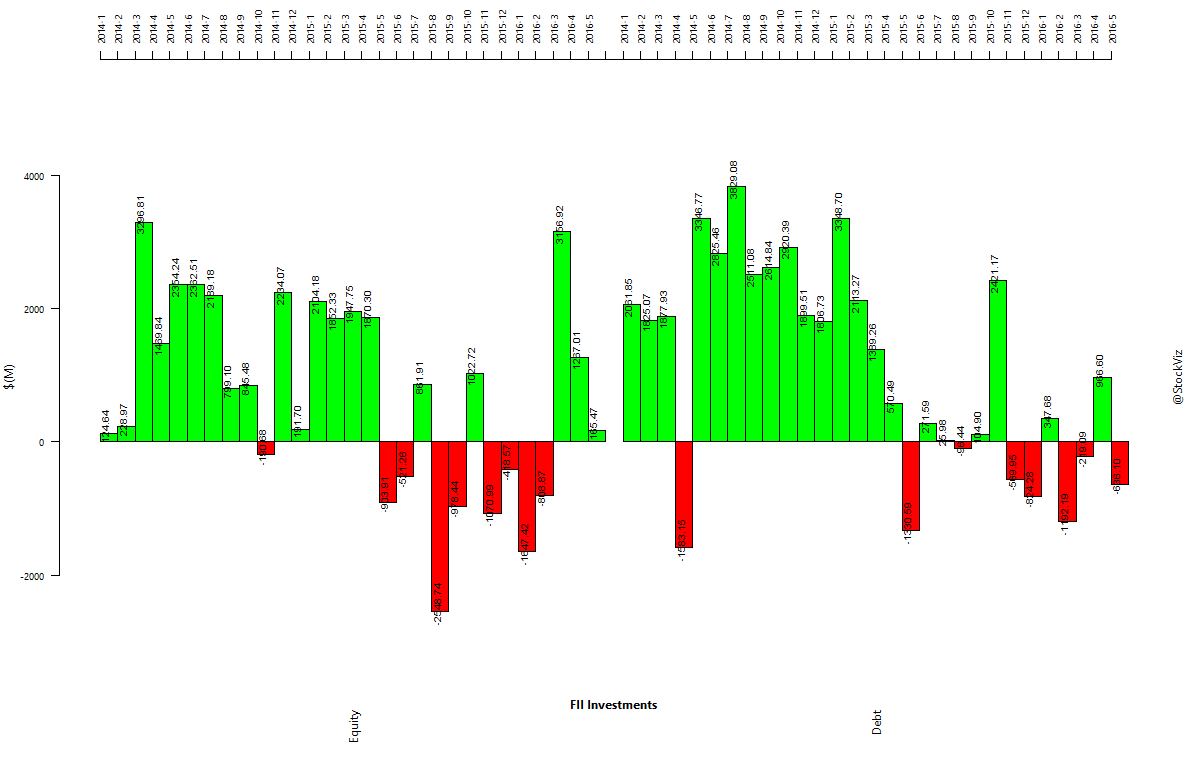
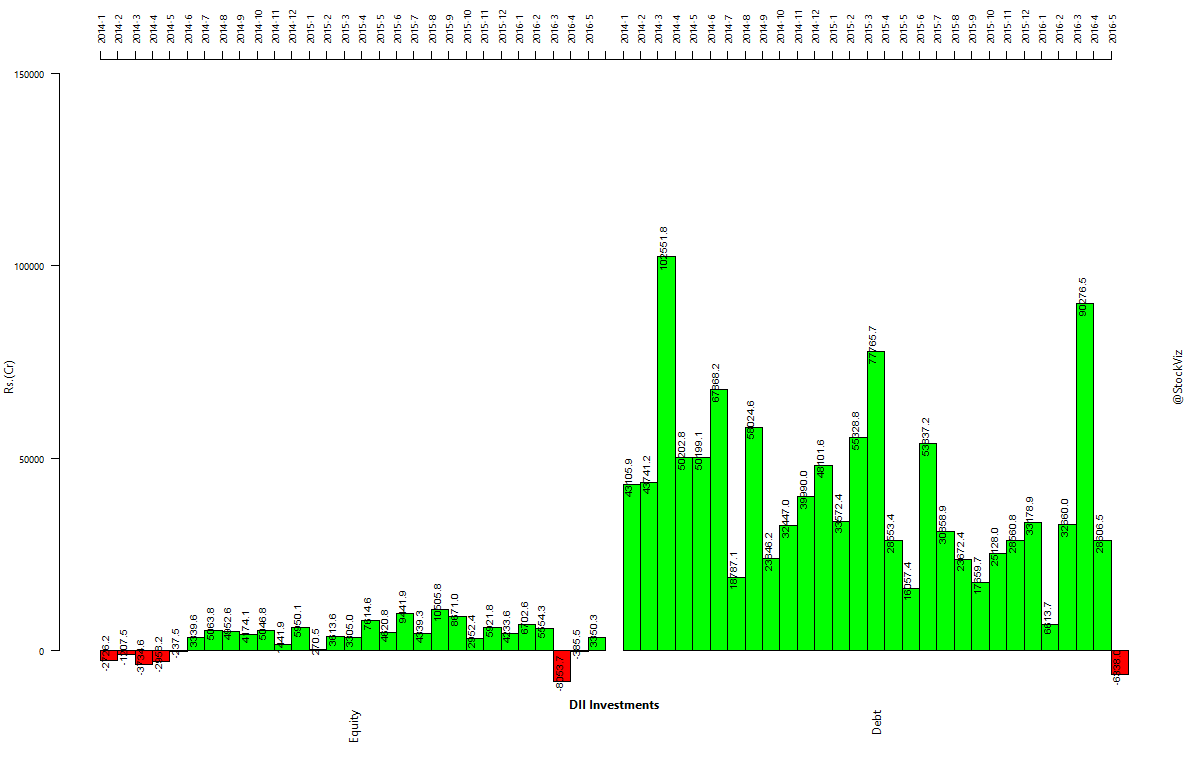
Institutional flows
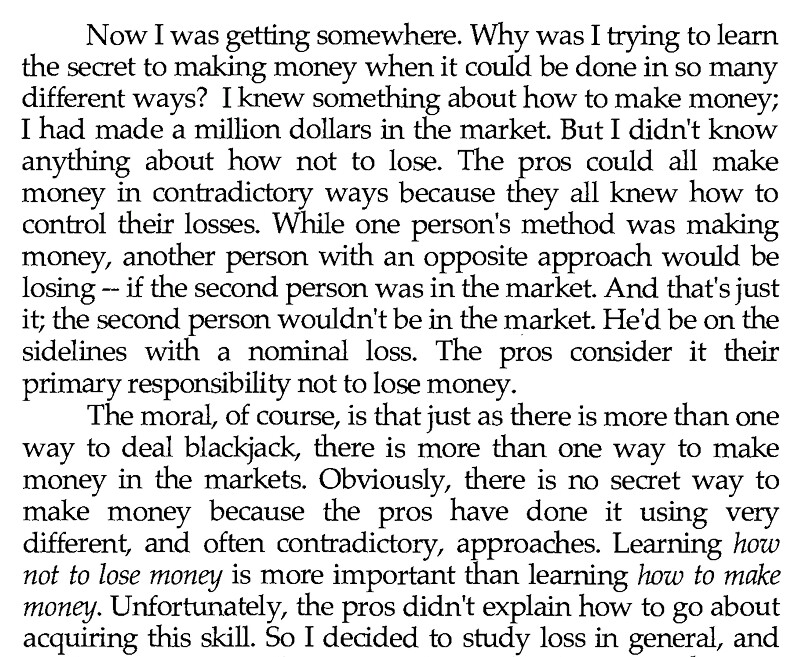
Book of the Month
Everything is interpreted through the prism of our own experiences.
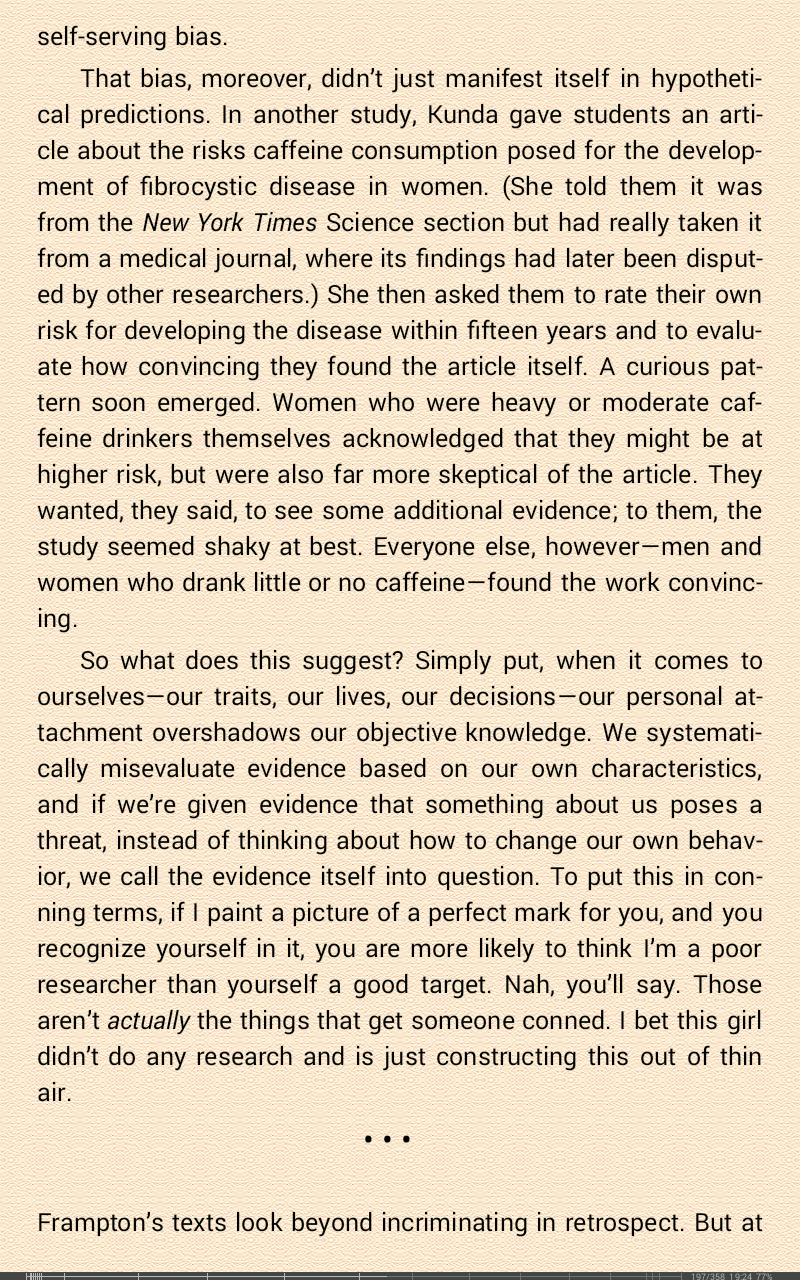
The Confidence Game: Why We Fall for It… Every Time by Maria Konnikova (Amazon)