Tag: momentum

Trend Following vs. Trend Prediction, Part II

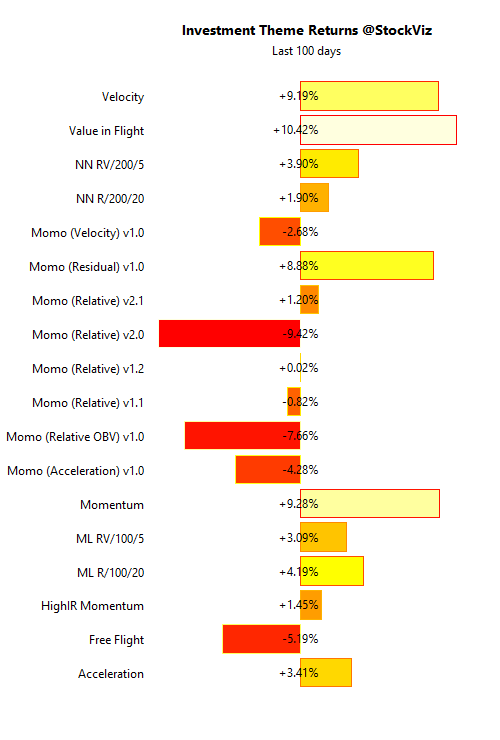
We are finally past the 100-day milestone on our machine-learning trend-following models. Here is how it compares against our other momentum models:

The ML algos out-performed a majority of traditional momentum algorithms. “NN” here stand for Neural Network and “ML” for models that use a SVM under the hood. It will be interesting to see how these models look under the 200-day lens as the short-term “luck-factor” evens out.

You can check out these models here.
The first post in this series is here.

Benchmarking against a Momentum Index

When we first launched our momentum strategy in India back in 2013, we were one of the few to openly talk about momentum as a systematic strategy. Even the thematic indices that were later launched by the NSE focused on value and beta. This resulted in momentum strategies being forced to inappropriately benchmark against market-cap weighted indices. Thankfully, that is not the case anymore.

S&P BSE Momentum Index

The BSE came out with a Momentum Index last year which can now be used to benchmark momentum strategies. An obvious flaw in this index is that it is rebalanced only once in 6 months whereas most academic research on momentum assume a monthly rebalance. However, if you look past that, it is a better alternative.

Here is how our Momo Relative Momentum strategy compares against the index:

Our risk-managed momentum strategy has out-performed the momentum index even after transaction costs.

Global Momentum Strategies

StockViz is proud to announce the launch of its momentum strategies on US, UK and Japanese stocks that are powered by the same momentum algorithms that work on our Indian Themes.

Since its launch in late 2013, our Momentum strategy has given 5x returns in India.

Thanks to Interactive Brokers, Indians can now open a global trading account and trade stocks across the world using our strategies sitting right here in India.

Check it out now and let us know what you think! Whatsapp: +918026650232

Trend Following vs. Trend Prediction, Part I

Traditional equity momentum strategies are variations of algos that try to figure out “trending” stocks so that they can be ranked to create a long/short portfolio. The key thing to remember is that these algos are following a trend, the prediction that a trending stock will continue to trend is implicit. However, using machine learning techniques, stocks can be ranked based on their predicted returns over a future time frame.

The simplest momentum strategy looks only at a price series. However, it quickly runs into problems when additional factors are overlaid on top of basic momentum. For example, you may want to filter out volatile stocks out the basket. You can do this either by setting a maximum volatility level or by weighing both momentum and volatility to arrive at a combined rank. Either approach leads to ad hoc decisions of cut off levels and the ratio with which to weigh each of those factors. Luckily, typical machine learning algorithms can work with multiple factors and weigh them based on the training set you supply.

The biggest drawback of using machine learning is that the larger the number of factors/features you use, the less explainable the resulting model becomes. As a trader, if you want to use any of these models, you should have a fairly good idea of what is going in, how the model is setup and what exactly is the model getting trained with.

As a first step in taking a crack at this, we have setup four machine learning algos. Two of them use SVRs and the other two use LR to train on data that is either return-series only or a combination of returns and volatility. You can have look at them here.

We will have more of these machine learning models out as we ramp up our understanding of these models. Stay tuned!
Transaction Cost Analysis of a Momentum Strategy

Momentum strategies have been on a tear over the last few years and have generally out-performed pure-value strategies. When we compare momentum returns with mutual funds, the most common criticism we encounter is that mutual fund returns are after transaction costs whereas our “Theme” returns are before transaction costs.

Momo (Relative) v1.1 vs ABSL S&M Fund (Annualized returns are 85.50% and 35.12%, respectively.)

The challenge we face in showing post-cost returns is that we offer different brokerage slabs to different types of clients, making a one-cost-fits-all analysis impossible. However, we can show how different brokerage slabs impact returns.

A gross return of 83.82% translates to returns of 74.20%, 69.58% and 65.08% for brokerage slabs of 0.1%, 0.05% and 0% respectively (STT of 0.1% was assumed.) Momentum out-performs even after transactions costs.