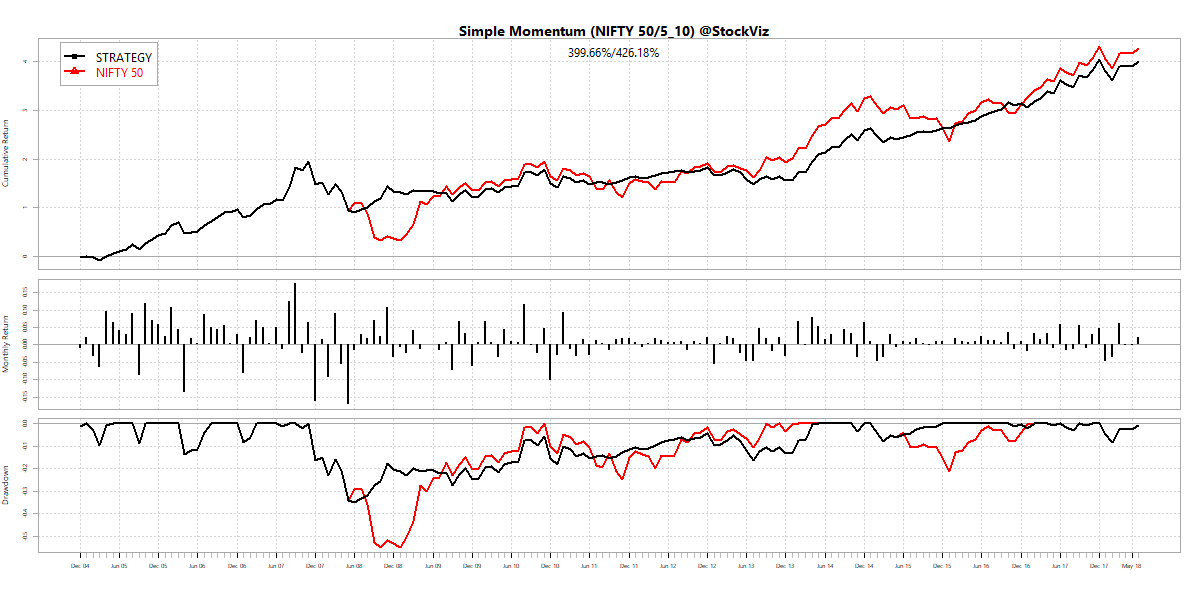
Quantitative momentum investing is fairly new in India. To compare different strategies, you need real-world data spanning a complete cycle. The best proxy for this turns out to be US listed ETFs – they have one price (unlike mutual fund share classes) and their adjusted prices can be easily downloaded. Here, we take a look at two momentum ETFs, DWAQ and MTUM, to highlight why investors should go beyond just running a screen for “momentum” and investing in whatever comes up first.
DWAQ vs. QQQ
DWAQ, the Invesco DWA NASDAQ Momentum ETF, was listed back in May 2003. QQQ is a plain vanilla market cap ETF based on the Nasdaq-100 Index. Here are the descriptions from their issuer websites:
The Invesco DWA NASDAQ Momentum ETF is based on the Dorsey Wright® NASDAQ Technical Leaders Index. The Index is comprised of approximately 100 securities from an eligible universe of approximately 1,000 securities of large capitalization companies from the NASDAQ US Benchmark Index. All securities in the universe are ranked using a proprietary relative strength (momentum) measure. Each security’s score is based on intermediate and long-term price movements relative to a representative market benchmark and the other eligible securities. The top 100 securities are selected for the Index. (Invesco)
The Invesco QQQ is an exchange-traded fund based on the Nasdaq-100 Index®. The Index includes 100 of the largest domestic and international nonfinancial companies listed on the Nasdaq Stock Market based on market capitalization. (Invesco)
Here are their relative returns:
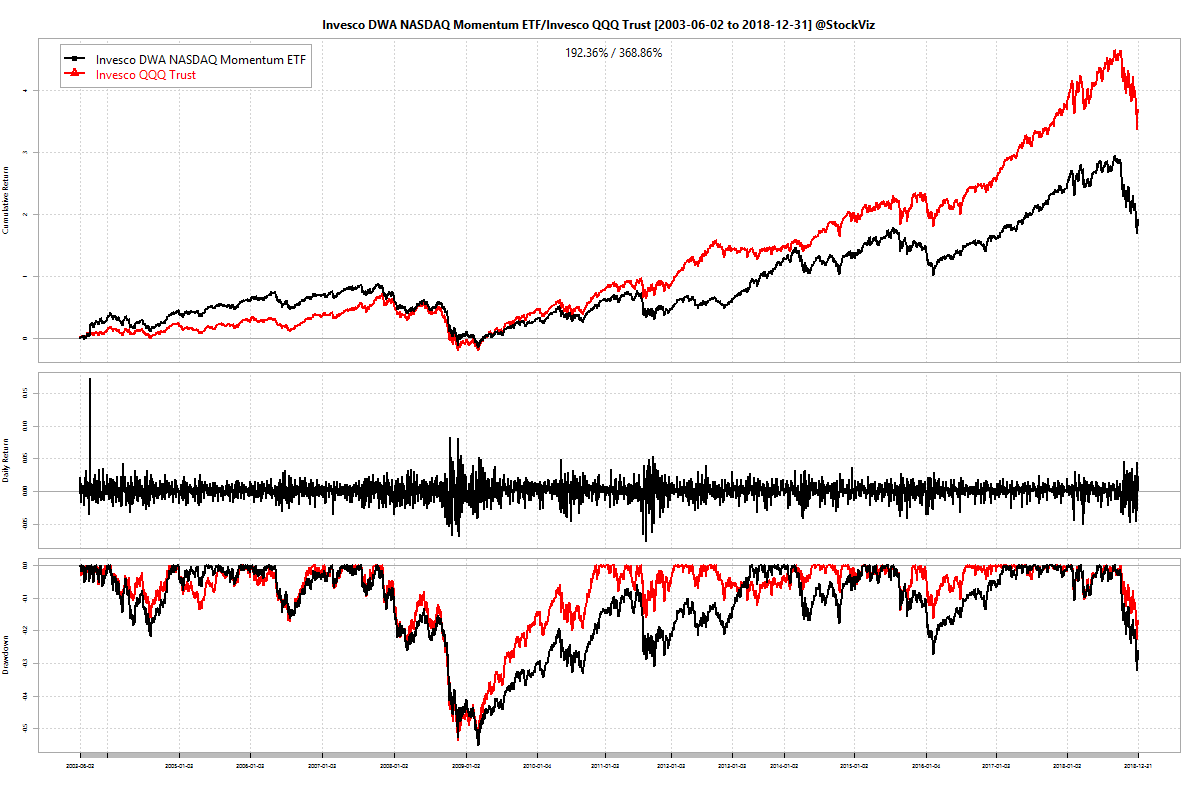
Not the torch bearer for momentum that we had hoped for.
MTUM vs. VONE
MTUM, the iShares Edge MSCI USA Momentum Factor ETF, came a good 10 years after DWAQ. Not constrained just to the Nasdaq, it provides wider exposure to large- and mid-cap U.S. stocks exhibiting relatively higher price momentum. (iShares) It is only fair that we compare it to VONE, which is Vanguard’s Russell 1000 ETF. Russell 1000 covers most of the US large- and mid-cap universe. (Vanguard)
Here are their relative returns:
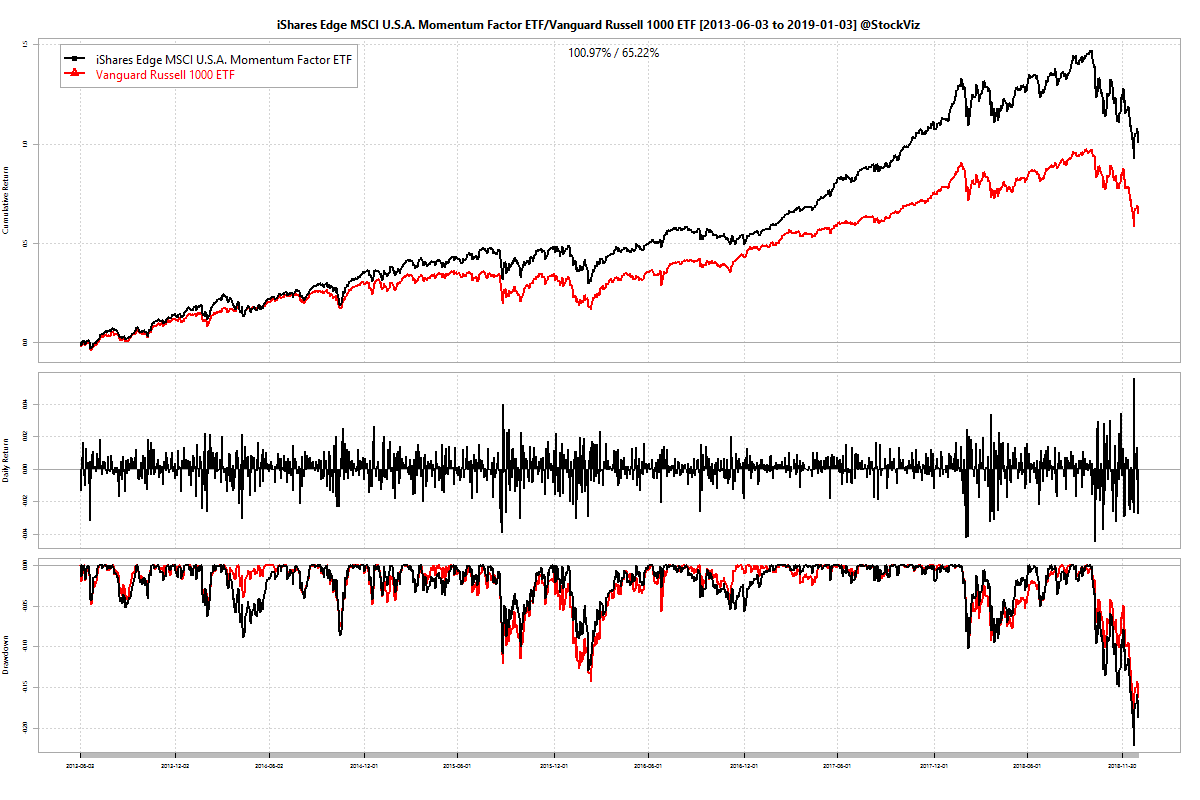
Not bad! That’s almost a 4% difference in annualized returns.
MTUM vs. DWAQ
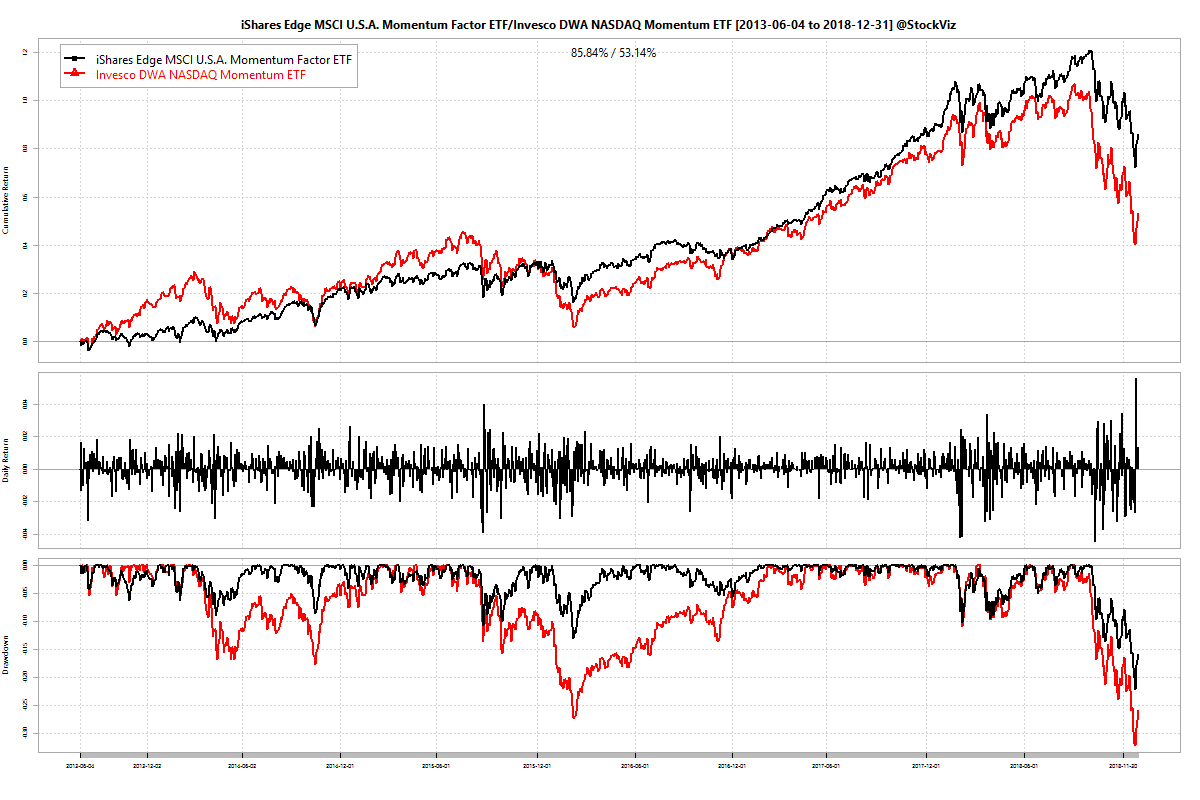
DWAQ trailed MTUM by about 5% in annualized returns for the period. Probably because it has a more diversified portfolio compared to MTUM’s. This should have lead to shallower drawdowns but that is not the case – DWAQ returns are a lot more volatile than MTUM’s. Will MTUM’s volatility adjusted price momentum continue to out-perform DWAQ’s “proprietary relative strength” momentum? Who knows?
If you think it is a tough job deciding between the two, consider this: there are over 40 momentum ETFs currently listed in the US. Each one slices the data a bit differently, making it absolutely essential that you peek under the hood before you click that buy button!
Charts created using the StockViz Compare Tool.