Tag: momentum

Why Anomalies Persist

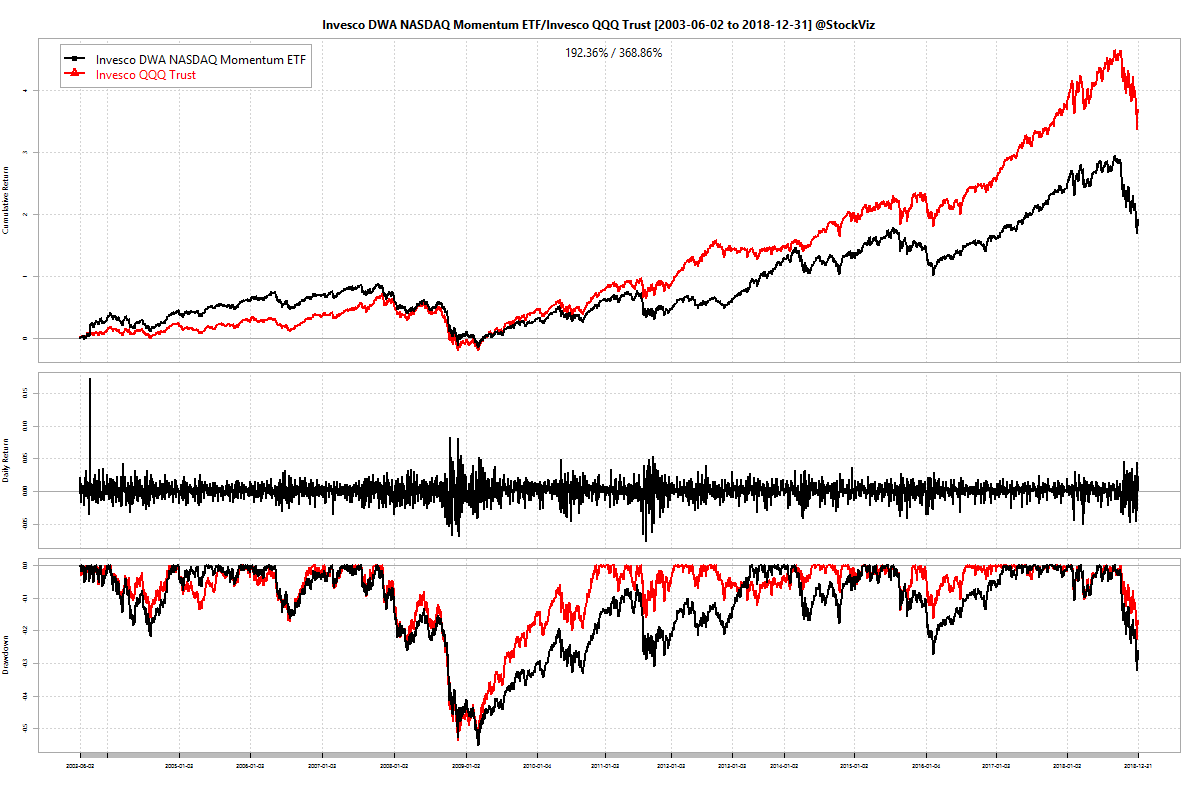
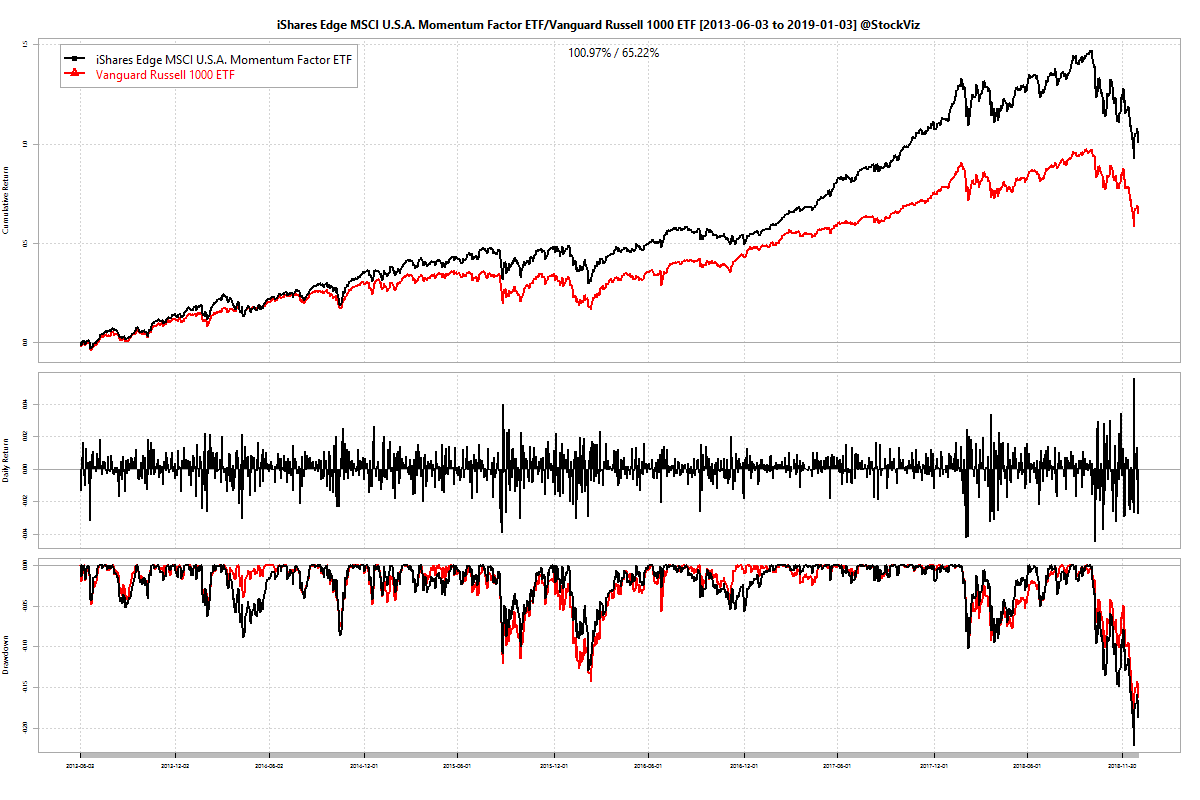
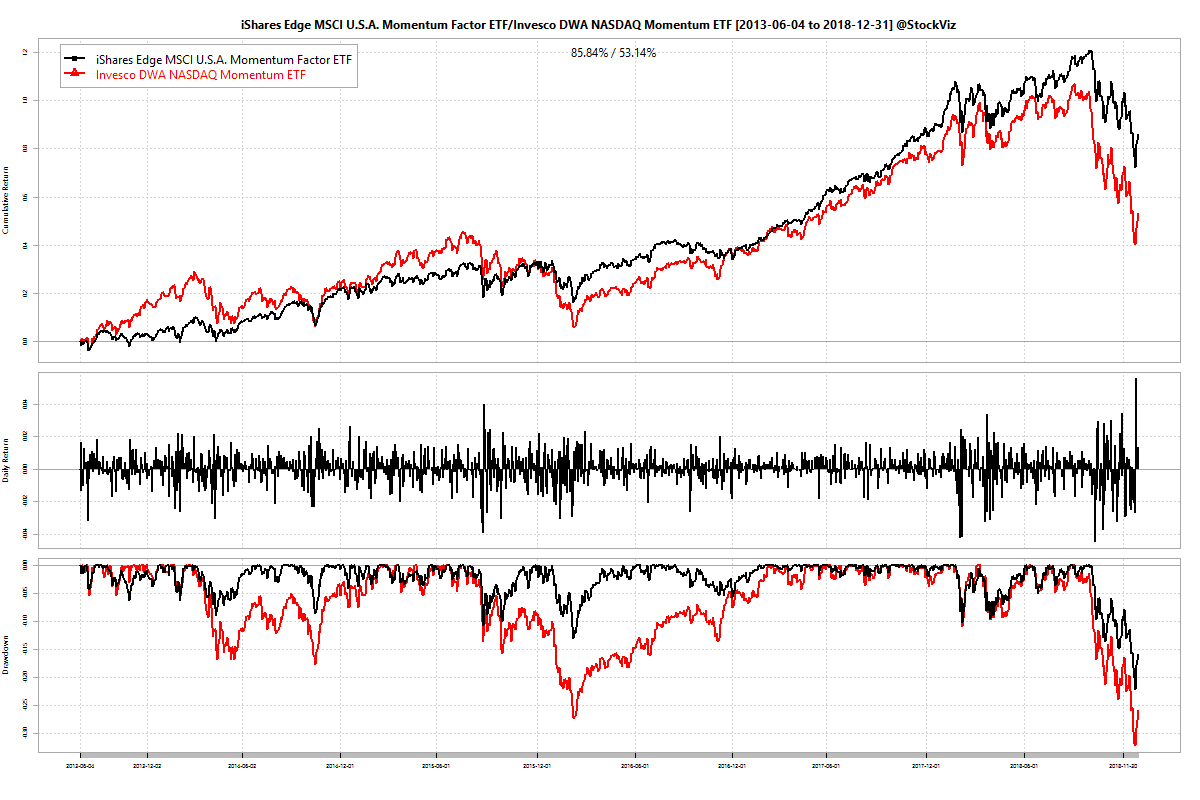
Academics label momentum as an “anomaly.” Multiple studies have shown that this anomaly has persisted over long periods of time and across markets (AA). Based on this insight, quite a few quantitative momentum funds sprung up. And since nothing good is ever left alone at Wall Street, a whole bunch of momentum factor ETFs launched to ride the wave during the recent bull market. Currently, there are more than 40 momentum ETFs listed in the US.

So, does this mean that the momentum anomaly has been arbitraged out? After all, with over $12 billion in momentum ETFs alone, shouldn’t the strategy have topped out? We posit that it is unlikely to happen anytime soon. Why? Because investors just can’t help themselves.

Consider the asset under management (AUM) of these momentum ETFs. If, for an ETF, the price is down 10% and its AUM is down 20% over the same period, it means that there has been a net outflow of 10%. If you run this math on all the momentum ETFs traded in the US since October this year, you end up with about $2 billion in outflows in 3 months. That is roughly 11.5% of momentum assets on the 1st of October.

It has been well documented that investors chase performance, often piling into “hot” funds and strategies and exiting on the slight whiff of under-performance. We are seeing this in action on momentum ETFs. And as long as investors are caught in this doom-loop, momentum (and by extension, value, investment and volatility anomalies) will persist.

Also read: Investor education is a waste of time (Aug, 2014)

Code and data are on github.

Momentum, Growth and Market-cap Weighted

Momentum and growth investing are not the same and investing in a market-cap weighted index is not the same as momentum investing.

Momentum Investing

One-liner: A portfolio that is long the stocks that have gone up in price over the last one year will out-perform the market.

There are a number of ways to measure price appreciation. Mainly:

  1. Relative: Compare how price has appreciated in comparison to the market. Rank from largest to smallest.
  2. Absolute: Rank returns from largest to smallest.
  3. Acceleration: Compare how price has appreciated in the last 6-months vs. how price appreciated in the prior 6-month period. Rank from largest to smallest.

The one-year formation period is by no means carved in stone. Some portfolios measure momentum over different time-periods and blend them together.

Additionally, the following preference overlays can be applied:

  1. Stocks with lesser volatility.
  2. Stocks that rise up in price gradually (linear) over ones that have gone up like a hokey stick (parabolic.)
  3. Liquid stocks over illiquid ones to reduce trading frictions.
  4. A trailing stop-loss over strict scheduled rebalancing to manage stock-specific risk.

Growth Investing

One-liner: A portfolio that is long the stocks whose earnings have grown at an above-average rate relative to the market will out-perform the market.

There are number of ways to measure earnings growth. Mainly:

  1. Total sales: Compare this year’s revenue over previous years’.
  2. EBITDA: Compare this year’s operating performance over previous years’.
  3. EPS: Compare this year’s earnings per share over previous years’.

All these measures involve gotchas. For example, any of the following actions taken by the company will boost revenue:

  1. Increase the asset base – setup a new factory.
  2. Increase leverage – take on more debt/buy-back stock.
  3. Compromise on margins – lower prices.

Also, there could be temporary structural shocks – natural disasters/policy shifts – that takes out supply/boosts short-term demand for a company’s/sector’s products.

Market-cap Weighted

One-liner: A committee meets every six months and creates a basket of stocks primarily based on their market cap (number of shares outstanding x price.) This basket defines the market.

Passive investors invest in such a basket through index funds or ETFs and get on with their lives.

The long-arch

All investment strategies have their day/year/decade under the sun and neither are necessarily “better” than the other. It depends on the investor’s task at hand. As an analogy, whether you use a flat-head or a Phillips screw is all nuance when compared to task at hand: screwing. But it is important to know the difference between these investing approaches and not get confused between them.

Simple Momentum with Transaction costs and Taxes

The earlier post on a simple momentum strategy ignored transaction costs and taxes. Typically, these are added to backtests where gross profits are high enough to consider them for further analysis. However, one of readers requested that we add these costs to get an idea of their effect on returns.

To keep things simple, we assumed a 25bps net transaction cost and a 10% tax on gains. The tax part is a bit tricky so we ran the analysis with some simplifying assumptions. Follow the github link to the code if you are curious.

Running with these assumptions, transaction costs and taxes lopped 82% off gross returns over Jan 2005 through June 2018.

cumulative midcap 100 simple momentum strategy returns after transaction costs and taxes

What kills you are the taxes, not the transaction costs. There were only 17 trades throughout the period. It is the 10% tax on gains that ruins the compounding.

Code and other charts are on github. Look for ones with a ‘tx’ in the suffix.

Simple Momentum

Michael Batnick, in his blog titled “Simple Momentum,” proposes a strategy that follows a simple rule:

If the S&P 500 outperformed 5-year U.S. treasury notes over the previous twelve months, invest 100% of this portfolio in the S&P 500 in the following month. If the 5-year U.S. treasury notes outperformed the S&P 500 over the previous twelve months, invest 100% of this portfolio in bonds in the following month.

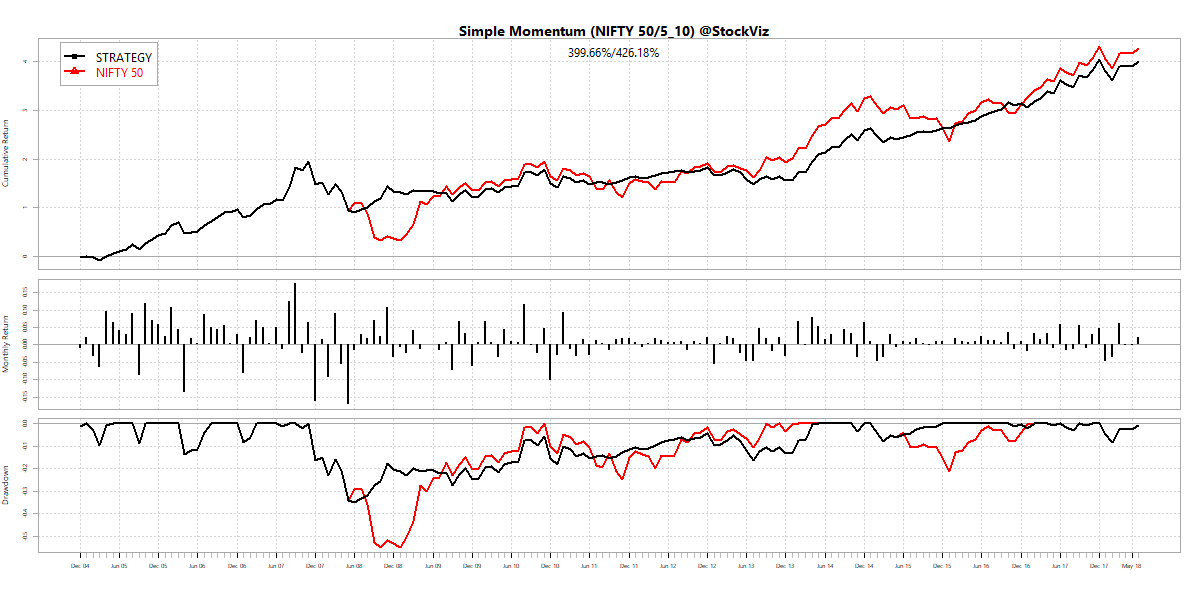
It outperformed the S&P 500 with significantly lower drawdowns. Could the same strategy work with Indian indices? We took NIFTY 50 and MIDCAP 100 indices and paired it with the 5-10 year tenure gilts.

Returns

The strategy returns are significantly lower than a simple buy and hold. December 2004 through June 2018, the NIFTY 50 version of it under performed buy and hold by 6% and the MIDCAP 100 version by 34%. This is before transaction costs and taxes. Here are the cumulative return charts:

NIFTY 50 simple momentum

MIDCAP 100 simple momentum

Drawdowns

The simple momentum strategy did have lower peak drawdowns than a buy and hold:

NIFTY 50 simple momentum drawdowns

MIDCAP 100 simple momentum drawdowns

What keeps you out of the troughs also ends up keeping you out of the peaks. This is highlighted by how the strategy behaved in 2008 and 2009:

NIFTY 50 simple momentum annual returns

Conclusion

The simple momentum strategy is perhaps too simple. The backtest doesn’t capture transaction costs and taxes that would further ding the already lagging gross returns.

You can peruse the code and the charts used in this blog on github.

Relative Momentum Back-test

Daily data of over 35,000 global indexes published by NASDAQ OMX including Global Equity, Fixed Income, Dividend, Green, Nordic, etc. are available for free download on Quandl. Out of which about 1000 indices are USD denominated Total Return (TR) indices. We were curious to find out the result of applying our Relative Momentum algorithm on this subset. We also wanted to know if the rank of the Indian TR Index within this subset can be used to time NIFTY or MIDCAP investments. To know more, download the pdf Relative Momentum Back-test.

The charts in the document are low-res. Whatsapp us on +918026650232 for the high-res ones.