GARCH(1,1)
GARCH(1,1) is a common approach for modeling volatility. They were developed by Robert Engle to deal with the problem of auto-correlated residuals (which occurs when you have volatility clustering, for example) in time-series regression.
What we did:
- Picked the best fit ARIMA(p,d,q) model for historical VIX over different look back periods
- Created a GARCH(1,1) model based on ARMA(p,q)
- Predicted t+1 VIX
500-day lookback
We found that modeling based on the previous 500-day VIX closing levels gave us the least prediction errors. The appendix has the charts for other lookback periods.
Prediction vs. Actual
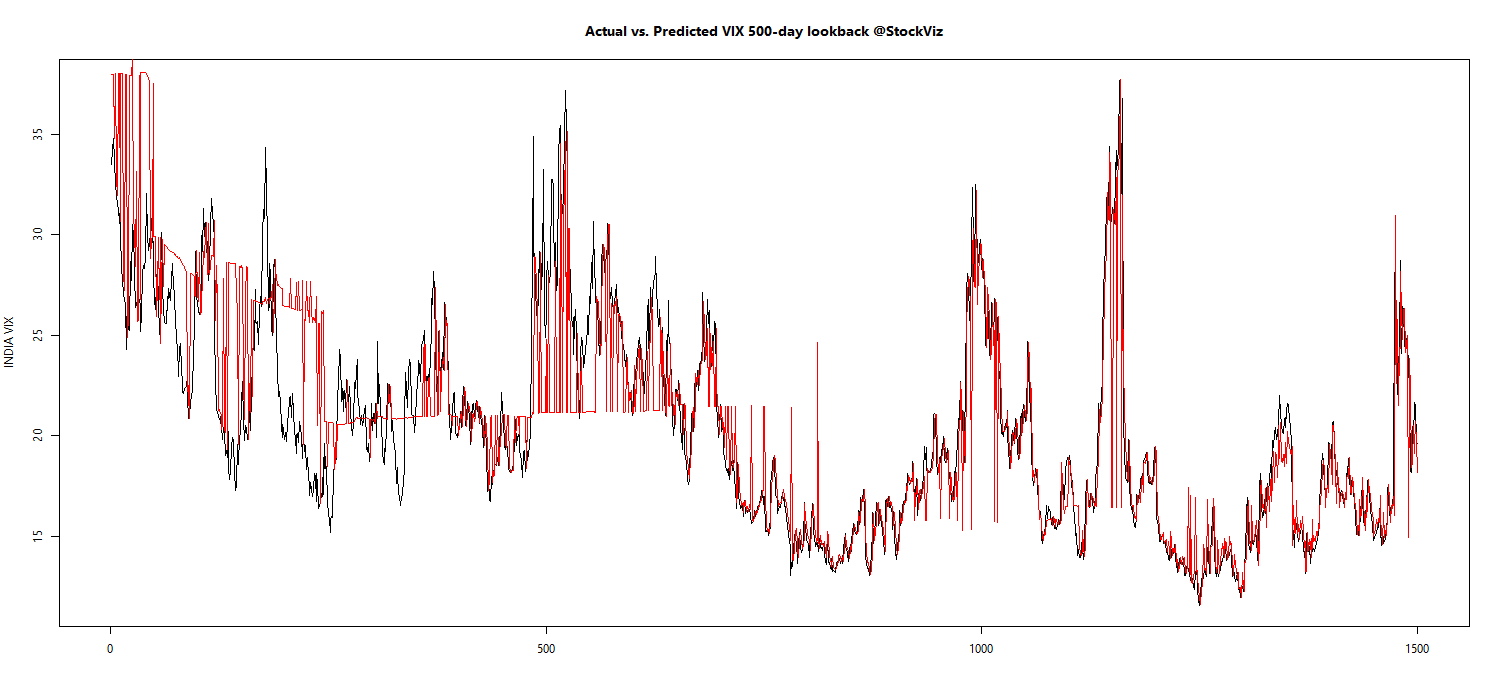
Note how in some periods, the predicted value (red) is just the previous value.
Prediction error
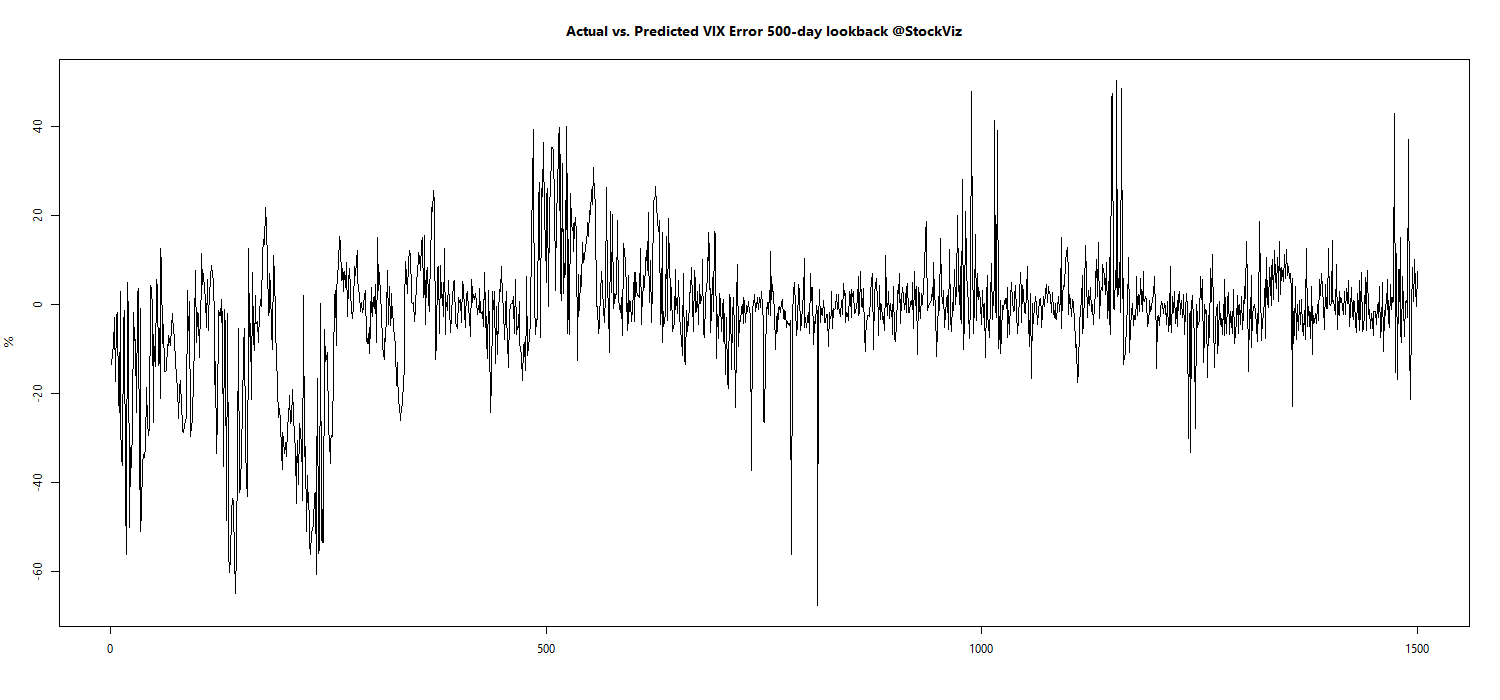
Values less than zero implies that the model prediction overshoots the actual VIX level the next day.
Prediction vs. Actual Density Plot
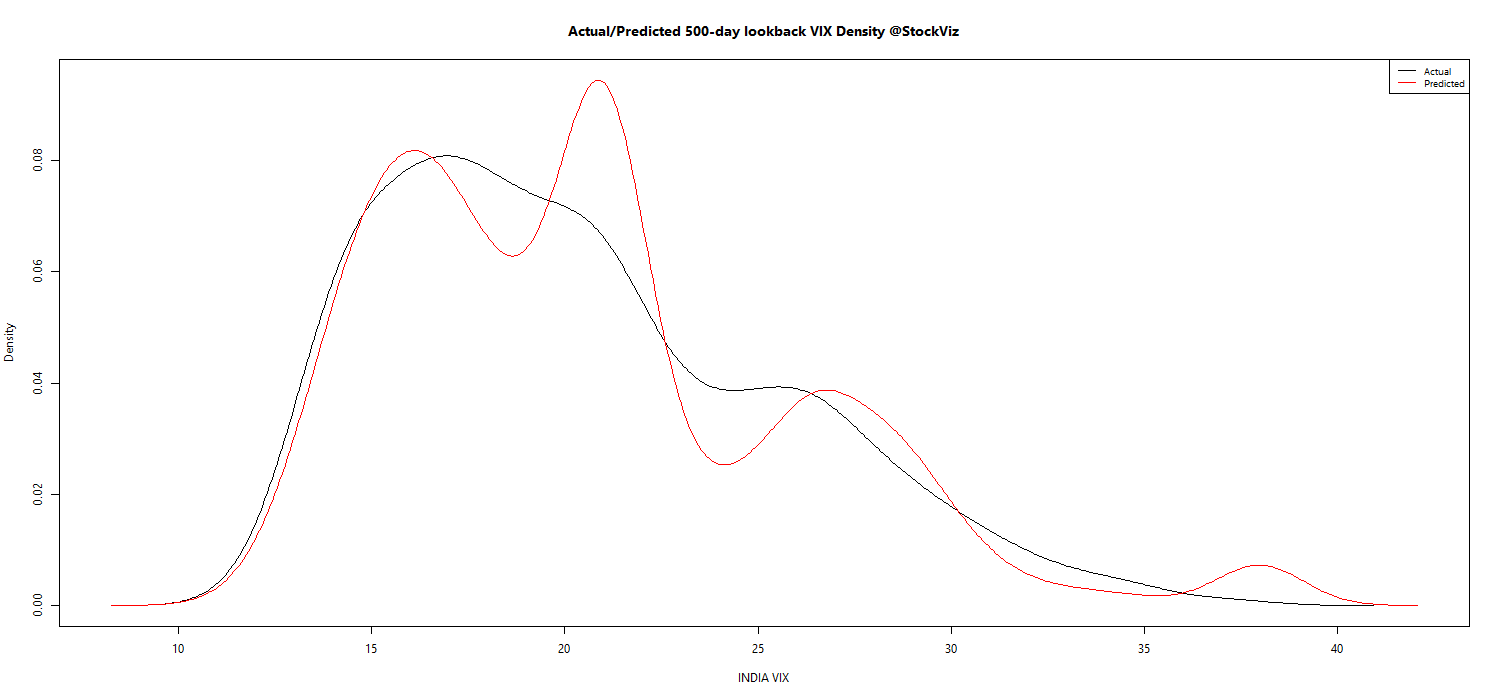
The model bias towards higher estimation of VIX is made explicit here.
Next steps
We will integrate this model to our morning ‘Options Daily’ posts so that we get an idea of both the current state of VIX and the expected modeled behavior.
Caveats:
- The 500-day lookback is purely empirical. Maybe some other look-back period that we have not tested would have been ideal to model. We will never know.
- Only the known history can be modeled. The outputs should be used along with market determined proxies of expected volatility.
- There is always a probability distribution around a predicted value. We will publish this in our daily posts.
Appendix
VIX Model vs. Actual across various lookback periods. (pdf)
Volatility Forecasting I: GARCH Models, Rob Reider (pdf)