Executive Summary
Dynamic P/E funds use the market Price-to-Equity ratio to decide on allocation. If the P/E ratio is deemed too high, they allocate more to bonds or arbitrage strategies and if the P/E ratio is low, they allocate more towards equities. This logic sounds good on paper. However,
- The market always appears expensive around turnarounds – investors miss out on the recovery trade.
- The market always appears cheap during downturns – investors end up being long equities when bonds tend to outperform.
- It doesn’t protect against volatility as a pure-play bond fund would (bad fit if you are risk-averse.)
- It doesn’t give you the returns of a pure-play equity fund (bad fit if you are risk-seeking.)
- Since it dampens volatility, it doesn’t make sense to dollar-cost-average (bad fit if your looking for an SIP.)
It is a solution looking for a problem.
Analysis
We thank Franklin Templeton for running the Dynamic PE Ratio Fund Of Funds to perform our analysis. This is probably the only fund where a true apples-to-apples comparison can be made between a pure-play equity fund, a pure-play bond fund and a dynamic PE fund.
The Dynamic PE fund invests x% in the Franklin India Short Term Income Plan and 100-x% in the Franklin India Bluechip Fund based on the P/E ratio. All we have to do is look at how a buy-and-hold strategy of the components compare to the Dynamic PE fund to gauge the effectiveness of the strategy.
Dynamic PE vs. pure-play Equity
Between 2007-01-02 and 2015-09-23, Franklin India Dynamic PE Ratio Fund of Funds-Growth’s IRR was 10.93% vs. Franklin India Bluechip Fund-Growth’s IRR of 11.53%![]()

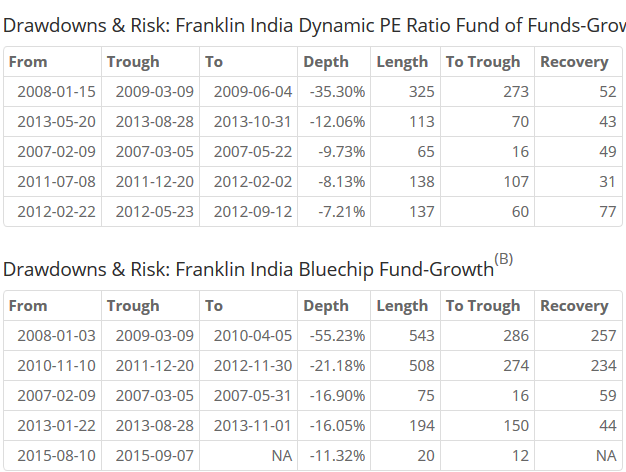
Similar returns. Lesser drawdowns. Lump-sum investors will probably be fine with these returns.
Dynamic PE vs. pure-play Bonds
First, let’s compare the Dynamic PE fund to the Short Term Income Plan.
Between 2007-01-02 and 2015-09-23, Dynamic PE Ratio had an IRR of 10.93% vs. Short-Term Income Plan’s IRR of 9.49%![]()
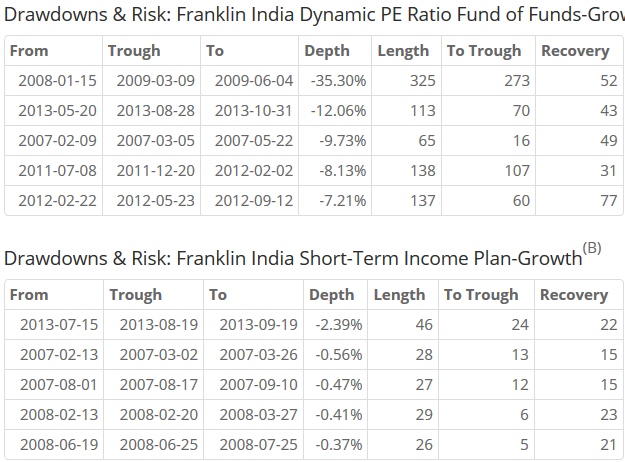
For investors worried about drawdowns, just investing in the liquid fund would have given similar returns with a lot less risk. A 35% drawdown is a lot for a fund that gives bond-like returns.
A bond fund like the Birla Sun Life Dynamic Bond Fund, for example, had an IRR of 9.65% over the same time period![]()
Conclusion
Using the P/E ratio for asset allocation is a bad idea. Investors would have experienced similar returns but with smaller drawdowns if they had invested in a regular bond fund instead.
Related: Dynamic PE Funds