In a wide ranging interview with Tyler Cowen, Cliff Asness discussed momentum and value investing strategies, disagreeing with Eugene Fama, the economics of Ayn Rand, bubble logic etc. The first half of the conversation was mostly about momentum investing and how it works.
Excepts on momentum:
Intro
A momentum investing strategy is the rather insane proposition that you can buy a portfolio of what’s been going up for the last 6 to 12 months, sell a portfolio of what’s been going down for the last 6 to 12 months, and you beat the market. Unfortunately for sanity, that seems to be true.
To some, it’s very intuitive. Just buy what’s going up.
Drawdowns
It has horrible streaks within that of not working. If your car worked like this, you’d fire your mechanic, if it worked like I use that word. I think it is harder than you might guess, even if something works long term, to have it go away because a lot of investors can’t live through the bad periods. They decide why it’s never going to work again at the wrong time.
Why it works
Underreation: News comes out. Price moves but not all the way. People update their priors but not fully efficiently. Therefore, just observing the price move is not going to move the same amount again but there’s some statistical tendency to continue.
Overreaction: People in fact do chase prices.
How to make it work
If you’re going to be momentum, you’ve got to really do it. You’ve got to be disciplined. You’ve got to come in every day, and you’ve got to count on these under- and overreaction things.
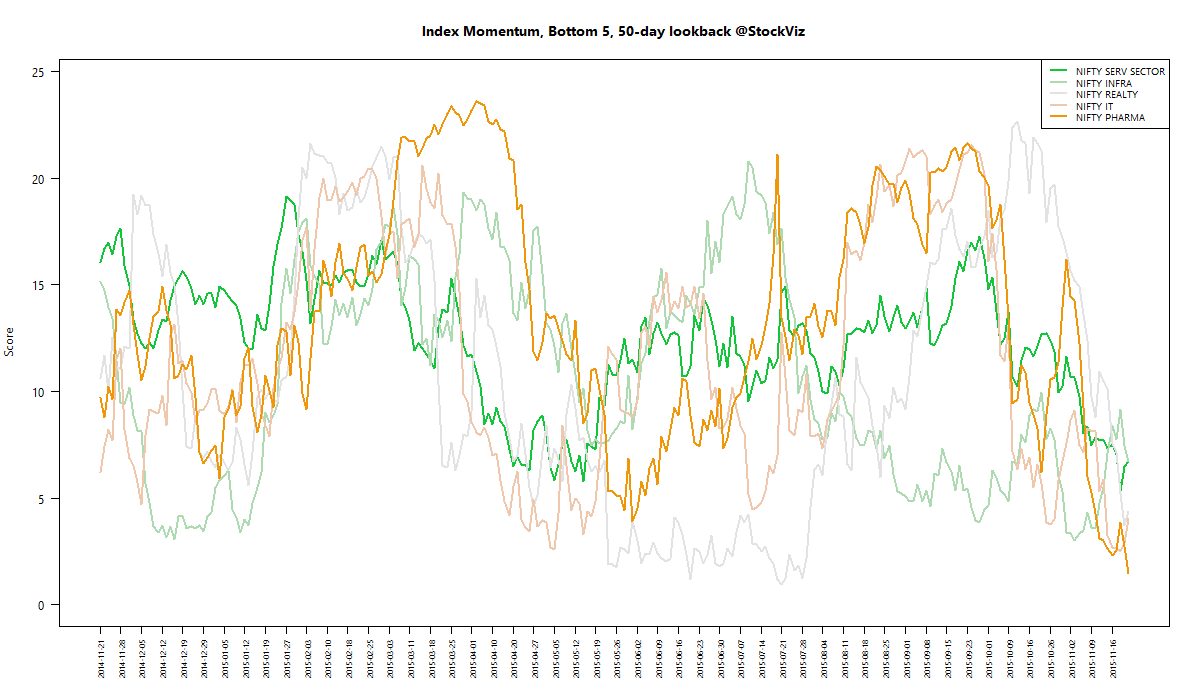
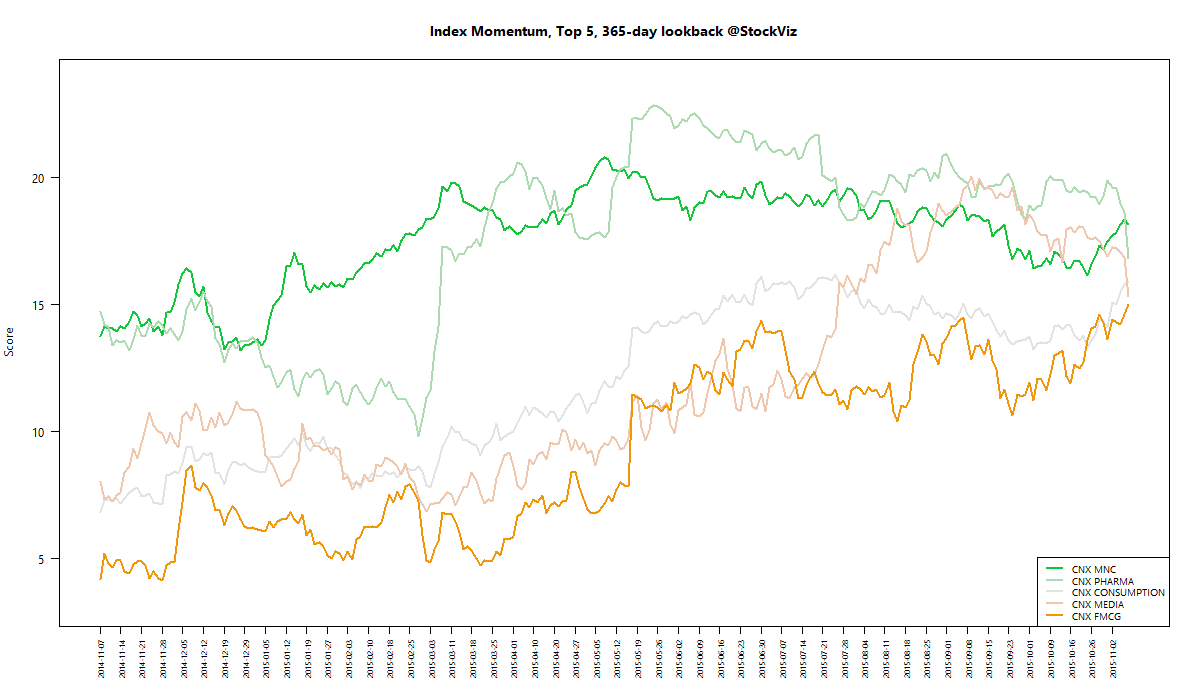
Momentum strategies on StockViz
We have been offering the Momentum Theme for more than two years now. It implements a relative momentum strategy where you compare the strengths of a universe of stocks to each other. 2014 returns were +90% and +36% so far this year (Compare.)
This year, we have introduced Velocity – an absolute momentum strategy – and Acceleration – a strategy that tracks changes in momentum.
If you are interested in momentum investing, please get in touch with us!
Source: A Conversation with Cliff Asness
Related: Small Cap Momentum Style Fund