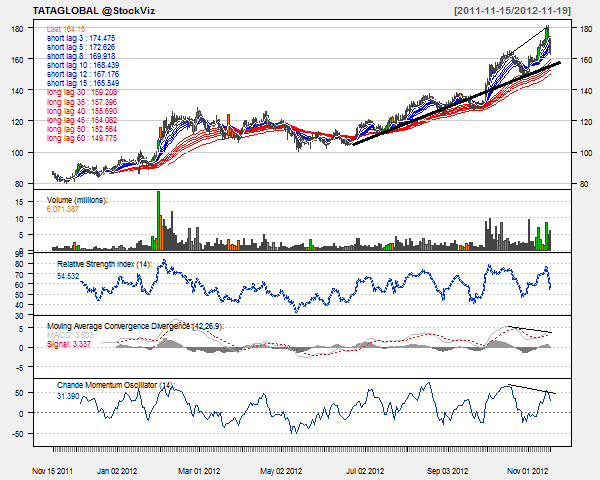
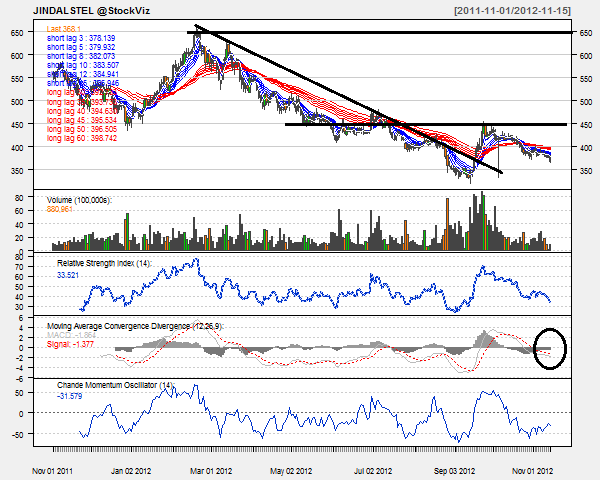
Today’s pick is [stockquote]SIEMENS[/stockquote]. The stock was in an up-trend in the starting of this year until mid-April, after which it started declining to find support at the long term 650 levels. However, since June it has been range-bound between the 650 and 750 levels. In the last three months, the stock moved 2% Vs 4% as that of Nifty’s.

Oscillators RSI and CMO are at currently at 38 and -16 are close to the over-sold territory but are not suggesting any direction.
MACD line and signal line are moving close to each other but are not indicating of any directional move.
The long-term GMMA chart is very tightly packed with short-term lines are starting to move up, directing a short-term upward movement.
The stock saw a bearish 9X18 crossover a week ago.

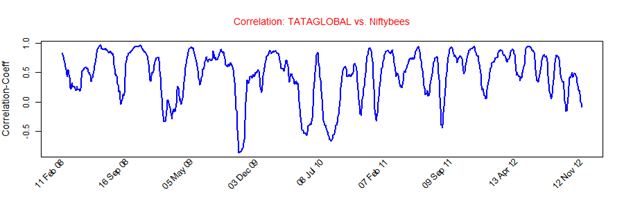
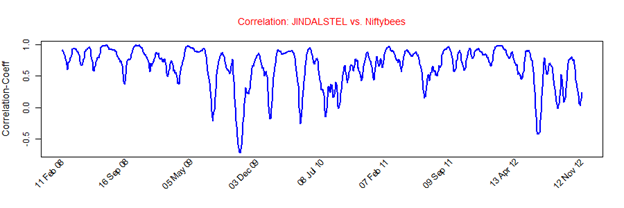
SIEMENS’s average correlation of 0.60 with the Nifty is positive. The stock will replicate the movements of Nifty. [stockquote]NIFTYBEES[/stockquote]

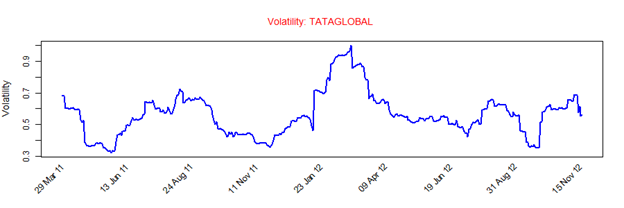
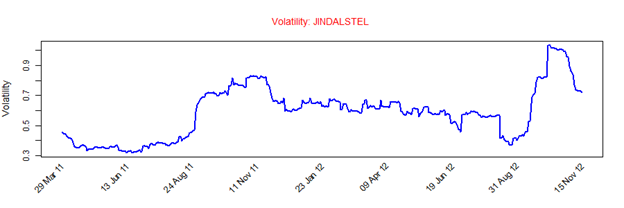
SIEMENS has a historical volatility in the range of 0.3 to 0.9. The scrip’s volatility is currently in the middle of the range and hence is not a concern.
Looking at these technicals a short-term buy is suggested if a pullback from the 650 levels is seen on higher volumes. A longer-term call could be made after a decisive break-out of the range in either direction.