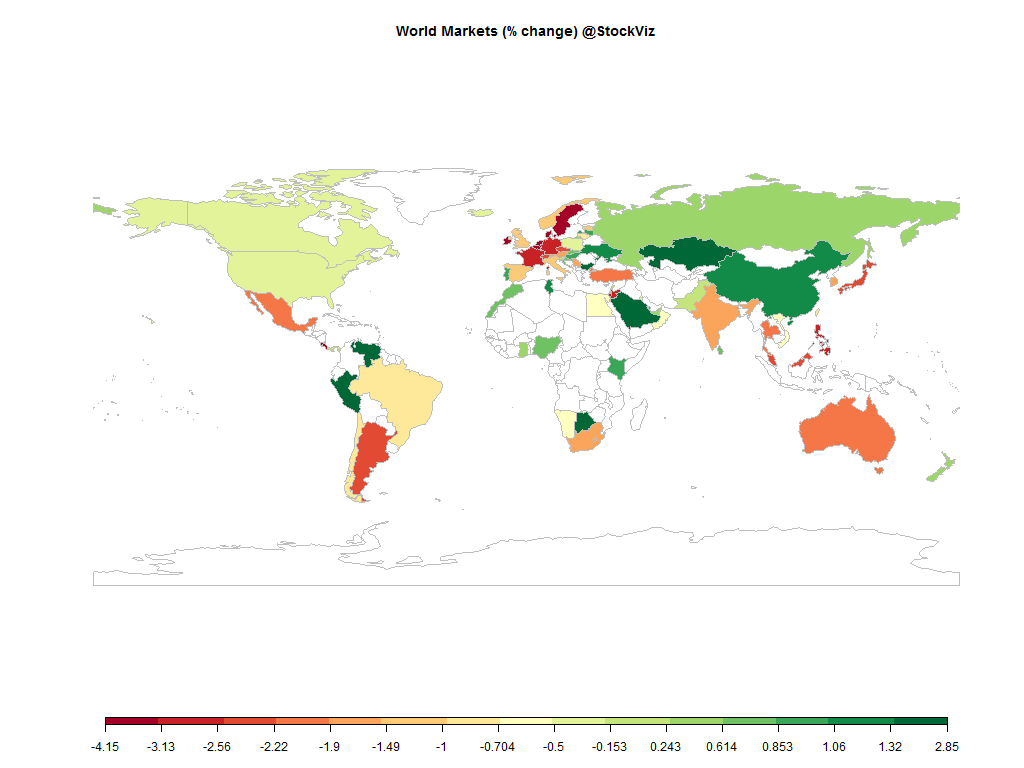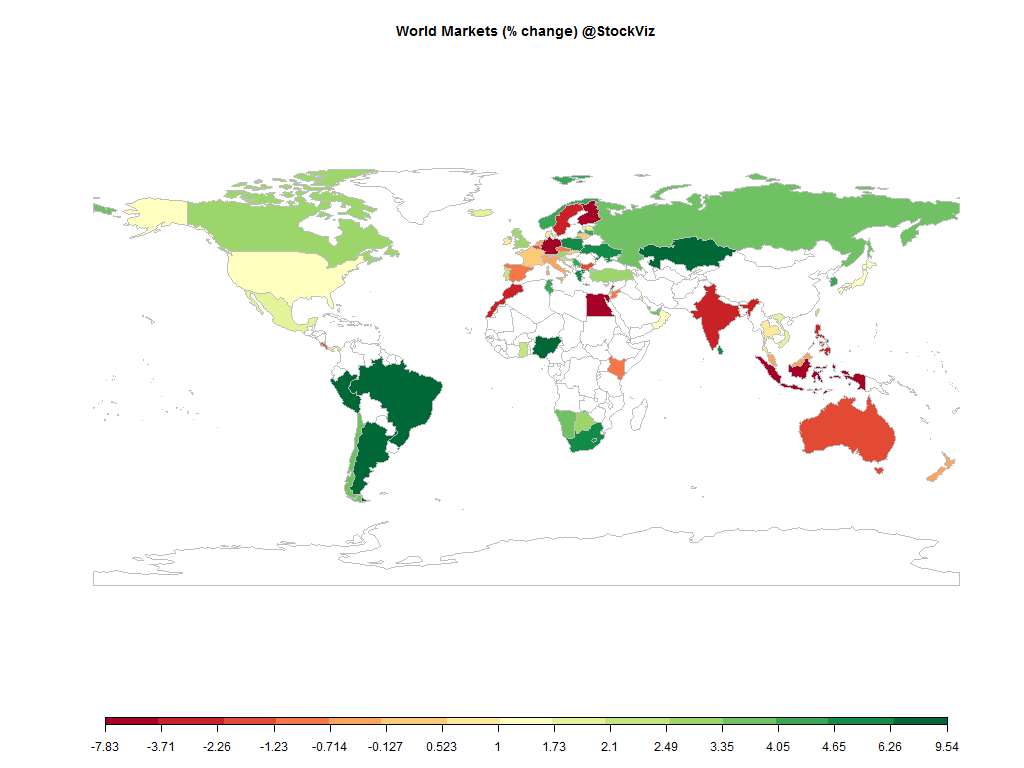
Equities
| MINTs | |
|---|---|
| JCI(IDN) | -7.83% |
| INMEX(MEX) | +1.82% |
| NGSEINDX(NGA) | +9.31% |
| XU030(TUR) | +3.34% |
| BRICS | |
|---|---|
| IBOV(BRA) | +9.54% |
| SHCOMP(CHN) | +18.51% |
| NIFTY(IND) | -3.65% |
| INDEXCF(RUS) | +3.82% |
| TOP40(ZAF) | +4.73% |
Commodities
| Energy | |
|---|---|
| WTI Crude Oil | +23.33% |
| Ethanol | +7.84% |
| Heating Oil | +15.86% |
| RBOB Gasoline | +14.75% |
| Brent Crude Oil | +19.90% |
| Natural Gas | +4.57% |
| Metals | |
|---|---|
| Copper | +6.91% |
| Palladium | +5.40% |
| Gold 100oz | -0.37% |
| Silver 5000oz | -3.01% |
| Platinum | -0.82% |
Currencies
| MINTs | |
|---|---|
| USDIDR(IDN) | -0.96% |
| USDMXN(MEX) | +1.88% |
| USDNGN(NGA) | -0.62% |
| USDTRY(TUR) | +4.23% |
| BRICS | |
|---|---|
| USDBRL(BRA) | -6.36% |
| USDCNY(CHN) | +0.06% |
| USDINR(IND) | +1.48% |
| USDRUB(RUS) | -10.79% |
| USDZAR(ZAF) | -0.61% |
| Agricultural | |
|---|---|
| Cocoa | +4.00% |
| Coffee (Arabica) | -0.94% |
| Coffee (Robusta) | +1.94% |
| Cotton | +4.63% |
| Soybean Meal | -3.44% |
| Corn | -4.25% |
| Lean Hogs | +22.47% |
| Lumber | -8.52% |
| Orange Juice | -8.61% |
| Soybeans | -0.44% |
| Sugar #11 | +7.58% |
| Feeder Cattle | -2.02% |
| Wheat | -8.19% |
| Cattle | -7.48% |
| White Sugar | +4.89% |
Credit Indices
| Index | Change |
|---|---|
| Markit CDX EM | +3.58% |
| Markit CDX NA HY | -0.55% |
| Markit CDX NA IG | -2.44% |
| Markit iTraxx Asia ex-Japan IG | +7.09% |
| Markit iTraxx Australia | +6.74% |
| Markit iTraxx Europe | +9.57% |
| Markit iTraxx Europe Crossover | +1.39% |
| Markit iTraxx Japan | -3.23% |
| Markit iTraxx SovX Western Europe | +2.17% |
| Markit LCDX (Loan CDS) | -0.11% |
| Markit MCDX (Municipal CDS) | +1.70% |
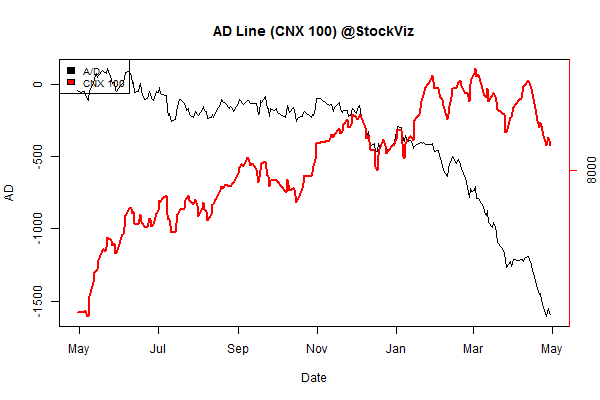
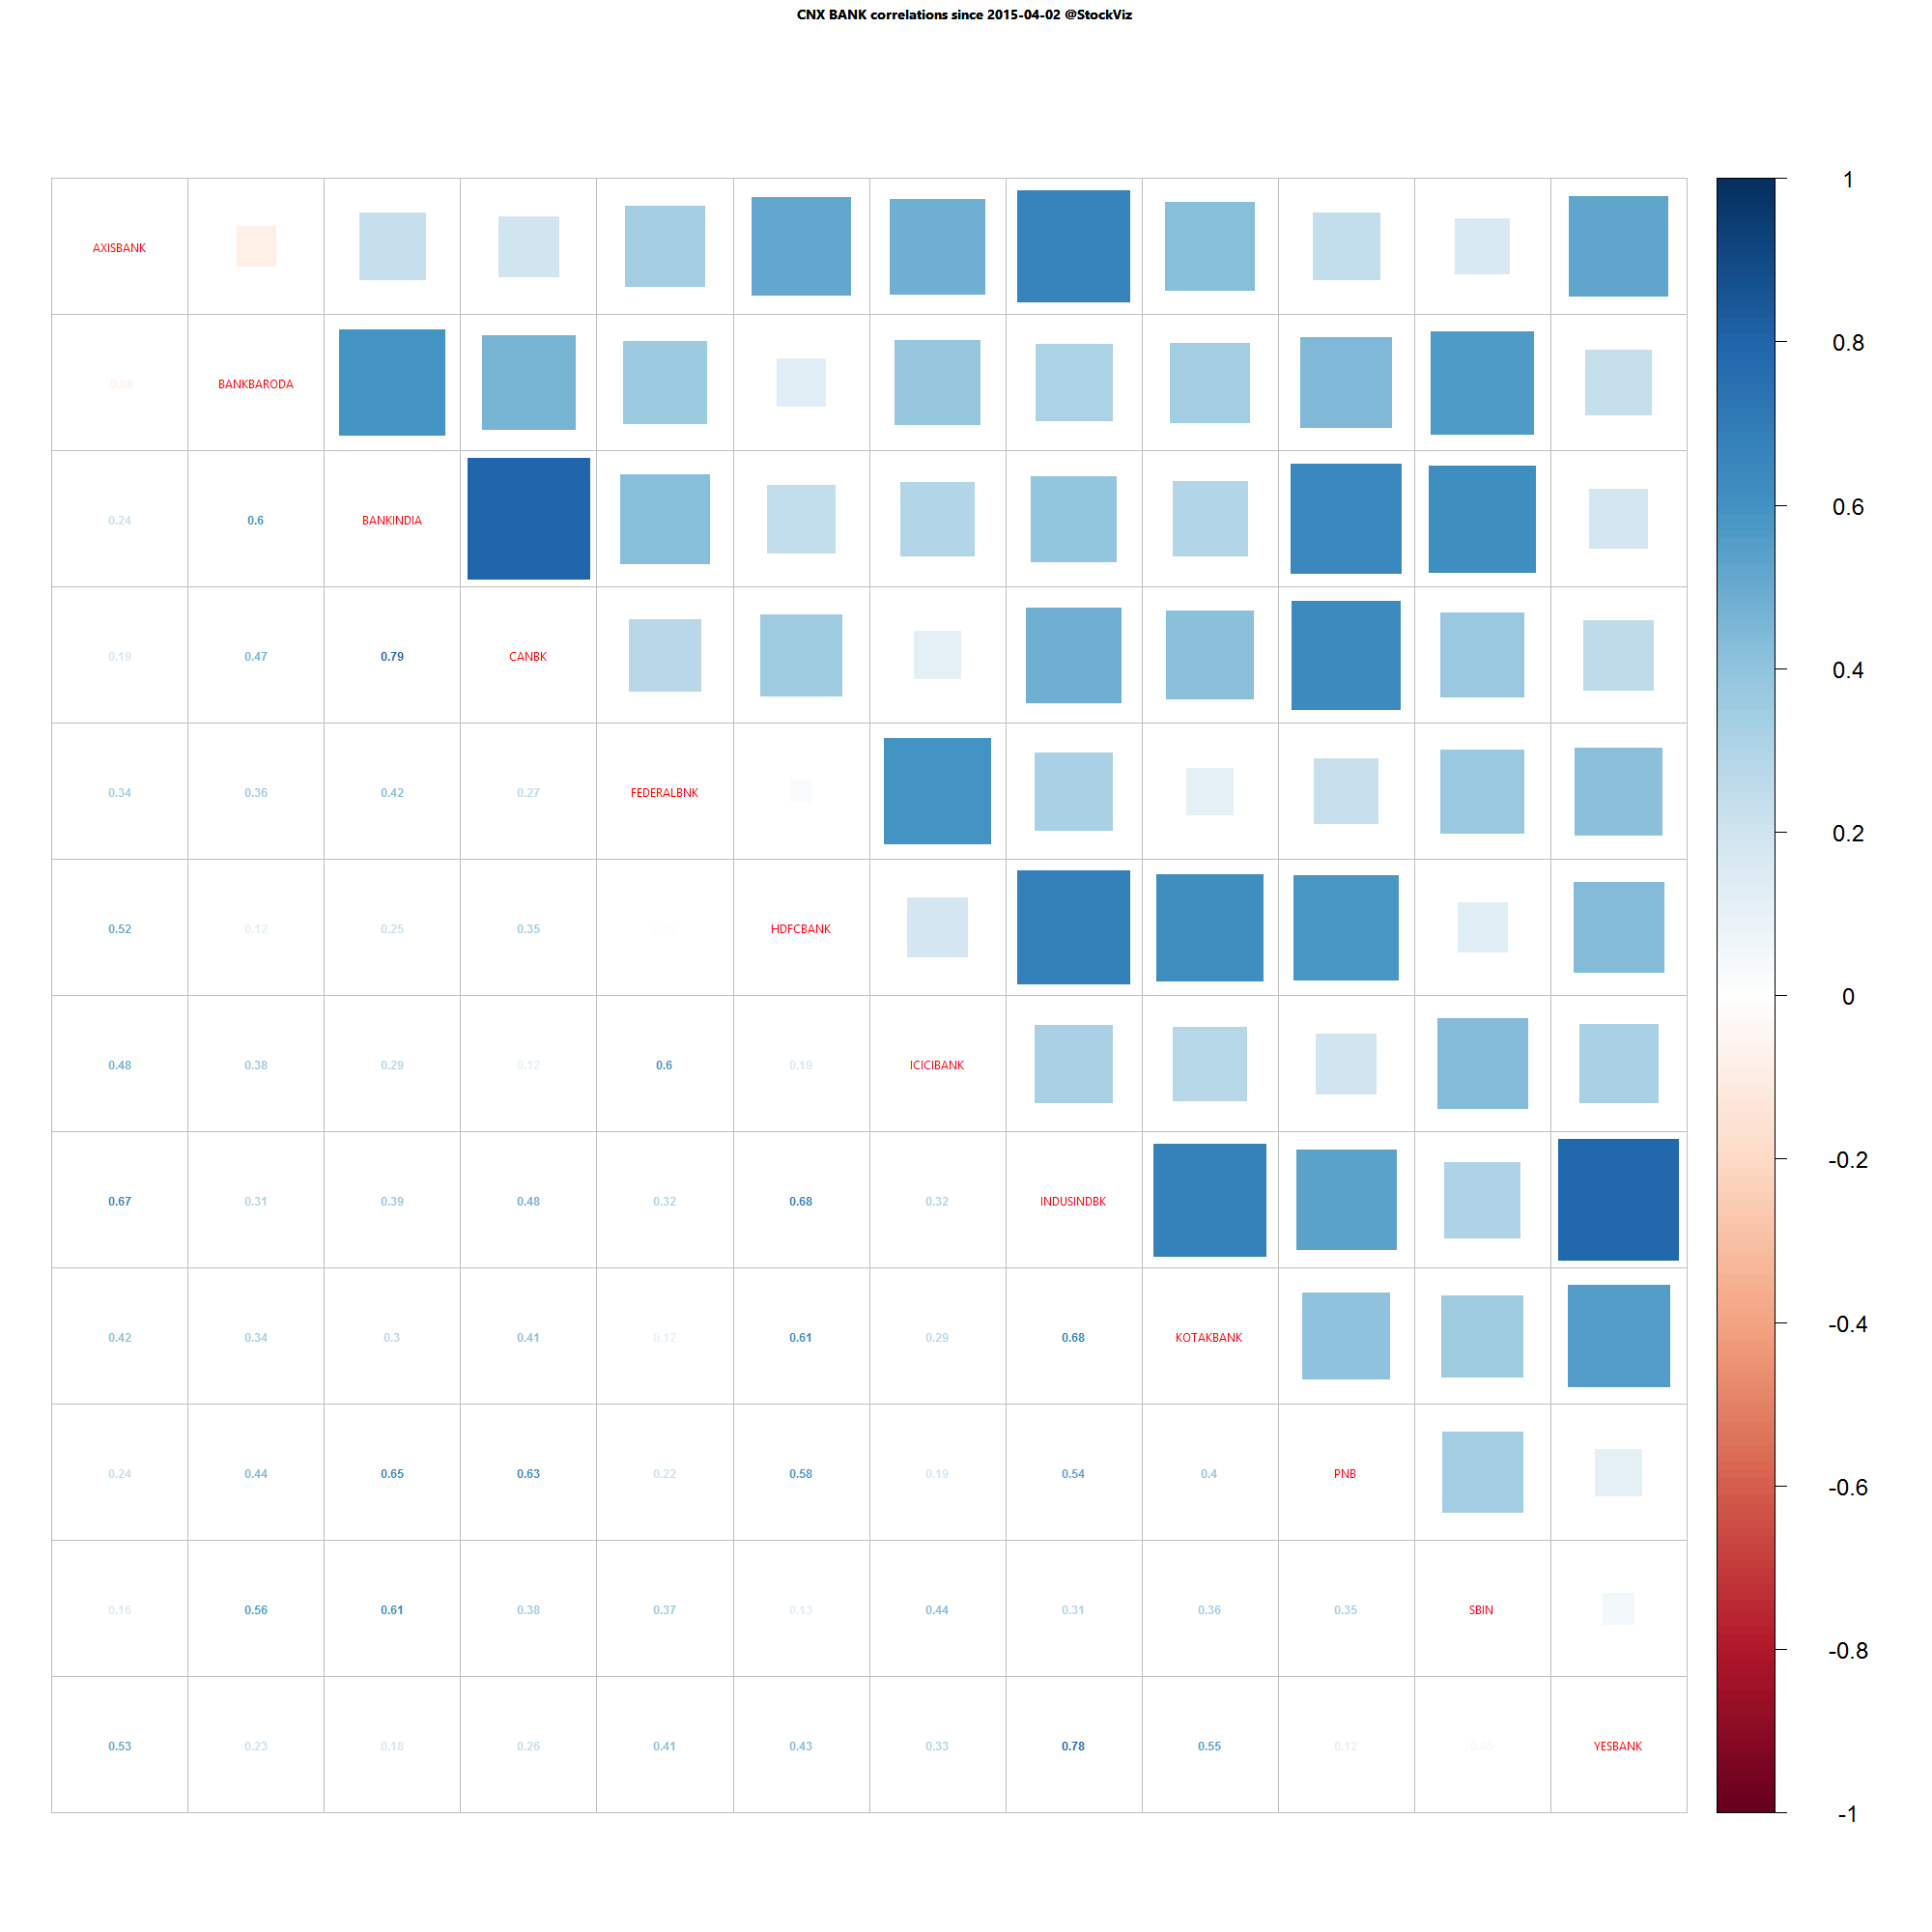
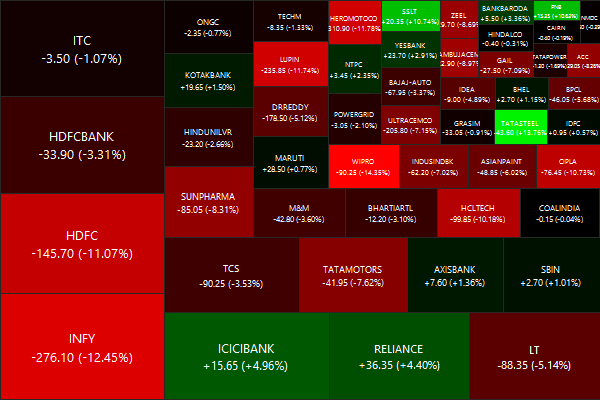
Both the NIFTY and the rupee put in performances that they sooner forget. Stretched evaluations met a tepid earnings season and retroactive tax demands on FIIs. May will see more firms coming out earnings and we expect the markets to remain choppy.
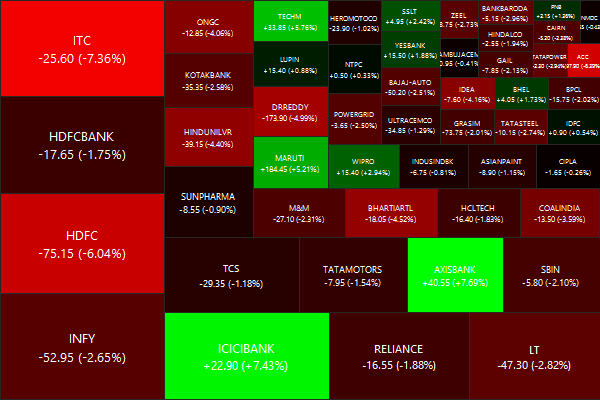
Nifty Heatmap
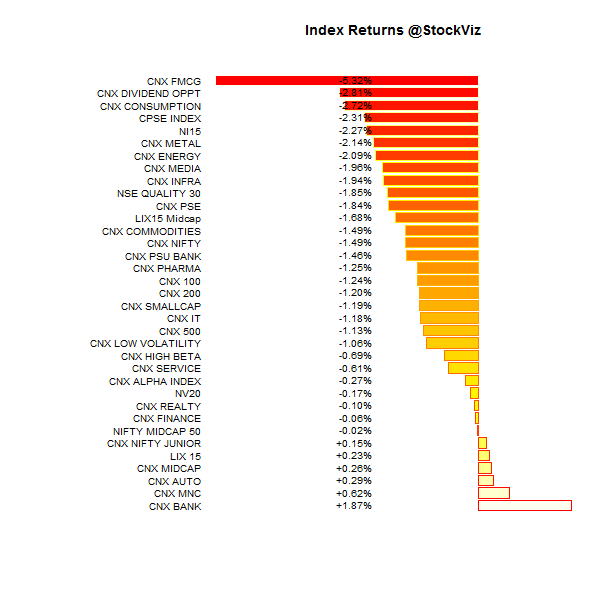
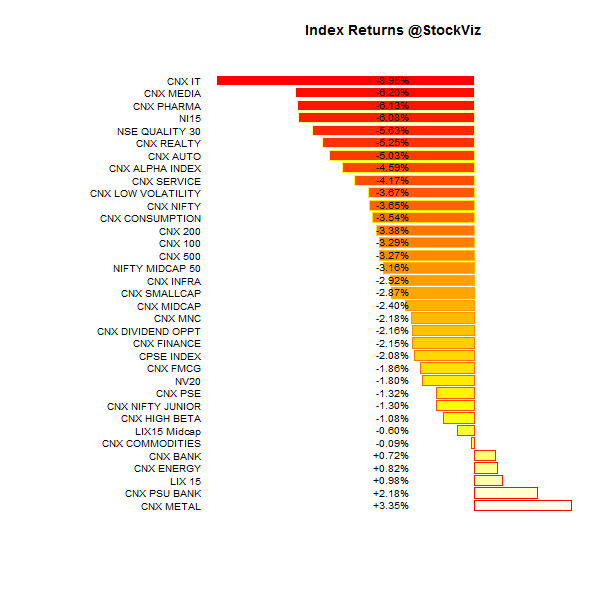
Index Returns
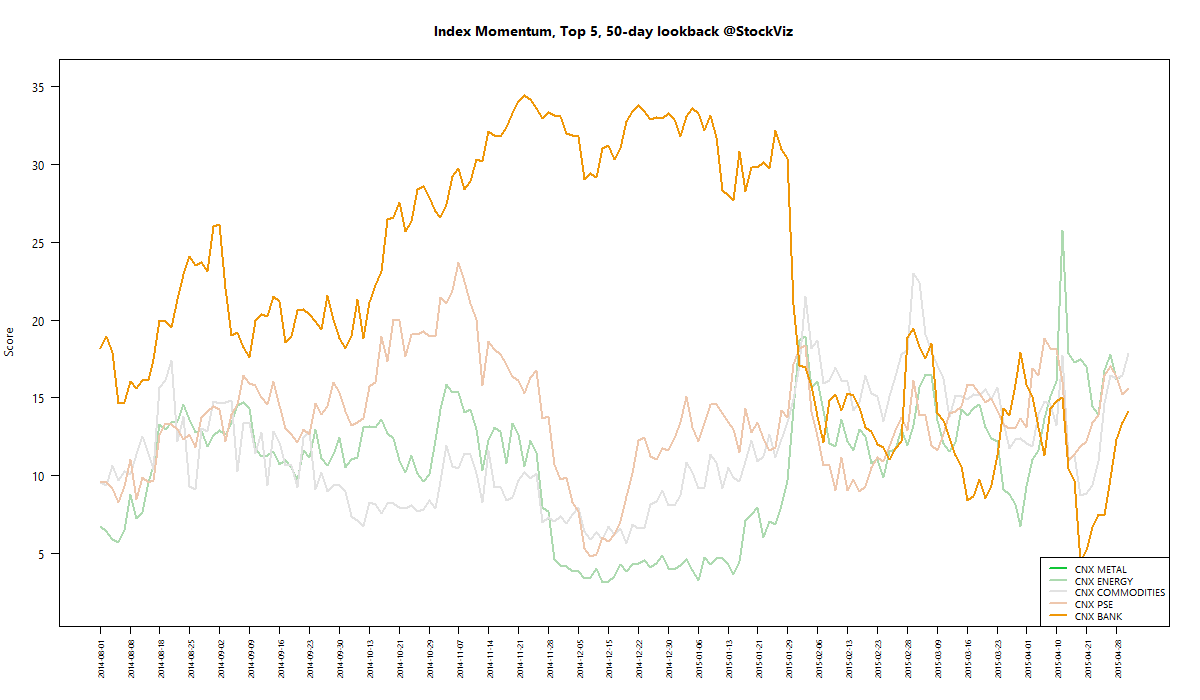
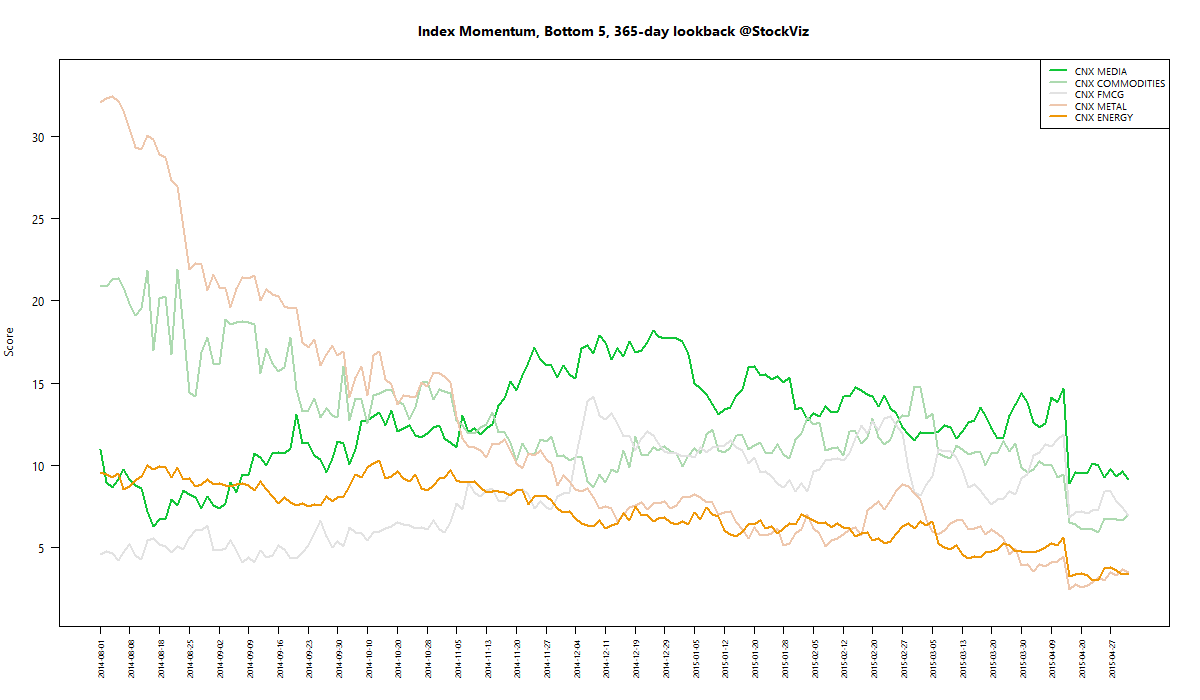
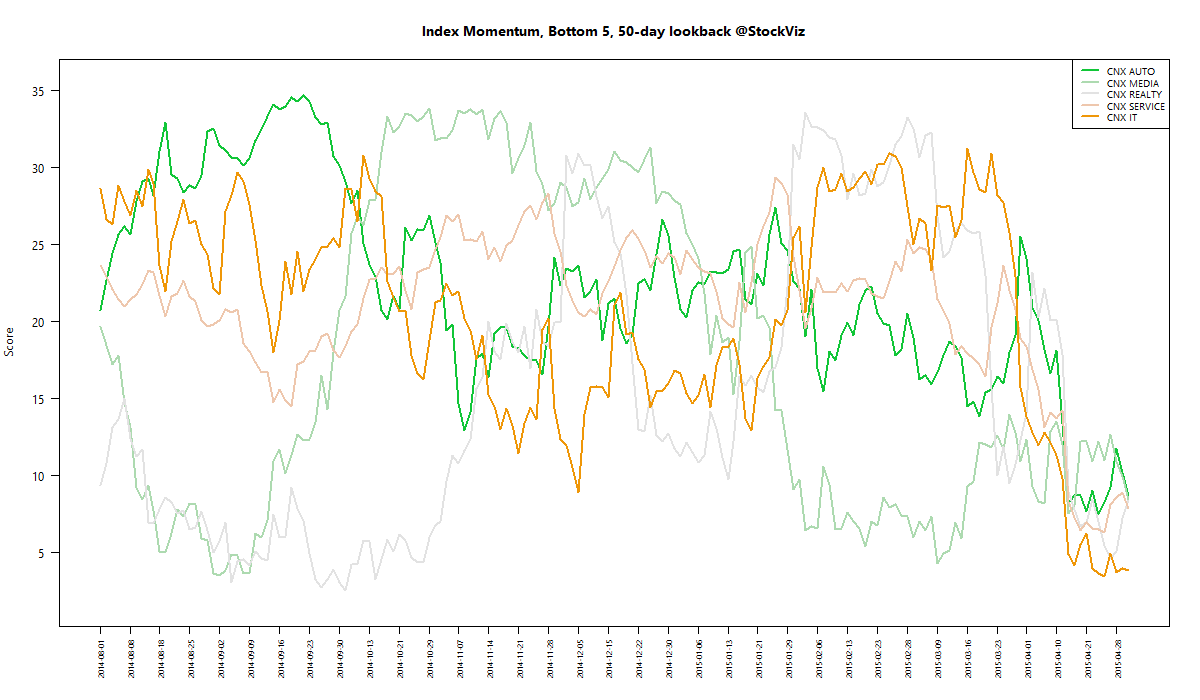
For a deeper dive into indices, check out our weekly Index Update.
Market Cap Decile Performance
| Decile | Mkt. Cap. | Adv/Decl |
|---|---|---|
| 1 (micro) | +3.97% | 82/50 |
| 2 | +10.85% | 82/49 |
| 3 | +7.66% | 78/53 |
| 4 | +6.24% | 68/64 |
| 5 | +4.32% | 72/59 |
| 6 | +2.89% | 68/63 |
| 7 | +2.84% | 71/61 |
| 8 | -2.06% | 66/65 |
| 9 | -3.55% | 64/67 |
| 10 (mega) | -2.64% | 58/74 |
This doesn’t make any sense…
Top Winners and Losers
| UPL | +10.97% |
| GLENMARK | +13.25% |
| TATASTEEL | +13.76% |
| APOLLOHOSP | -16.95% |
| WIPRO | -14.35% |
| SRTRANSFIN | -12.97% |
A smorgasbord of performance…
ETF Performance
| GOLDBEES | +3.56% |
| PSUBNKBEES | +2.07% |
| BANKBEES | +1.54% |
| JUNIORBEES | -0.62% |
| CPSEETF | -2.15% |
| NIFTYBEES | -3.29% |
| INFRABEES | -5.49% |
Infrastructure got whipped…
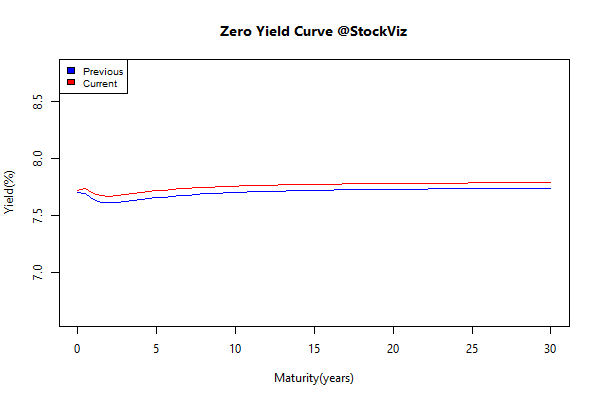
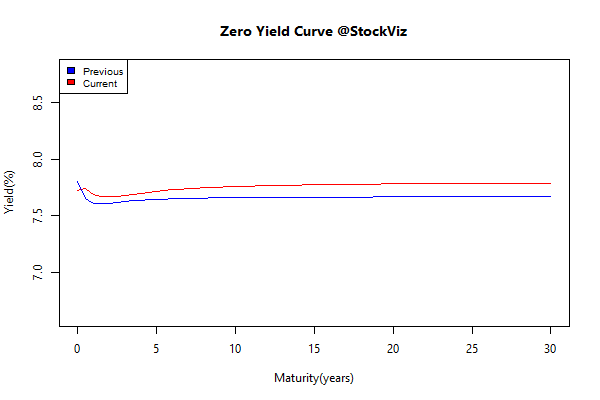
Yield Curve
Bond Indices
| Sub Index | Change in YTM | Total Return(%) |
|---|---|---|
| GSEC TB | -0.09 | +0.66% |
| GSEC SUB 1-3 | -0.60 | +0.25% |
| GSEC SUB 3-8 | +0.04 | +0.20% |
| GSEC SUB 8 | +0.16 | -0.07% |
Listless…
Investment Theme Performance
| Textile, Metals, Chemicals, Paper and Energy Quality to Price | +4.76% |
| Financial Strength Value | +3.32% |
| Tactical CNX 100 | +2.51% |
| Momentum | -0.11% |
| Auto and Consumer Goods Quality to Price | -0.32% |
| Balance Sheet Strength | -0.61% |
| Quality to Price | -2.49% |
| ADAG stocks | -2.65% |
| Media, Health, IT, Telecom, Services, Pharma Quality To Price | -3.16% |
| High Beta | -3.29% |
| CNX 100 Enterprise Yield | -4.41% |
| ASK Life | -5.50% |
| Low Volatility | -6.67% |
| PPFAS Long Term Value | -7.89% |
| Magic Formula | -8.44% |
| Next Trillion | -10.54% |
Drawdowns galore across investment strategies…
Equity Mutual Funds
Bond Mutual Funds
Thought to sum up the month
Good investing hurts. Investors pay a high price for comfort and get paid a high price for doing what few others will. That will always be the case.
Source: This Was Never Easy