Returns vs. Volatility
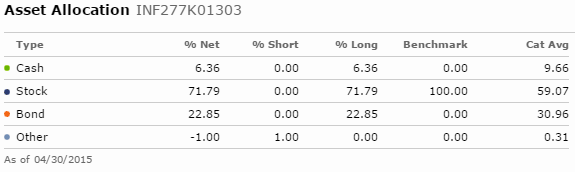
Balanced funds are those that invest in both stocks and bonds. The exact allocation is up to the fund manager. For example, the Tata Balanced fund is right now 22.85% in bonds and the rest in equities, according to Morningstar.
Balanced funds are pitched as having lesser risk than equity-only funds. But what investors gain in lesser volatility, they give up on lower returns and higher fees.
Tata Balanced vs. ICICI Pru. Value Discovery
Between 2007-01-02 and 2015-06-02, Tata Balanced Fund has returned a cumulative 235.97% with an IRR of 15.48% vs. ICICI Prudential Value Discovery Fund’s cumulative return of 316.55% and an IRR of 18.47%![]()
Compare the drawdowns:
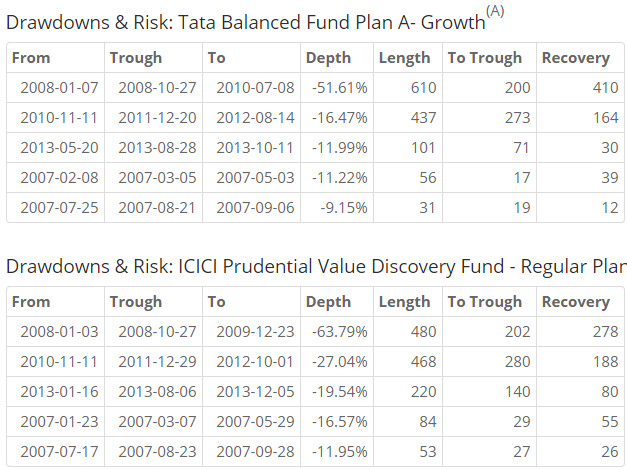
For the moderate-risk taking investor who is typically attracted to balanced funds, a 16% drawdown hurts just as much as a 27% drawdown.
When it comes to fees, Tata’s has an expense ratio of 2.91% vs. ICICI’s 2.34%. Is the extra 50bps worth the safety offered?
HDFC Balanced Fund vs. ICICI Pru. Value Discovery
It is a similar deal with HDFC’s Balanced fund as well: lower returns (IRR: 15.24%) and no escape from double-digit drawdowns![]()

Conclusion
The sales-pitch for balanced funds focus on the investors availability heuristic where people tend to heavily weigh their judgments toward more recent information, making new opinions biased toward that latest news. Ever since the market corrected in March a growing flock of blogs and articles started pitching balanced funds. But before you fall for the marketing pitch, take a step back and ensure that you are not giving too much away for perceived safety.