Introduction
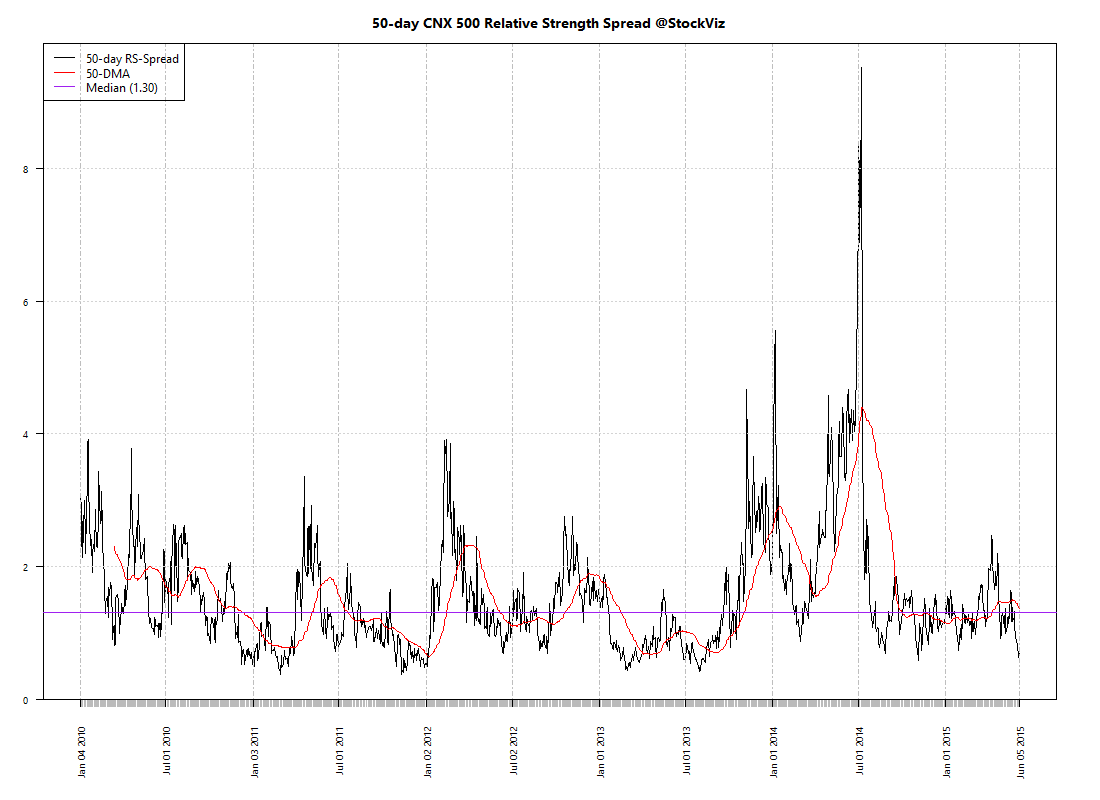
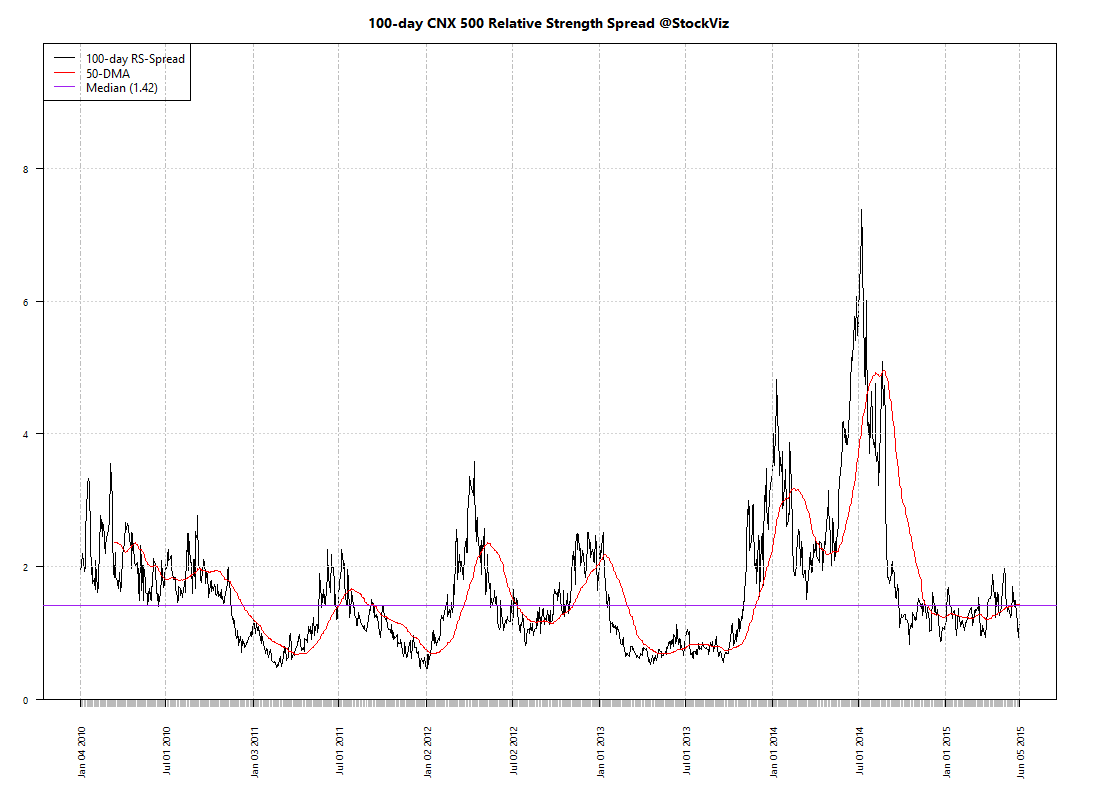
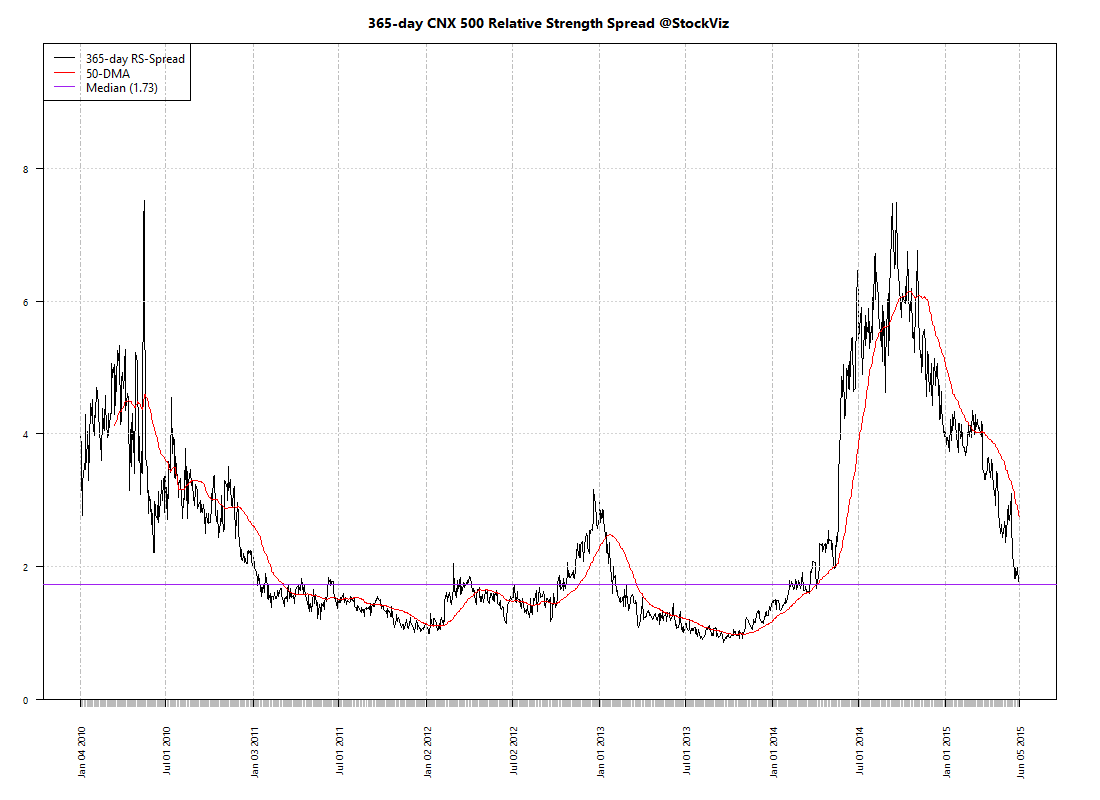
During our discussion on Relative Strength Spread, we saw how the relative performance between winners and losers were compressed in the bear markets of 2011, 2012 and 2013. During these doldrums, most active investment strategies fail to outperform their benchmarks. Since most mutual fund investments span multiple bull and bear markets, it makes sense to have a look at how funds performed in the most recent bear market.
For our analysis, we took funds that had more than 90% allocated in equities and ignored sector and international funds. We then applied the same benchmark, the CNX Midcap Index, to make sure that we had an apples-to-apples comparison. A total of 200 funds were analyzed.
The 10 worst funds
Information Ratio
| Fund | IR | IRR |
|---|---|---|
|
-0.99
|
-0.29
|
|
|
-0.48
|
-0.21
|
|
|
-0.44
|
-0.21
|
|
|
-0.43
|
-0.17
|
|
|
-0.28
|
-0.16
|
|
|
-0.11
|
-0.12
|
|
|
-0.00
|
-0.10
|
|
|
0.01
|
-0.09
|
|
|
0.02
|
-0.09
|
|
|
0.07
|
-0.08
|
Sharpe Ratio
| Fund | SHARPE | IRR |
|---|---|---|
|
-0.02
|
-0.29
|
|
|
-0.01
|
-0.21
|
|
|
-0.01
|
-0.21
|
|
|
-0.01
|
-0.17
|
|
|
-0.01
|
-0.16
|
|
|
-0.01
|
-0.12
|
|
|
-0.00
|
-0.09
|
|
|
-0.00
|
-0.08
|
|
|
-0.00
|
-0.09
|
|
|
-0.00
|
-0.10
|
Beta
| Fund | BETA | IRR |
|---|---|---|
|
1.19
|
-0.29
|
|
|
1.15
|
-0.21
|
|
|
1.07
|
-0.21
|
|
|
0.98
|
-0.17
|
|
|
1.02
|
-0.16
|
|
|
0.84
|
-0.12
|
|
|
0.92
|
-0.10
|
|
|
0.91
|
-0.09
|
|
|
0.92
|
-0.09
|
|
|
0.90
|
-0.08
|
Bear Beta
| Fund | BETA BEAR | IRR |
|---|---|---|
|
1.18
|
-0.29
|
|
|
1.13
|
-0.21
|
|
|
1.09
|
-0.21
|
|
|
0.98
|
-0.16
|
|
|
0.95
|
-0.17
|
|
|
0.95
|
-0.09
|
|
|
0.93
|
0.07
|
|
|
0.91
|
0.09
|
|
|
0.91
|
0.04
|
|
|
0.91
|
0.04
|
Draw down depth
| Fund | DRAW DEPTH | IRR |
|---|---|---|
|
-48.31
|
-0.29
|
|
|
-45.71
|
-0.21
|
|
|
-41.83
|
-0.21
|
|
|
-37.54
|
-0.16
|
|
|
-36.49
|
0.06
|
|
|
-35.52
|
-0.17
|
|
|
-34.50
|
-0.09
|
|
|
-33.43
|
0.01
|
|
|
-33.33
|
-0.05
|
|
|
-32.50
|
-0.12
|
Draw down length
| Fund | DRAW LENGTH | IRR |
|---|---|---|
|
715.00
|
-0.09
|
|
|
715.00
|
-0.00
|
|
|
715.00
|
-0.06
|
|
|
715.00
|
-0.17
|
|
|
715.00
|
-0.04
|
|
|
715.00
|
-0.03
|
|
|
715.00
|
-0.02
|
|
|
715.00
|
-0.02
|
|
|
715.00
|
-0.12
|
|
|
715.00
|
-0.08
|
The 10 best funds
Information Ratio
| Fund | IR | IRR |
|---|---|---|
|
2.23
|
0.33
|
|
|
1.69
|
0.25
|
|
|
1.66
|
0.30
|
|
|
1.65
|
0.31
|
|
|
1.64
|
0.29
|
|
|
1.61
|
0.32
|
|
|
1.44
|
0.20
|
|
|
1.43
|
0.20
|
|
|
1.41
|
0.24
|
|
|
1.35
|
0.19
|
Sharpe Ratio
| Fund | SHARPE | IRR |
|---|---|---|
|
0.04
|
0.36
|
|
|
0.03
|
0.33
|
|
|
0.03
|
0.32
|
|
|
0.03
|
0.31
|
|
|
0.03
|
0.29
|
|
|
0.03
|
0.30
|
|
|
0.03
|
0.30
|
|
|
0.03
|
0.30
|
|
|
0.03
|
0.27
|
|
|
0.03
|
0.18
|
Beta
| Fund | BETA | IRR |
|---|---|---|
|
0.50
|
0.36
|
|
|
0.76
|
0.33
|
|
|
0.73
|
0.32
|
|
|
0.69
|
0.31
|
|
|
0.76
|
0.30
|
|
|
0.70
|
0.29
|
|
|
0.73
|
0.25
|
|
|
0.71
|
0.24
|
|
|
0.69
|
0.24
|
|
|
0.68
|
0.22
|
Bear Beta
| Fund | BETA BEAR | IRR |
|---|---|---|
|
0.43
|
0.18
|
|
|
0.55
|
0.21
|
|
|
0.55
|
0.07
|
|
|
0.56
|
0.36
|
|
|
0.64
|
0.12
|
|
|
0.65
|
0.17
|
|
|
0.66
|
0.16
|
|
|
0.67
|
0.09
|
|
|
0.68
|
0.19
|
|
|
0.68
|
0.14
|
Draw down depth
| Fund | DRAW DEPTH | IRR |
|---|---|---|
|
-12.06
|
0.18
|
|
|
-14.30
|
0.17
|
|
|
-14.33
|
0.18
|
|
|
-16.95
|
0.32
|
|
|
-17.01
|
0.22
|
|
|
-17.30
|
0.20
|
|
|
-17.44
|
0.15
|
|
|
-17.45
|
0.16
|
|
|
-17.66
|
0.17
|
|
|
-17.96
|
0.14
|
Draw down length
| Fund | DRAW LENGTH | IRR |
|---|---|---|
|
113.00
|
0.18
|
|
|
145.00
|
0.17
|
|
|
147.00
|
0.36
|
|
|
172.00
|
0.33
|
|
|
229.00
|
-0.01
|
|
|
232.00
|
0.24
|
|
|
235.00
|
0.32
|
|
|
238.00
|
0.03
|
|
|
258.00
|
0.30
|
|
|
266.00
|
0.20
|
Conclusion
The Birla MNC fund stands out as one having the most points in its favour: low and shallow drawdown, better sharpe and higher returns. The next stand outs were the Axis Long-term equity fund and the Mirae Asset Emerging Bluechip Fund.
In terms of the worst funds, HSBC Progressive Themes was definitely regressive to your wealth. JM Basic and Sundram SMILE funds also laid a deuce.
Mutual funds are marketed as wealth builders. However, the truth is that most of them struggle. At last count, there were more than 5300 different schemes that you could choose from.
Are you getting the right advise? Get in touch with us if you are looking to invest! Call us or Whatsapp us at +918026650232