Index Update 27.06.2015

MOMENTUM

We run our proprietary momentum scoring algorithm on indices just like we do on stocks. You can use the momentum scores of sub-indices to get a sense for which sectors have the wind on their backs and those that are facing headwinds.

Traders can pick their longs in sectors with high short-term momentum and their shorts in sectors with low momentum. Investors can use the longer lookback scores to position themselves using our re-factored index Themes.

You can see how the momentum algorithm has performed on individual stocks here.

Here are the best and the worst sub-indices:

index momentum best 365 2015-06-26 png

index momentum best 50 2015-06-26 png

index momentum worst 365 2015-06-26 png

index momentum worst 50 2015-06-26 png

Relative Strength Spread

CNX_500 relative-spread-index 50 2015-06-26 png

Refactored Index Performance

50-day performance, from April 17, 2015 through June 26, 2015:

Trend Model Summary

Index Signal % From Peak Day of Peak
CNX AUTO LONG
7.17
2015-Jan-27
CNX BANK LONG
10.62
2015-Jan-27
CNX ENERGY LONG
25.82
2008-Jan-14
CNX FMCG LONG
11.66
2015-Feb-25
CNX INFRA LONG
47.92
2008-Jan-09
CNX IT LONG
88.10
2000-Feb-21
CNX MEDIA LONG
24.66
2008-Jan-04
CNX METAL LONG
58.47
2008-Jan-04
CNX MNC LONG
3.71
2015-Mar-12
CNX NIFTY LONG
6.84
2015-Mar-03
CNX PHARMA LONG
12.76
2015-Apr-08
CNX PSE LONG
24.69
2008-Jan-04
CNX REALTY SHORT
90.21
2008-Jan-14
A perk up in momentum metrics: RS-Spread has reverted to mean; bank and financials are showing some green shoots.

Correlation Update 27.06.2015

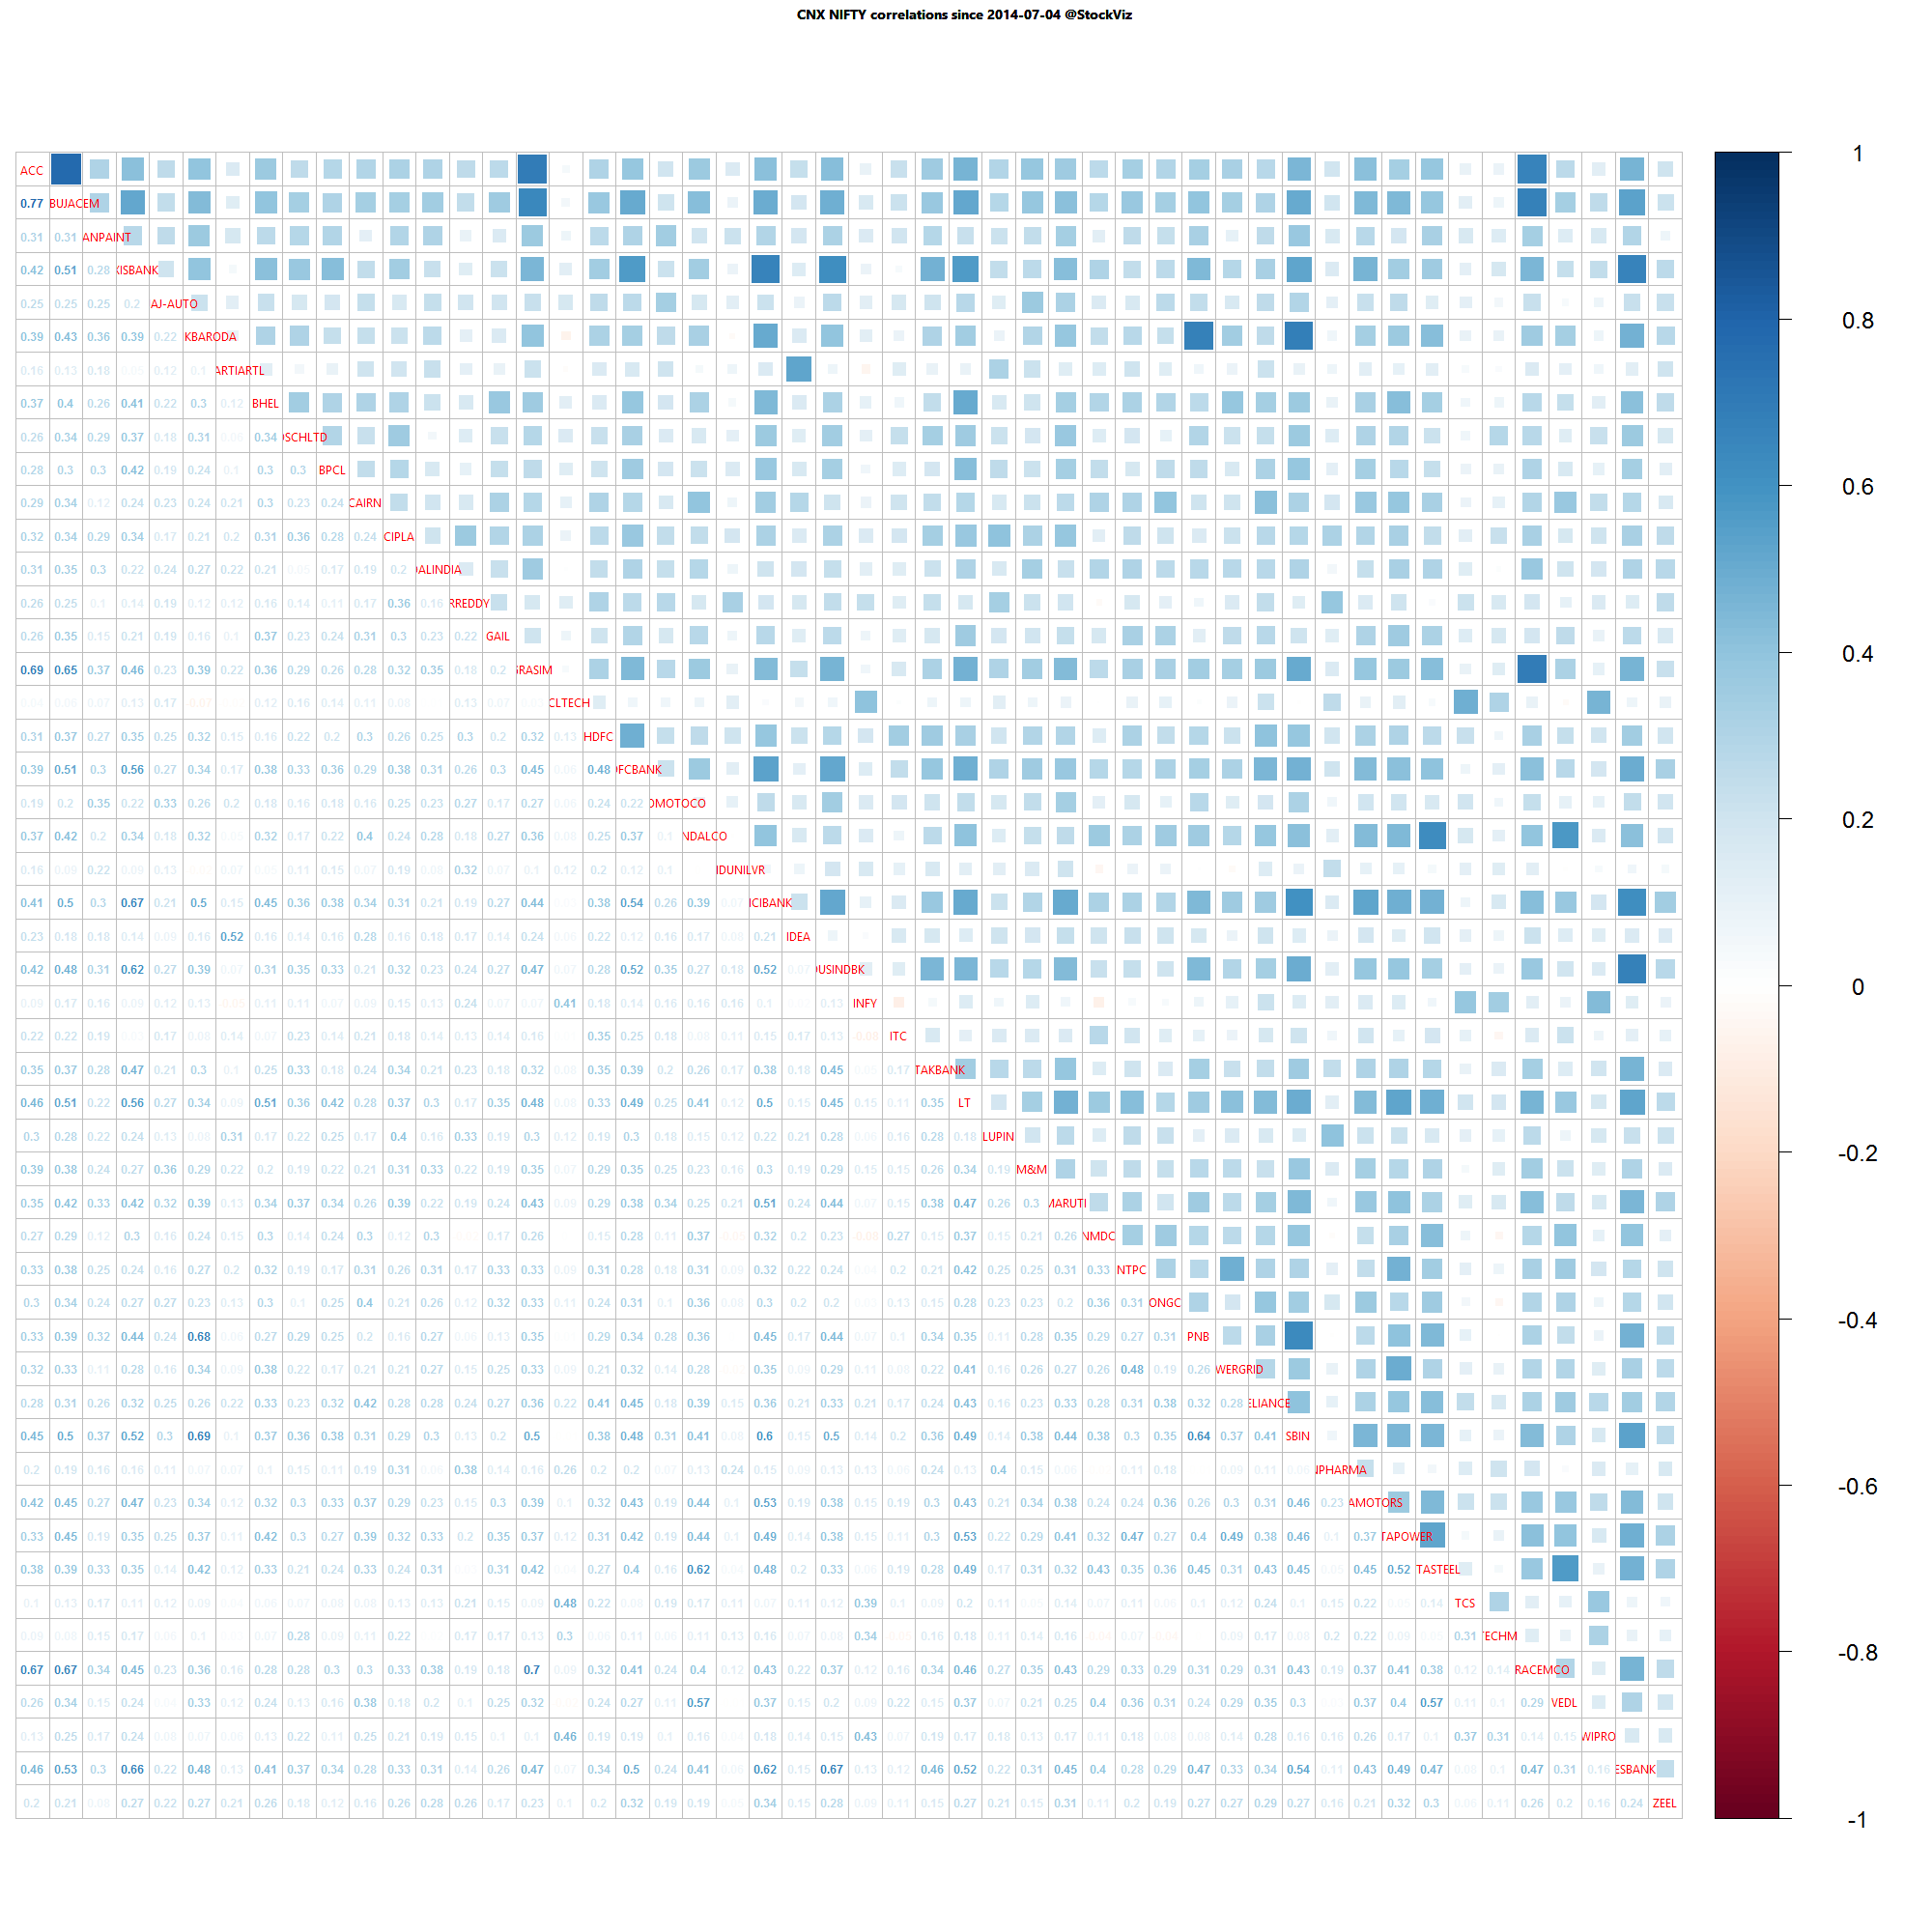
Nifty one year daily return correlations

Nifty one year daily return correlations

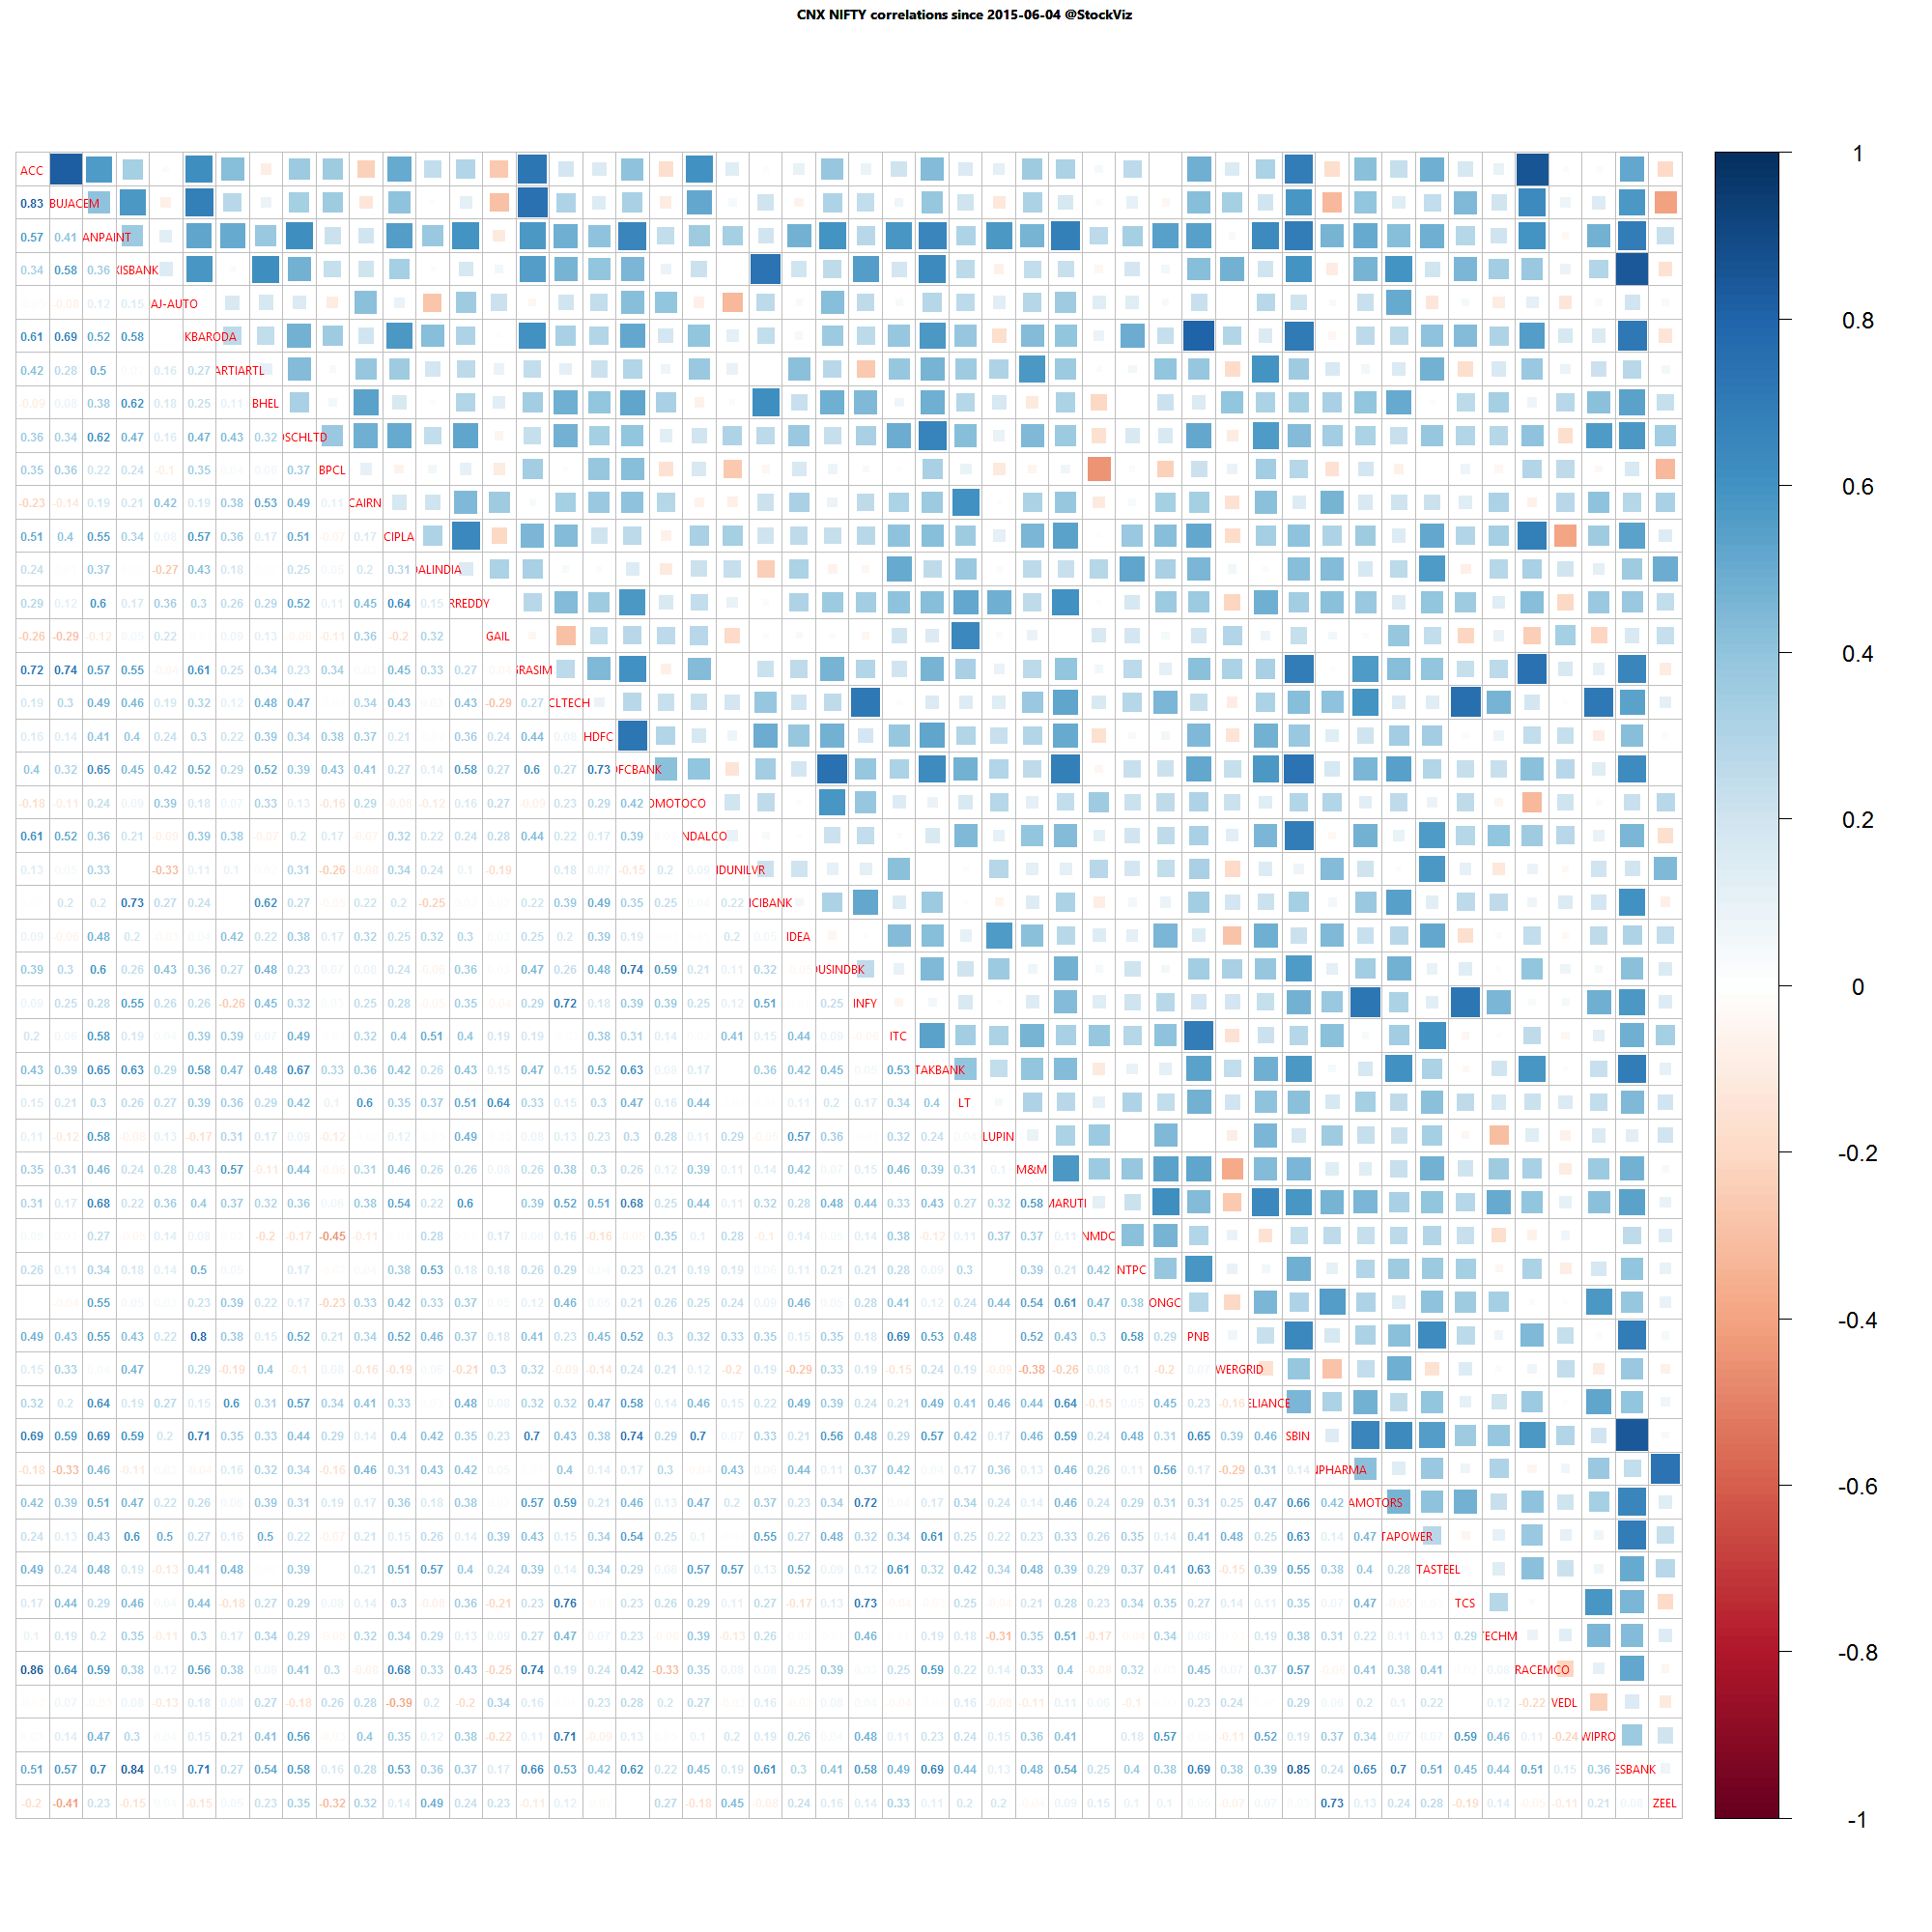
Nifty one month daily return correlations

Nifty one month daily return correlations

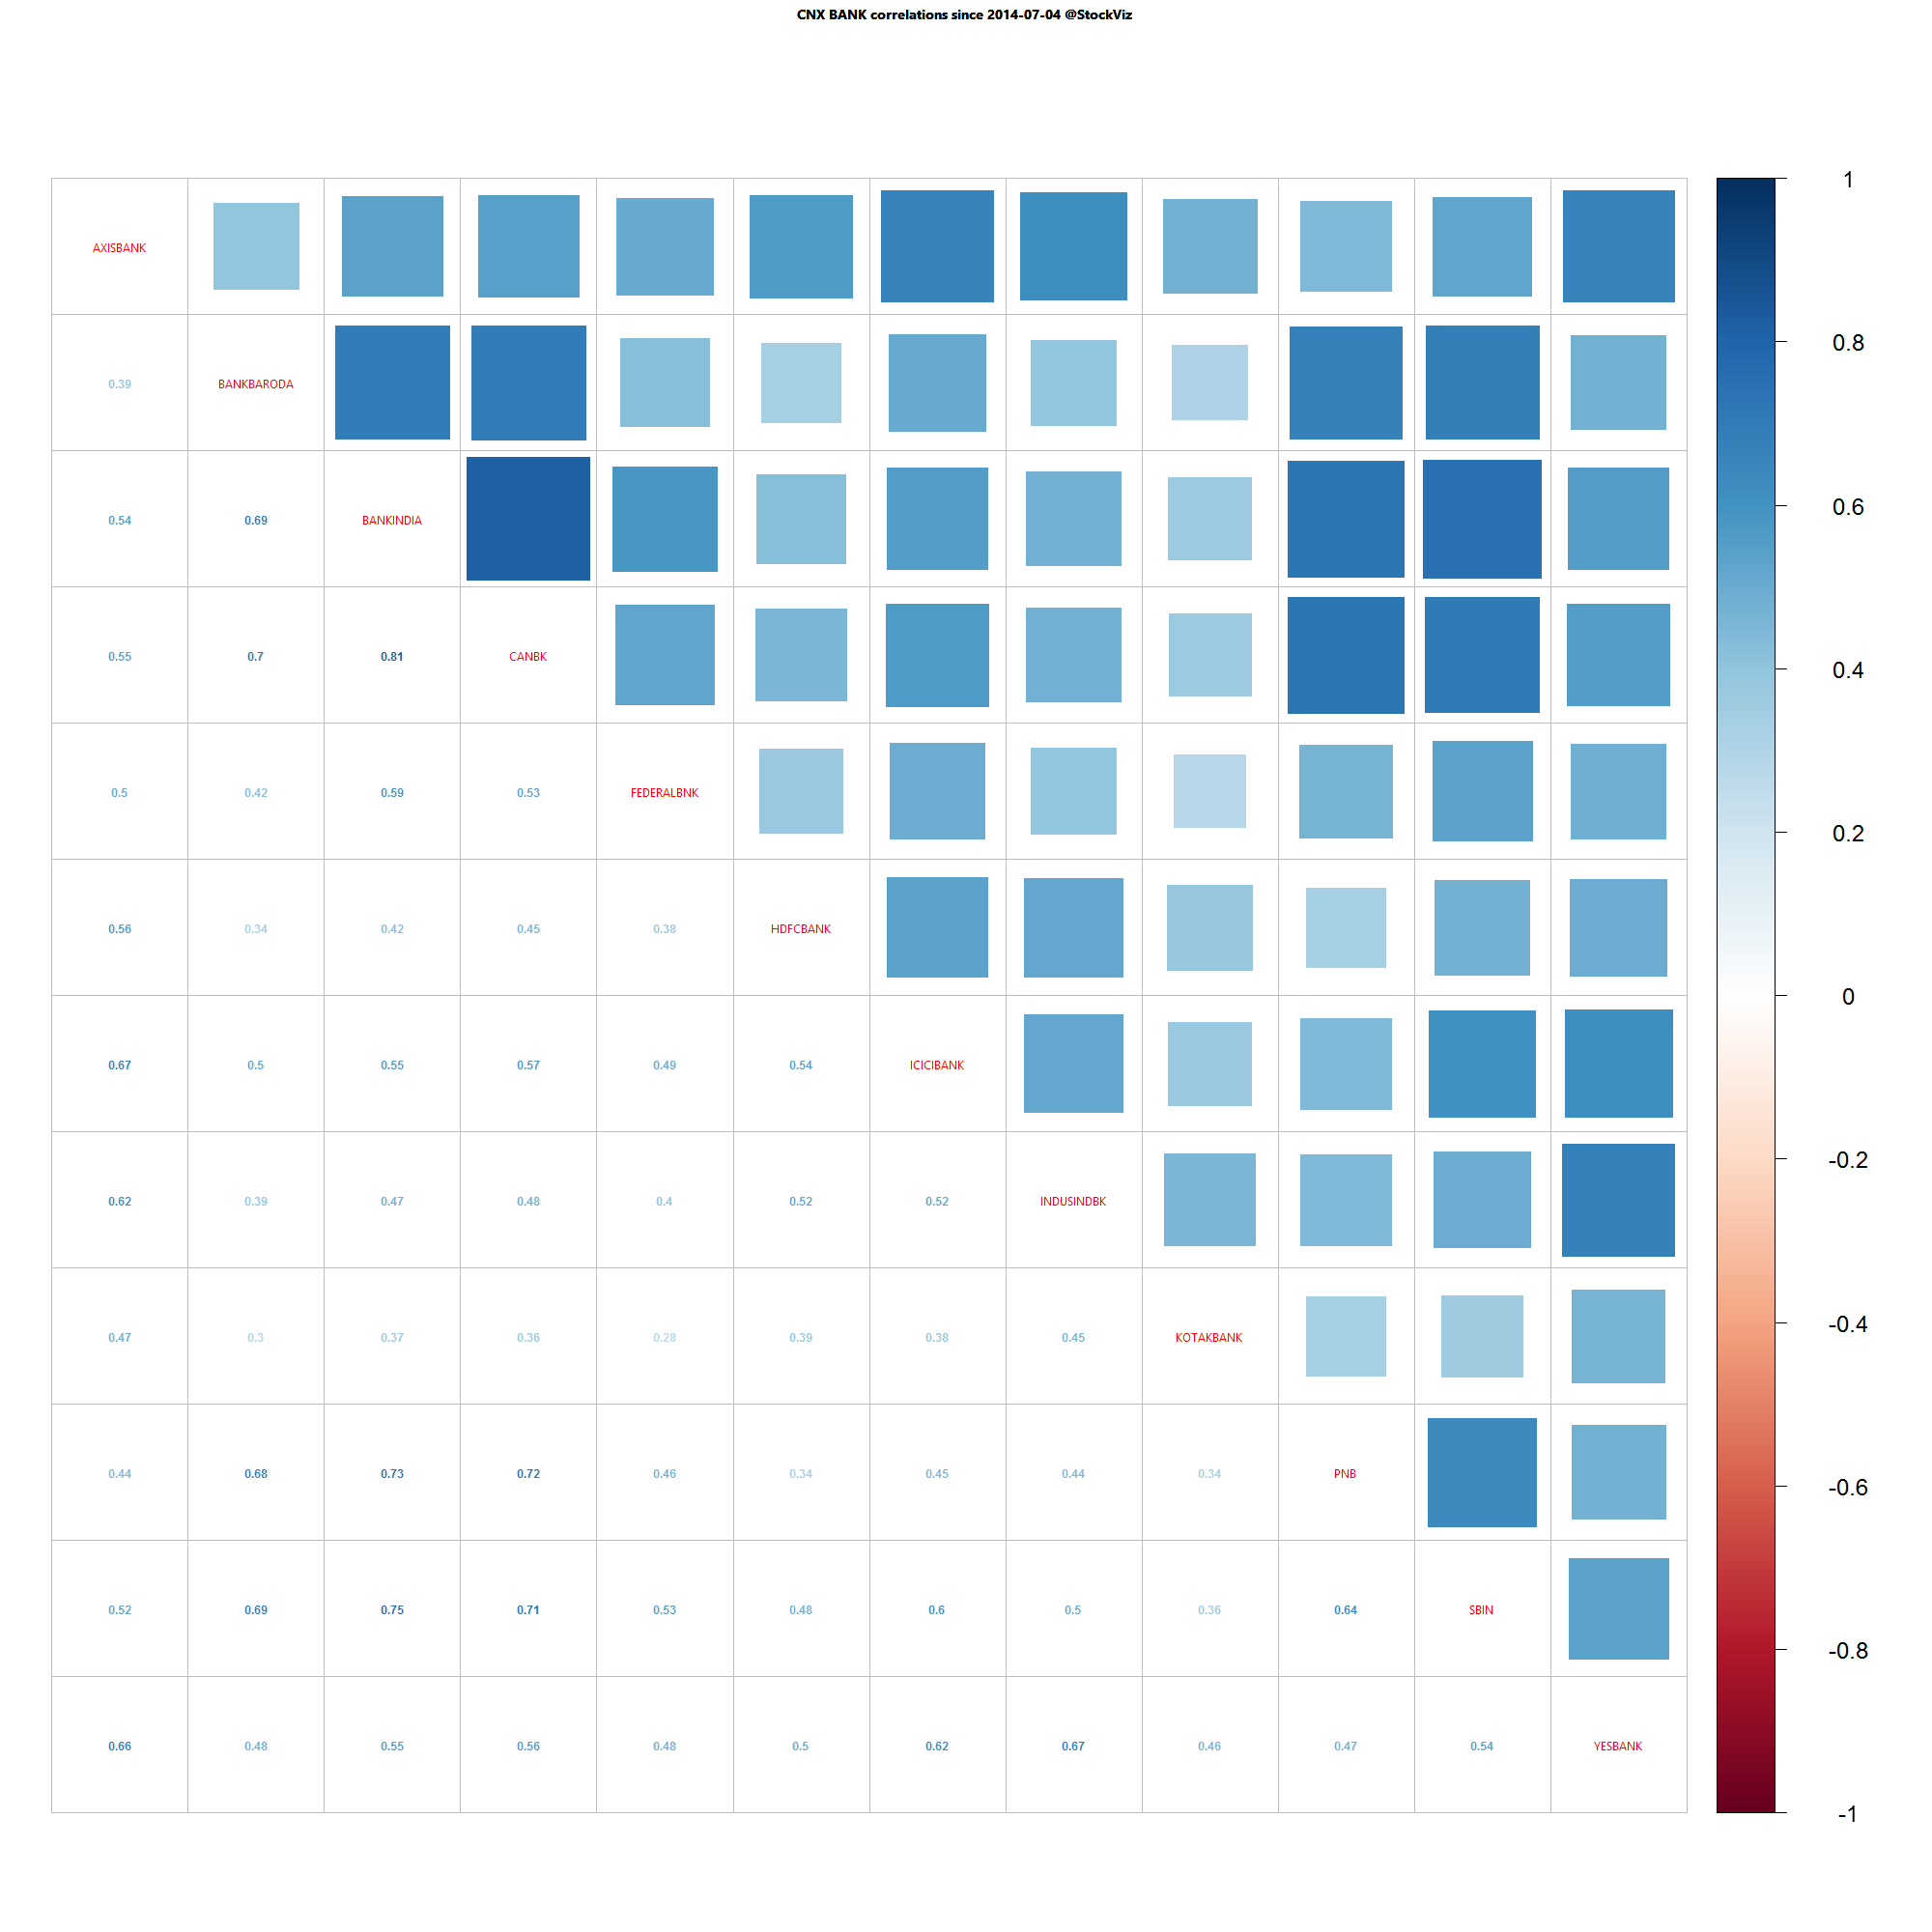
Bank Nifty one year daily return correlations

Bank Nifty one year daily return correlations

Bank Nifty one month daily return correlations

Bank Nifty one month daily return correlations

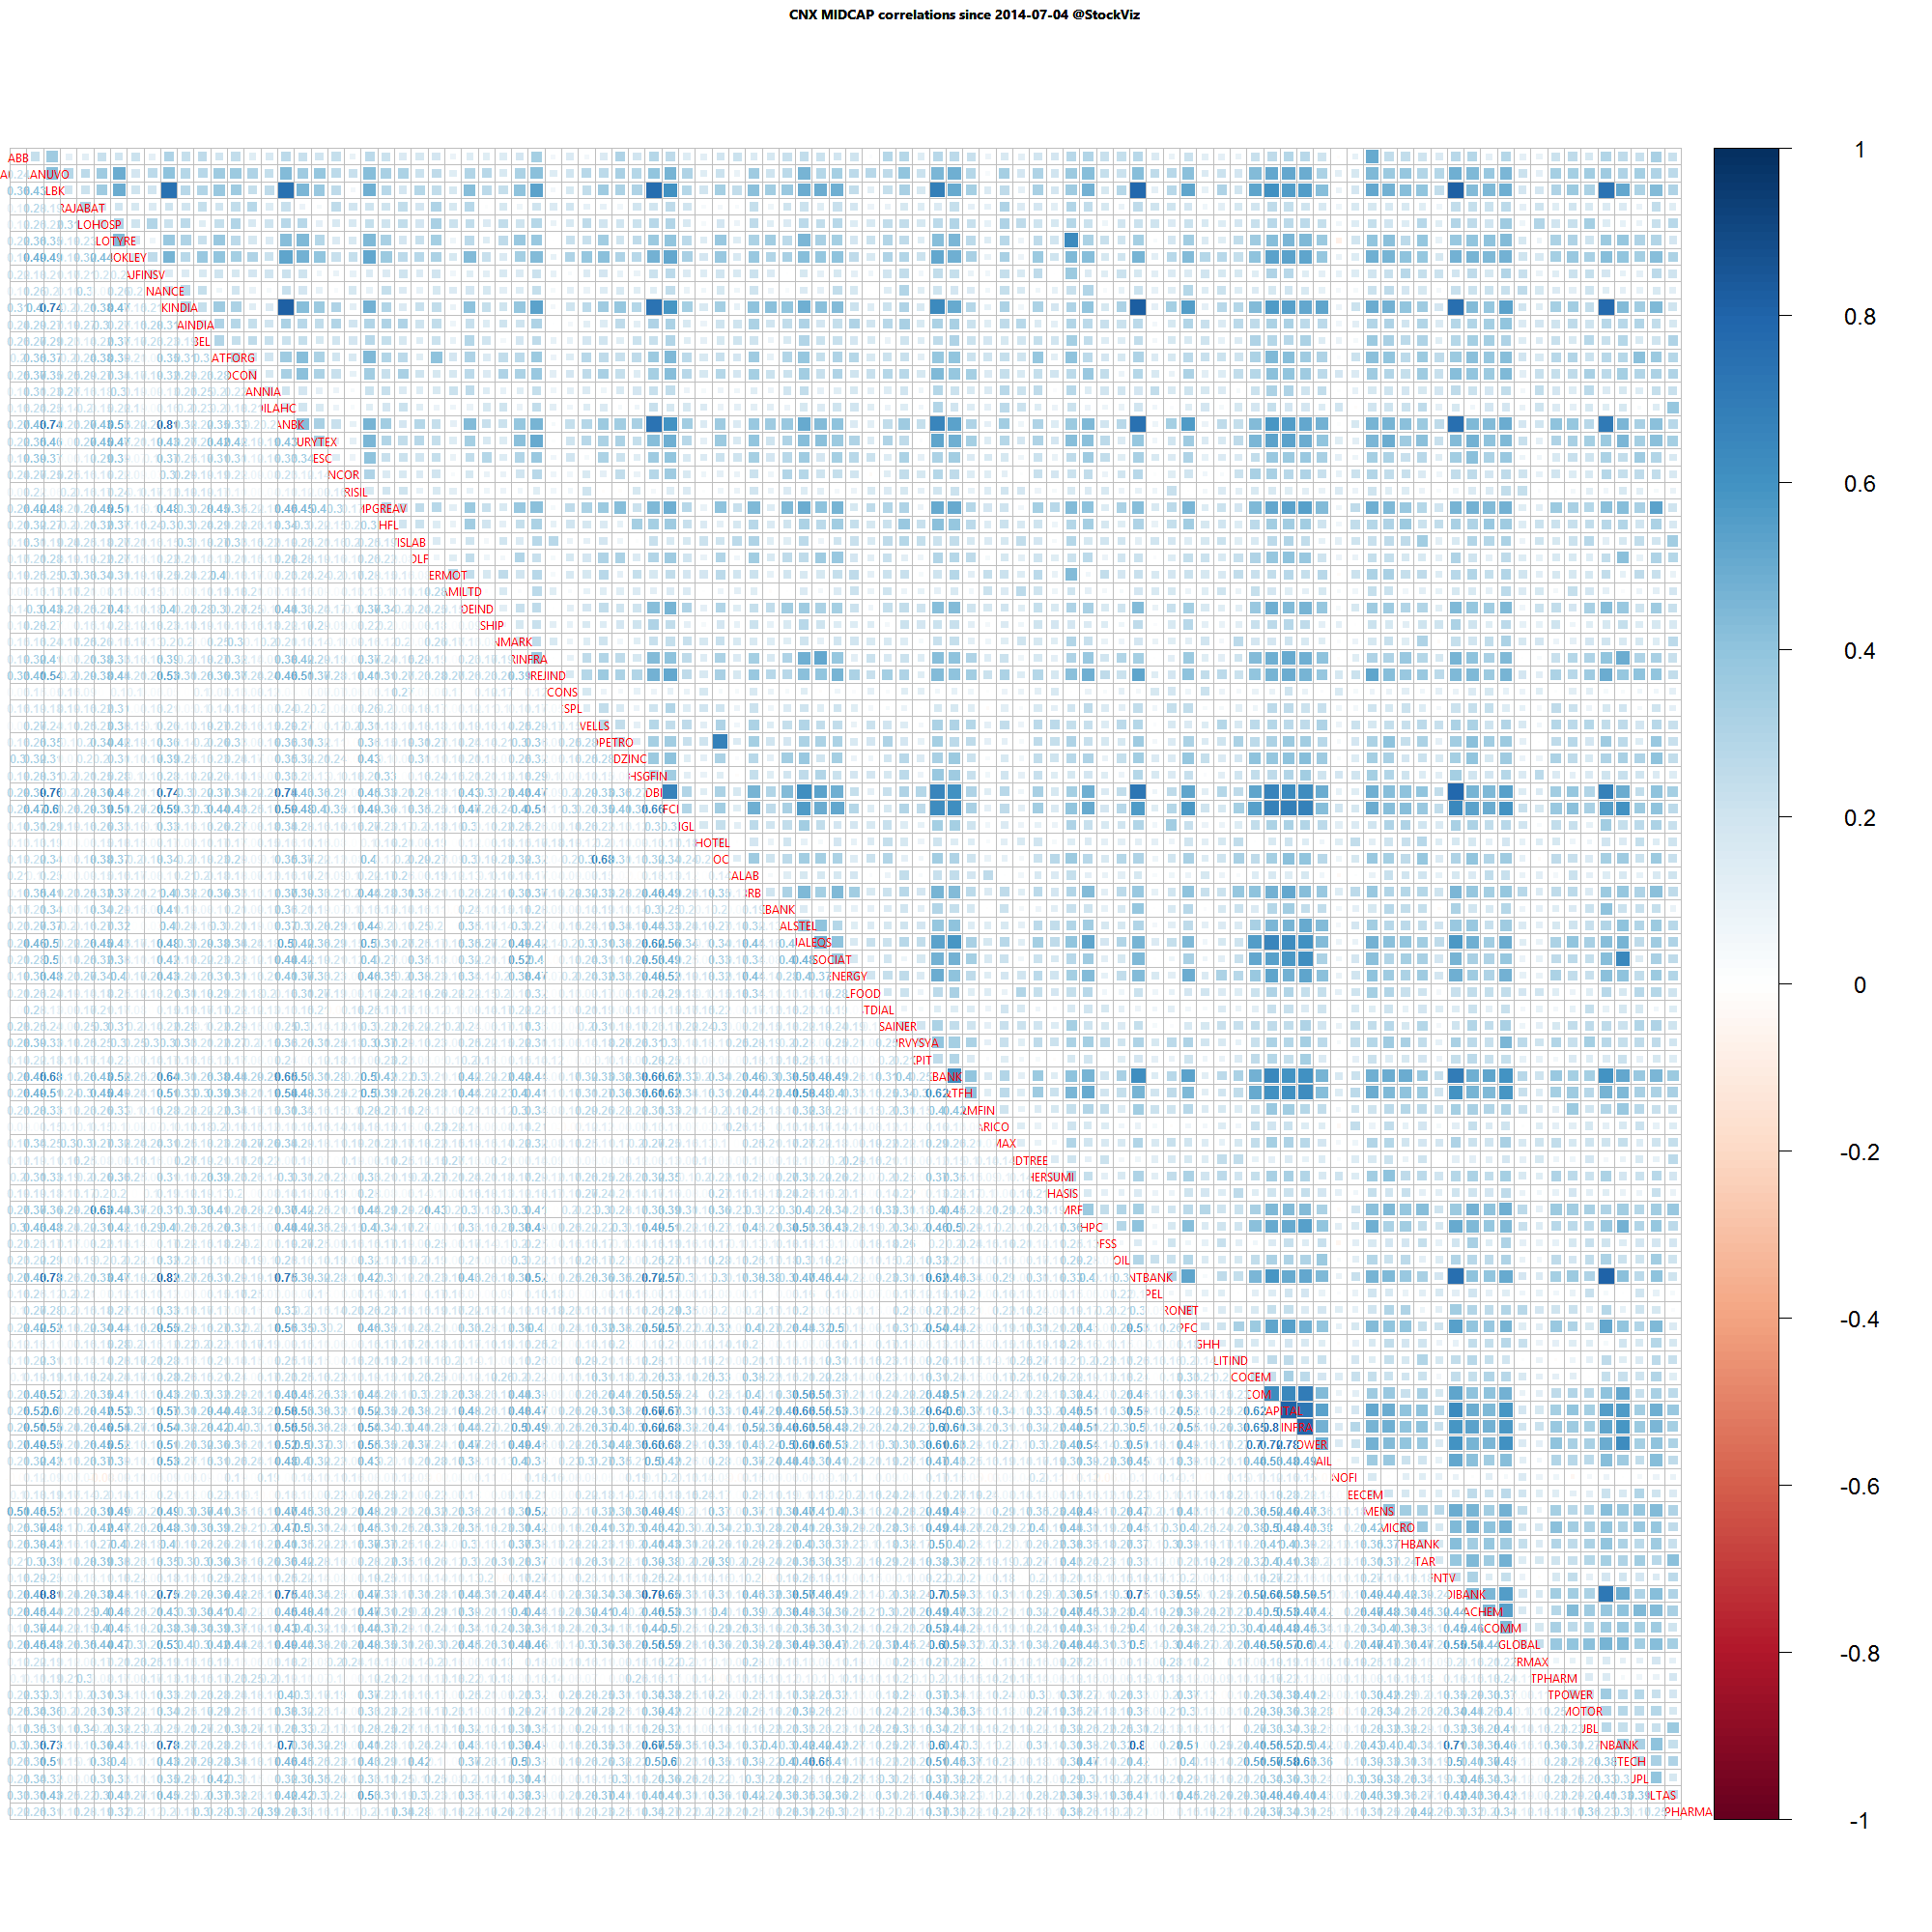
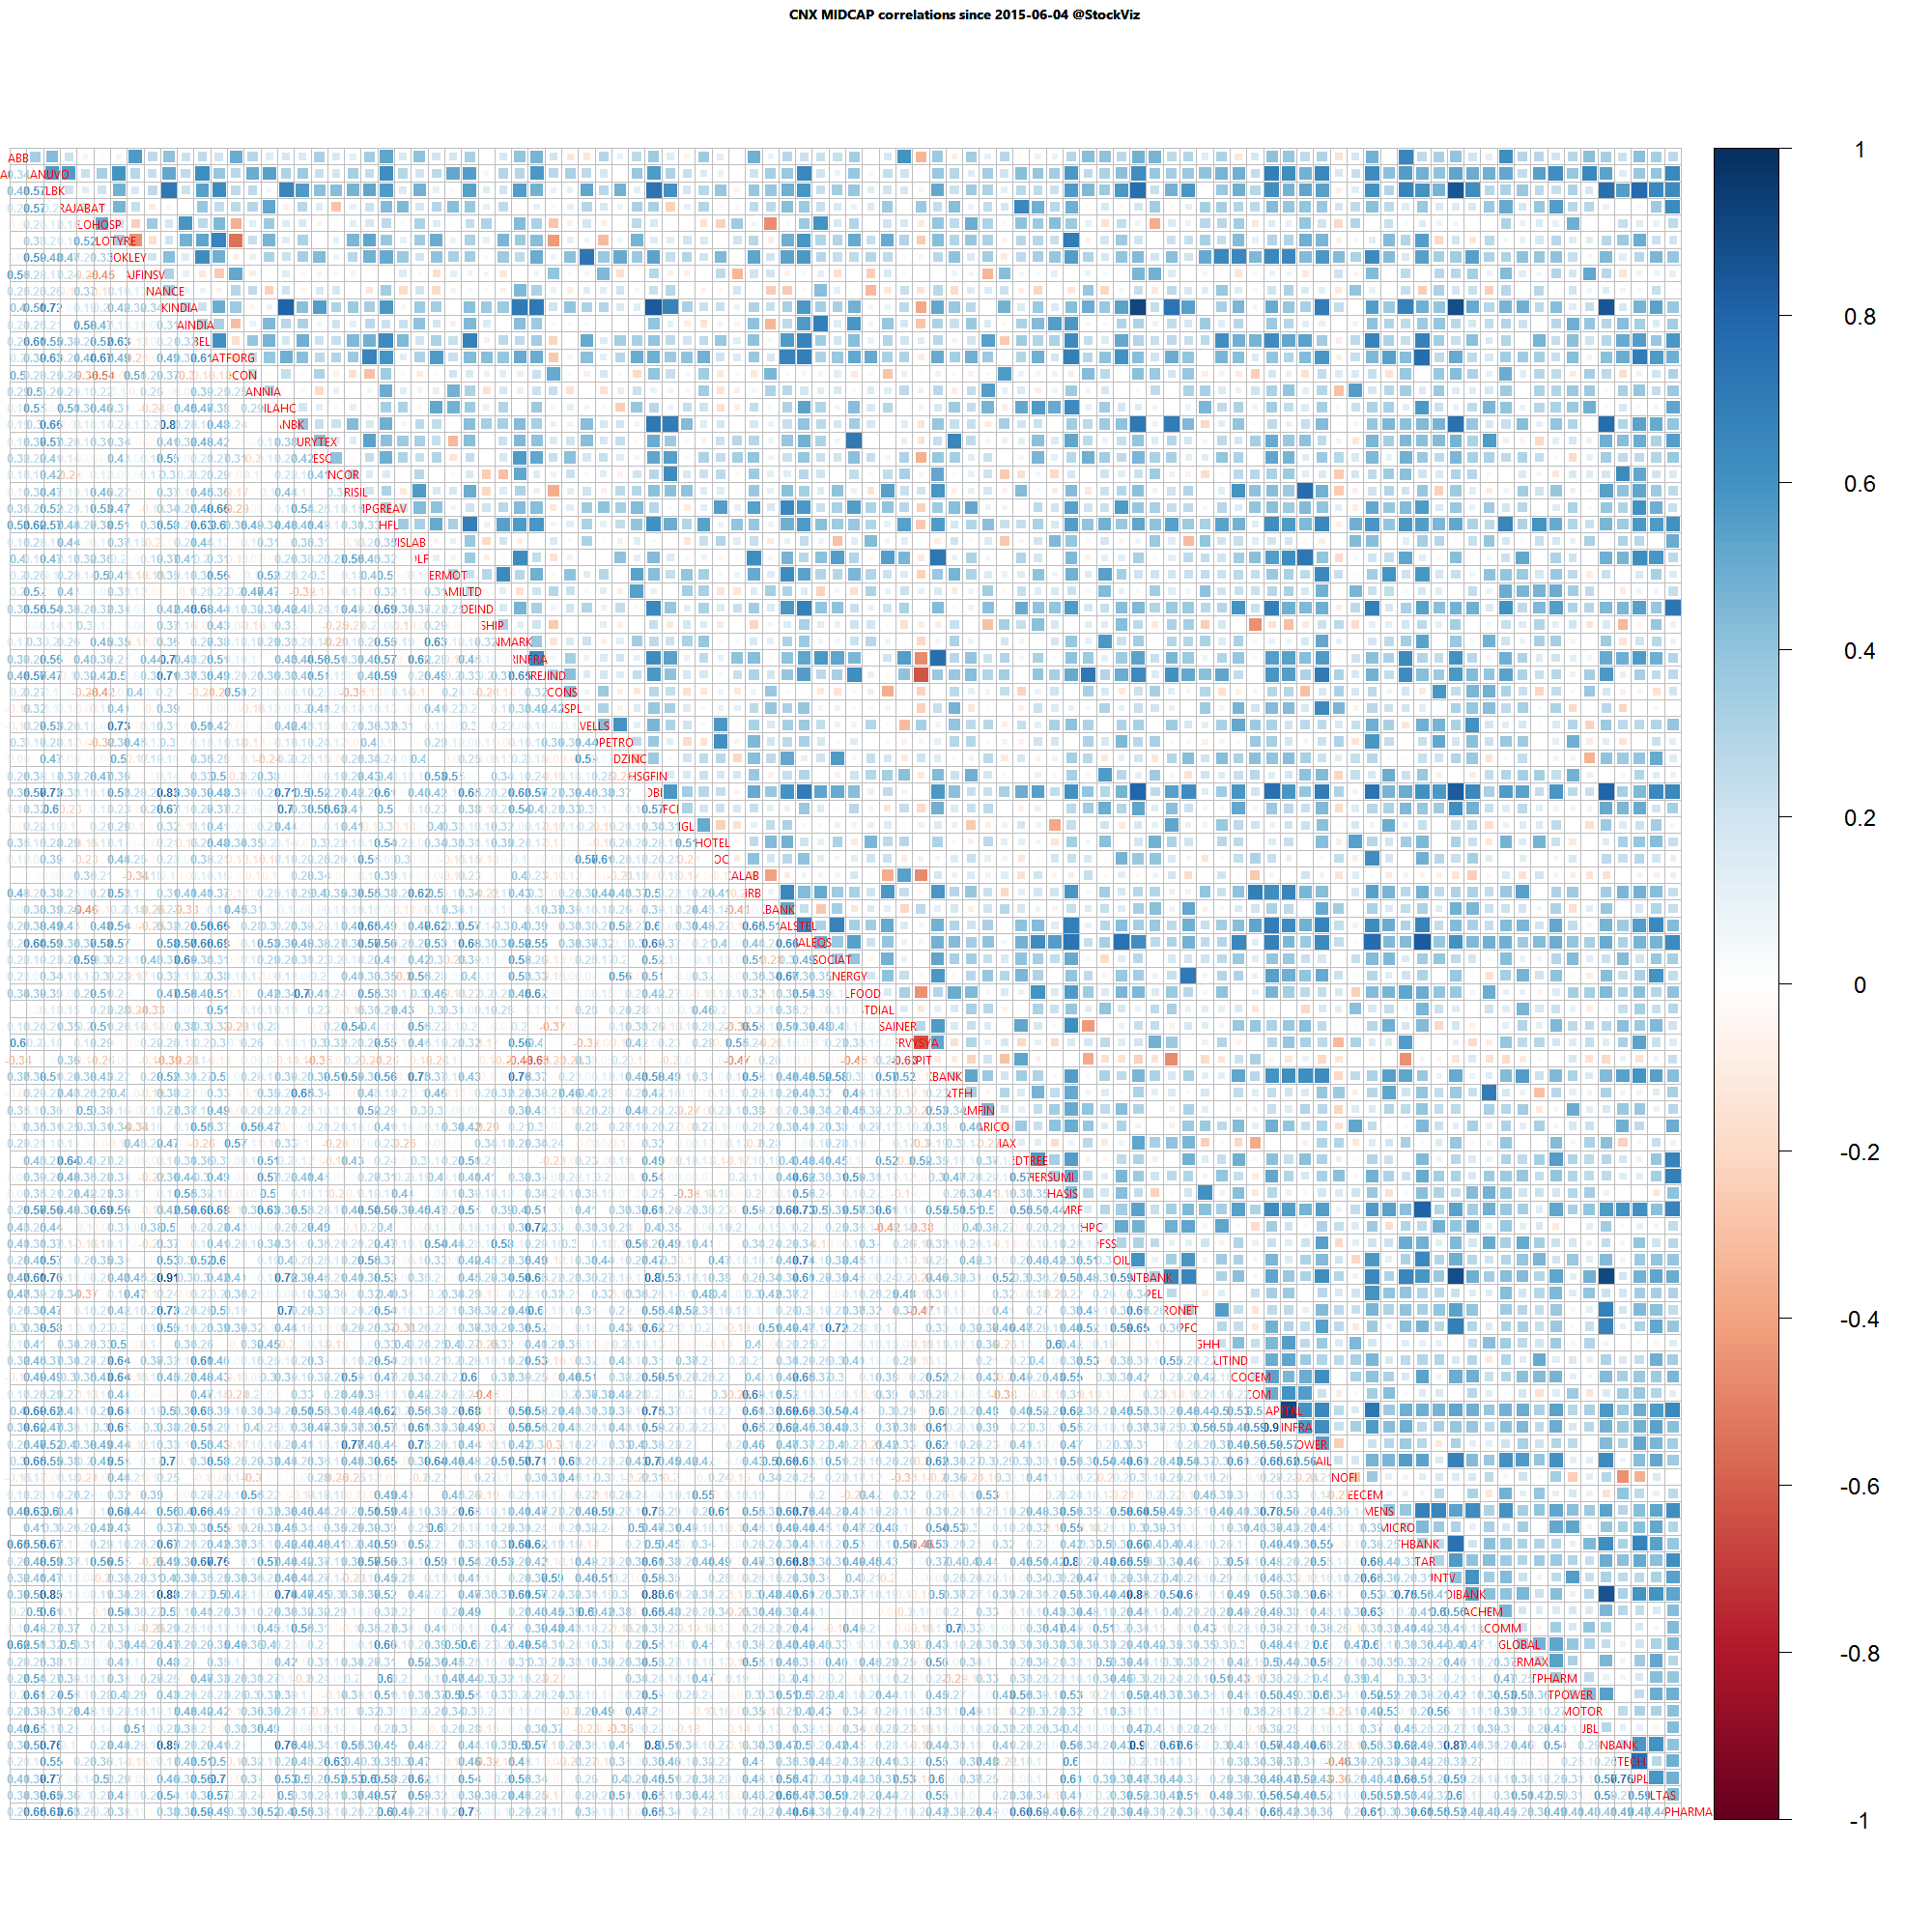
Midcap one year daily return correlations

Midcap one year daily return correlations

Midcap one month daily return correlations

Midcap one month daily return correlations

A lot of thick blue squares mean that positive correlations are high. Red squares mean negative correlations are high. Whites are the doldrums.

Momentum should be part of every portfolio

The Two Anomalies in Finance

Momentum and Value remain the two “anomalies” in finance. The Efficient Market Hypothesis cannot explain why value investing, where investors pick up “under-priced” stocks, and momentum investing, where investors bet on stocks that have already run up, give out-sized returns compared to the rest of the market. After all, aren’t markets supposed to discover the “right” price and negate these effects?

Investing in Momentum

Value investors get a lot of face-time in media – people like to hear about stocks that are “hidden gems” that can suddenly come alive and give out-sized returns. However, very little is spoken about momentum investing. This results in investment portfolios that are underweight momentum.

The problem with momentum investing are the large draw-downs. When momentum stocks tank, they do so spectacularly. The draw-down keeps away most mutual funds from seriously pursuing this strategy: a) they can’t get out easily, and b) if they show too much volatility, investors will revolt.

But individual investors don’t have these constraints if they learn to embrace volatility.

Comparing Momentum Returns

Our FundCompare tool allows you to see how momentum investing has fared over different time-frames and compare their returns to whatever mutual fund you own. For example, if you compare Momentum with the ICICI Value Discovery Fund, here’s how the monthly returns compare:

Between 2014-01-01 and 2015-06-18, Momentum has had an IRR of 70.16% vs. ICICI Prudential Value Discovery Fund’s IRR of 50.05%download

How much should you invest?

Risk, at the end of the day, is whatever allows you to sleep at night. You could start with a 10% allocation and scale till you reach your limit. Whichever way you choose to go bout it, our Momentum Theme will be ready for you.

Weekly Recap: What is Life?

world.2015-06-12.2015-06-19

Equities

Major
DAX(DEU) -1.40%
CAC(FRA) -1.75%
UKX(GBR) -1.10%
NKY(JPN) -1.14%
SPX(USA) +0.75%
MINTs
JCI(IDN) +1.00%
INMEX(MEX) +0.60%
NGSEINDX(NGA) -1.08%
XU030(TUR) +2.55%
BRICS
IBOV(BRA) +0.89%
SHCOMP(CHN) -13.32%
NIFTY(IND) +3.03%
INDEXCF(RUS) +0.65%
TOP40(ZAF) +0.09%

Commodities

Energy
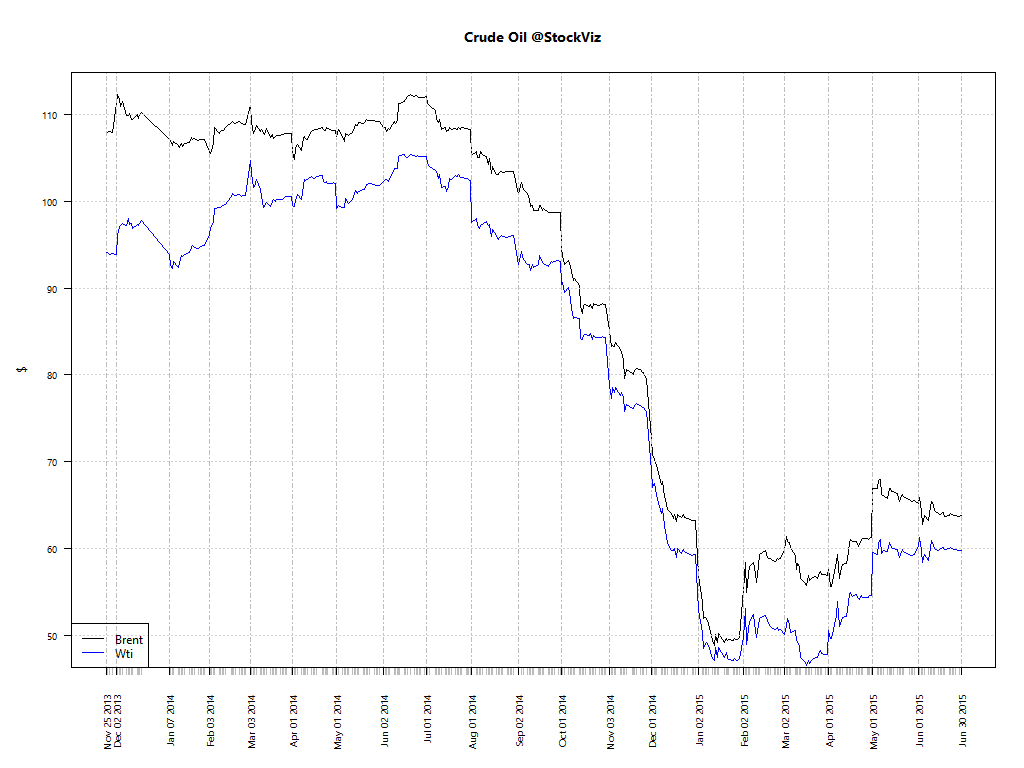
Brent Crude Oil -1.87%
Ethanol +0.88%
Heating Oil -2.07%
Natural Gas +2.32%
RBOB Gasoline -3.63%
WTI Crude Oil -1.28%
Metals
Palladium -3.98%
Silver 5000oz +1.90%
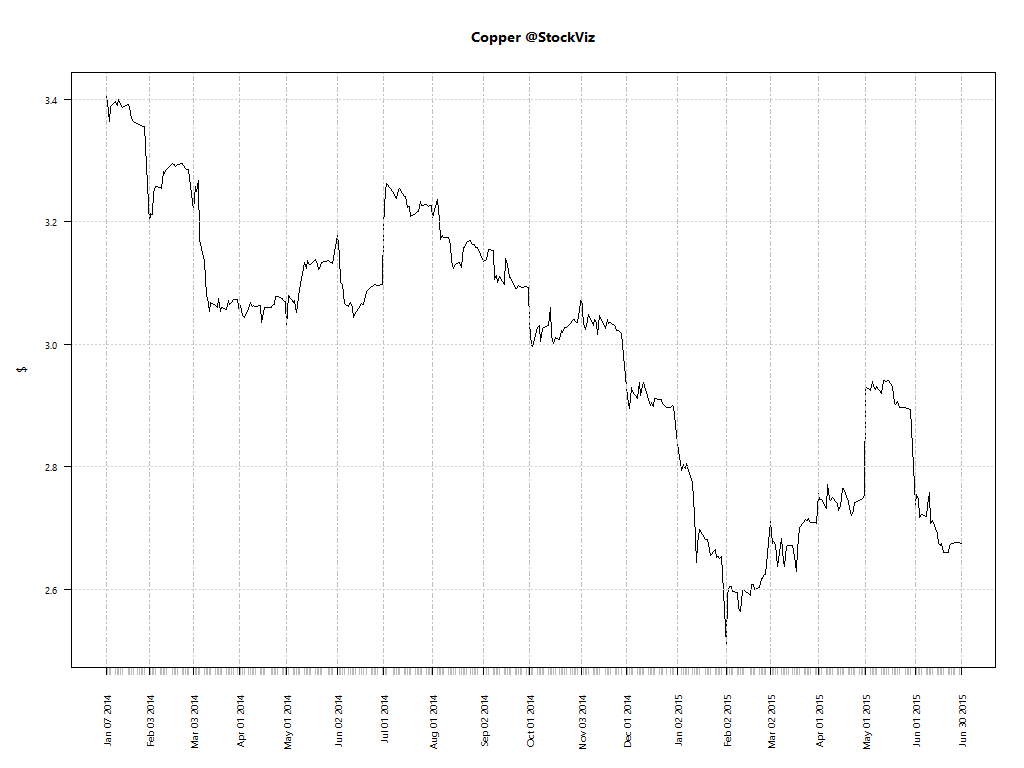
Copper -3.70%
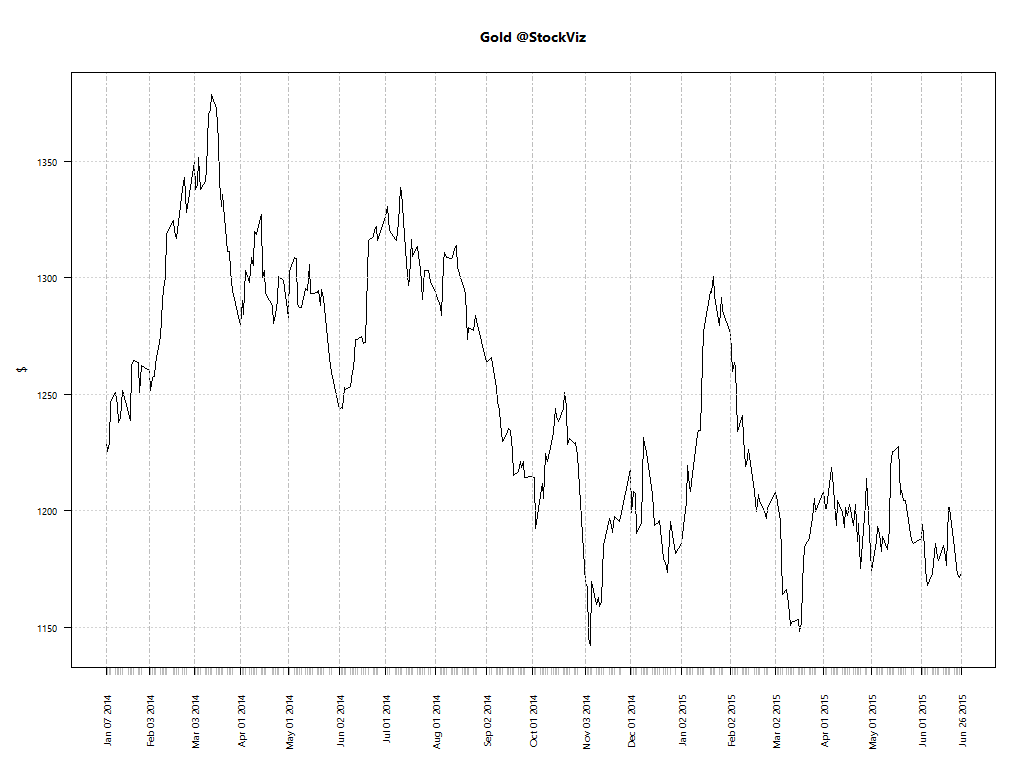
Gold 100oz +1.74%
Platinum -0.96%

Currencies

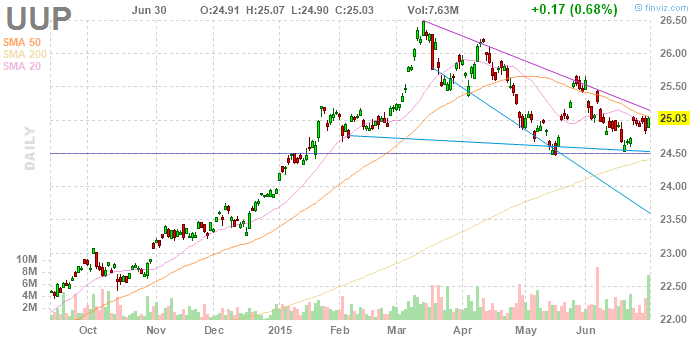
USDEUR:-0.67% USDJPY:-0.66%

MINTs
USDIDR(IDN) -0.03%
USDMXN(MEX) -0.38%
USDNGN(NGA) +0.05%
USDTRY(TUR) -0.77%
BRICS
USDBRL(BRA) -0.53%
USDCNY(CHN) +0.02%
USDINR(IND) -0.78%
USDRUB(RUS) -2.09%
USDZAR(ZAF) -1.78%
Agricultural
Coffee (Arabica) -4.41%
Coffee (Robusta) +6.65%
Lean Hogs -6.93%
Lumber +1.63%
Orange Juice -2.23%
Corn +0.00%
Cotton -0.84%
White Sugar +0.40%
Feeder Cattle -0.04%
Cattle -0.30%
Cocoa +0.62%
Soybean Meal +1.86%
Soybeans +3.33%
Sugar #11 -5.12%
Wheat -3.07%

Credit Indices

Index Change
Markit CDX EM -0.21%
Markit CDX NA HY -0.84%
Markit CDX NA IG +4.06%
Markit iTraxx Asia ex-Japan IG +2.43%
Markit iTraxx Australia +3.39%
Markit iTraxx Europe +9.01%
Markit iTraxx Europe Crossover +36.53%
Markit iTraxx Japan +4.22%
Markit iTraxx SovX Western Europe +2.81%
Markit LCDX (Loan CDS) +0.00%
Markit MCDX (Municipal CDS) +0.97%
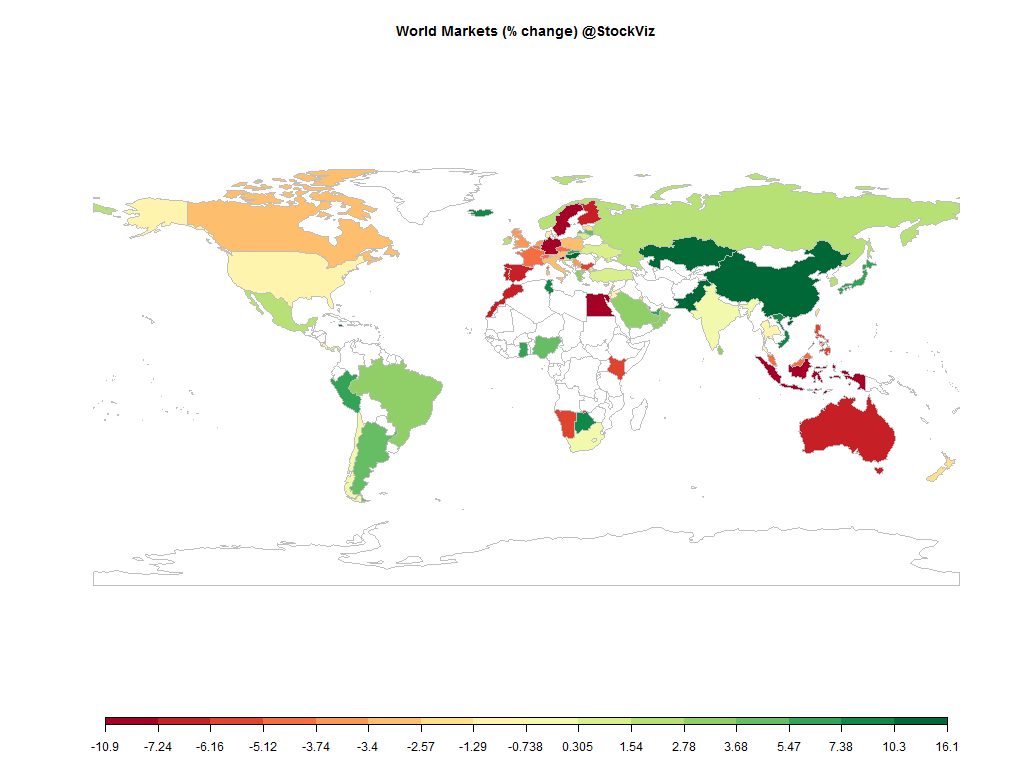
China is going through whatever India went through in the 90’s. Europe is going through their quarterly Greece-related gyrations. And Indian markets woke up…

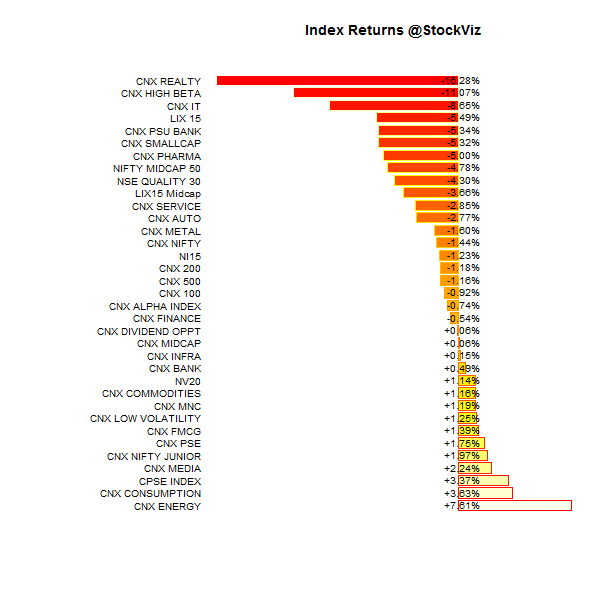
Index Returns

index.performance.2015-06-12.2015-06-19
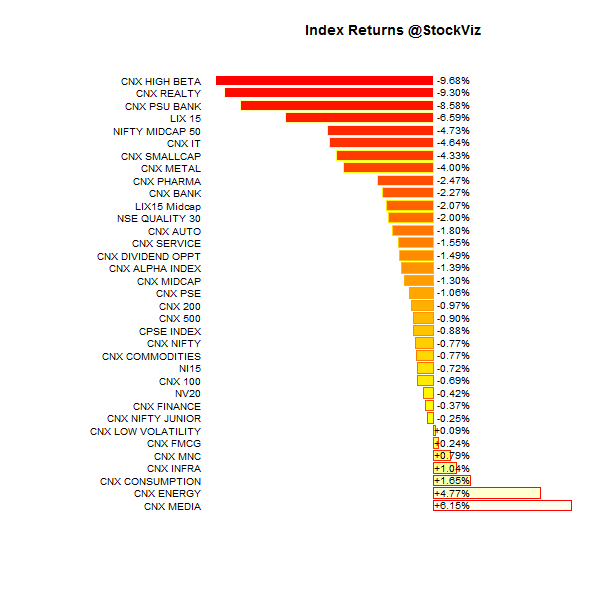
For a deeper dive into indices, check out our weekly Index Update.

Market Cap Decile Performance

Decile Mkt. Cap. Adv/Decl
1 (micro) +1.32% 68/58
2 +2.63% 64/62
3 +2.92% 67/59
4 +4.06% 65/60
5 +3.86% 67/59
6 +3.84% 76/50
7 +2.58% 66/59
8 +2.74% 63/63
9 +2.69% 68/58
10 (mega) +2.70% 63/63
Rally across the board…

Top Winners and Losers

EICHERMOT +11.73%
RELIANCE +12.00%
GLENMARK +12.36%
MCDOWELL-N -6.31%
VEDL -4.87%
CONCOR -4.65%
This stopped making sense a long time ago…

ETF Performance

NIFTYBEES +2.96%
JUNIORBEES +2.60%
CPSEETF +2.39%
BANKBEES +2.12%
PSUBNKBEES +1.52%
GOLDBEES +0.51%
INFRABEES -1.00%
There is talk about #gold #bonds being floated around by the RBI. After the tepid reaction to inflation-linked bonds and gold-deposits, you would think they would approach this topic with a bit more humility…

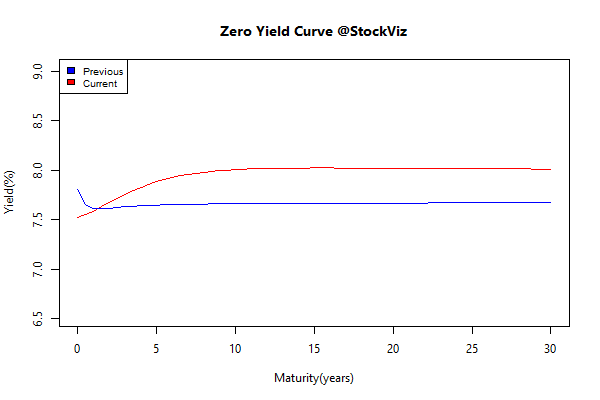
Yield Curve

yield Curve.2015-06-12.2015-06-19

Bond Indices

Sub Index Change in YTM Total Return(%)
GSEC TB +0.13 +0.11%
GSEC SUB 1-3 +0.07 +0.20%
GSEC SUB 3-8 -0.16 +0.99%
GSEC SUB 8 -0.03 +0.59%
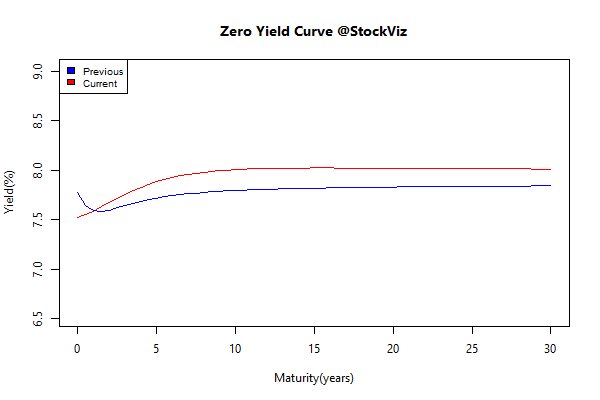
A smart recovery at the middle…

Investment Theme Performance

Equity Mutual Funds

Bond Mutual Funds

Thought for the weekend

Index Update 20.06.2015

MOMENTUM

We run our proprietary momentum scoring algorithm on indices just like we do on stocks. You can use the momentum scores of sub-indices to get a sense for which sectors have the wind on their backs and those that are facing headwinds.

Traders can pick their longs in sectors with high short-term momentum and their shorts in sectors with low momentum. Investors can use the longer lookback scores to position themselves using our re-factored index Themes.

You can see how the momentum algorithm has performed on individual stocks here.

Here are the best and the worst sub-indices:

index momentum best 365 2015-06-19 png

index momentum best 50 2015-06-19 png

index momentum worst 365 2015-06-19 png

index momentum worst 50 2015-06-19 png

Relative Strength Spread

CNX_500 relative-spread-index 50 2015-06-19 png

Refactored Index Performance

50-day performance, from April 09, 2015 through June 19, 2015:

Trend Model Summary

Index Signal % From Peak Day of Peak
CNX AUTO LONG
8.73
2015-Jan-27
CNX BANK SHORT
13.01
2015-Jan-27
CNX ENERGY LONG
26.08
2008-Jan-14
CNX FMCG SHORT
13.23
2015-Feb-25
CNX INFRA SHORT
48.68
2008-Jan-09
CNX IT SHORT
88.23
2000-Feb-21
CNX MEDIA LONG
26.66
2008-Jan-04
CNX METAL SHORT
58.84
2008-Jan-04
CNX MNC SHORT
5.41
2015-Mar-12
CNX NIFTY SHORT
8.57
2015-Mar-03
CNX PHARMA SHORT
14.61
2015-Apr-08
CNX PSE SHORT
25.47
2008-Jan-04
CNX REALTY SHORT
90.75
2008-Jan-14
Looks like Banks, FMCG and Pharma are perking up. MNCs and Autos are recovering from their drawdowns as well…