Weekly Recap: Illusion of Insight

world.2015-06-26.2015-07-03

Equities

Major
DAX(DEU) -3.78%
CAC(FRA) -4.96%
UKX(GBR) -2.49%
NKY(JPN) -0.80%
SPX(USA) -1.07%
MINTs
JCI(IDN) +1.22%
INMEX(MEX) -1.33%
NGSEINDX(NGA) -0.96%
XU030(TUR) -3.24%
BRICS
IBOV(BRA) -2.42%
SHCOMP(CHN) -12.07%
NIFTY(IND) +1.24%
INDEXCF(RUS) -0.78%
TOP40(ZAF) -1.49%

Commodities

Energy
Brent Crude Oil -4.66%
Ethanol +3.10%
Natural Gas +0.18%
WTI Crude Oil -6.97%
Heating Oil -3.60%
RBOB Gasoline -2.01%
Metals
Copper -1.13%
Palladium +0.78%
Platinum +0.21%
Gold 100oz -0.29%
Silver 5000oz -0.64%

Currencies

USDEUR:+0.51% USDJPY:-0.86%

MINTs
USDIDR(IDN) +0.09%
USDMXN(MEX) +0.96%
USDNGN(NGA) -0.03%
USDTRY(TUR) +0.95%
BRICS
USDBRL(BRA) +0.25%
USDCNY(CHN) -0.06%
USDINR(IND) -0.32%
USDRUB(RUS) +1.83%
USDZAR(ZAF) +0.82%
Agricultural
Corn +9.16%
Feeder Cattle +0.15%
Lean Hogs +4.63%
Lumber -1.60%
Cattle +2.02%
Cocoa -0.23%
Coffee (Arabica) -4.07%
Cotton +1.26%
Coffee (Robusta) -2.48%
Orange Juice -2.44%
Soybean Meal +4.91%
Soybeans +4.58%
Sugar #11 +6.14%
Wheat +4.59%
White Sugar +3.31%

Credit Indices

Index Change
Markit CDX EM -0.19%
Markit CDX NA HY +0.10%
Markit CDX NA IG +1.32%
Markit iTraxx Asia ex-Japan IG +5.12%
Markit iTraxx Australia +5.77%
Markit iTraxx Europe +6.41%
Markit iTraxx Europe Crossover +27.25%
Markit iTraxx Japan +0.68%
Markit iTraxx SovX Western Europe +2.22%
Markit LCDX (Loan CDS) -0.04%
Markit MCDX (Municipal CDS) +4.16%
The Nifty was one of the few global indices that ended this week in the green. Pretty much all markets were buffetted by the Greece drama. Shanghai had one of the worst weeks ever – Chinese regulators have allowed pretty much anything to be posted as collateral, the only thing that remains to be tried is outlawing falling stock prices.

Nifty Heatmap

CNX NIFTY.2015-06-26.2015-07-03

Index Returns

For a deeper dive into indices, check out our weekly Index Update.
index.performance.2015-06-26.2015-07-03

Sector Performance

sector performance.2015-06-26.2015-07-03

Market Cap Decile Performance

Decile Mkt. Cap. Adv/Decl
1 (micro) +2.10% 64/67
2 +2.76% 71/59
3 +3.02% 72/59
4 +2.47% 68/62
5 +3.80% 76/55
6 +2.73% 67/63
7 +1.58% 69/62
8 +1.35% 67/63
9 +1.52% 63/68
10 (mega) +0.81% 72/59
Midcaps outperformed large-caps. Is this a sign of the market turning around?

Top Winners and Losers

AMBUJACEM +6.76%
BAJAJFINSV +12.09%
UBL +13.80%
TECHM -9.62%
HINDALCO -5.47%
BHARATFORG -3.67%
Who would’ve thunk that a cement stock can go up more than 6% in a week?

ETF Performance

BANKBEES +1.72%
JUNIORBEES +1.70%
PSUBNKBEES +1.02%
NIFTYBEES +0.88%
CPSEETF +0.56%
INFRABEES +0.36%
GOLDBEES -1.07%
Banks caught a bid. Gold sank.

Yield Curve

yield Curve.2015-06-26.2015-07-03

Bond Indices

Sub Index Change in YTM Total Return(%)
GSEC TB -0.14 +0.12%
GSEC SUB 1-3 +0.16 -0.10%
GSEC SUB 3-8 +0.32 -1.27%
GSEC SUB 8 +0.19 -1.32%
The long end of the curve got creamed…

Investment Theme Performance

Equity Mutual Funds

Bond Mutual Funds

Thought for the weekend

People were more confident that they knew the answers — had the information in their heads — if they had access to [internet] search. It’s more like thinking you know how to fix a car if you have access to a mechanic.

Plus, searching the internet is almost effortless, and it’s almost always accessible. You never face your ignorance when it’s there. Because we’re so deeply plugged into it, we misattribute the connection to knowledge to actually having the knowledge ourselves.

Emotional investments can give people the illusion of insight.

Source: The Internet Makes You Think You’re Smarter Than You Are

Index Update 04.07.2015

MOMENTUM

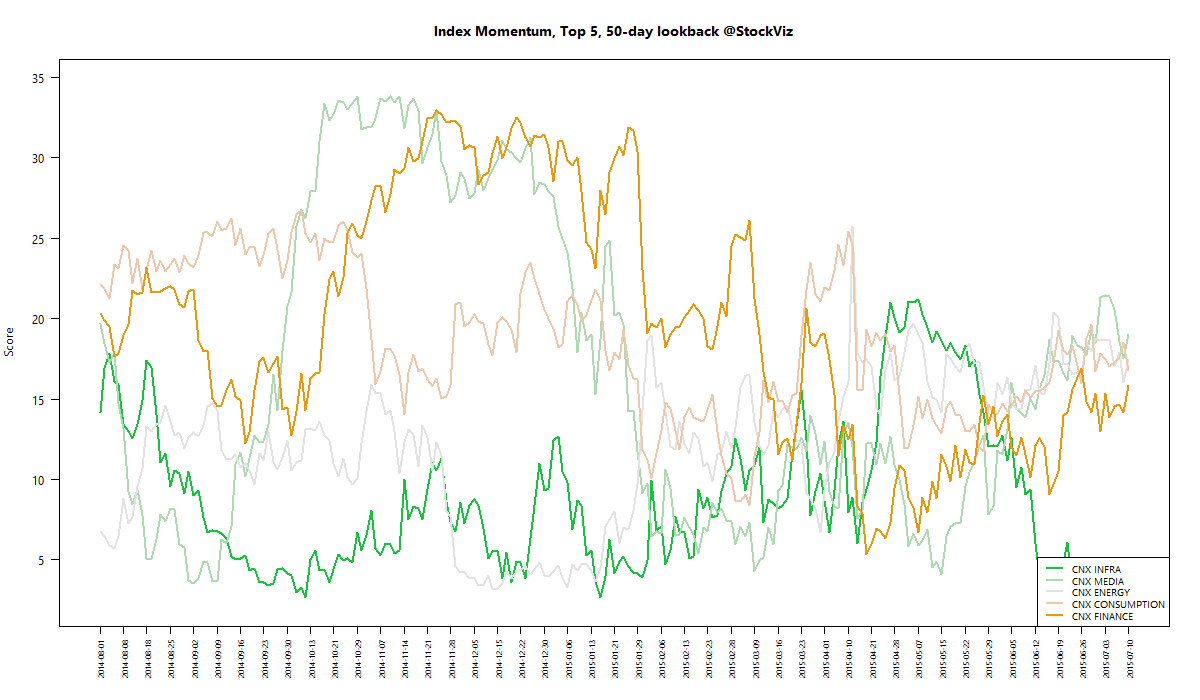
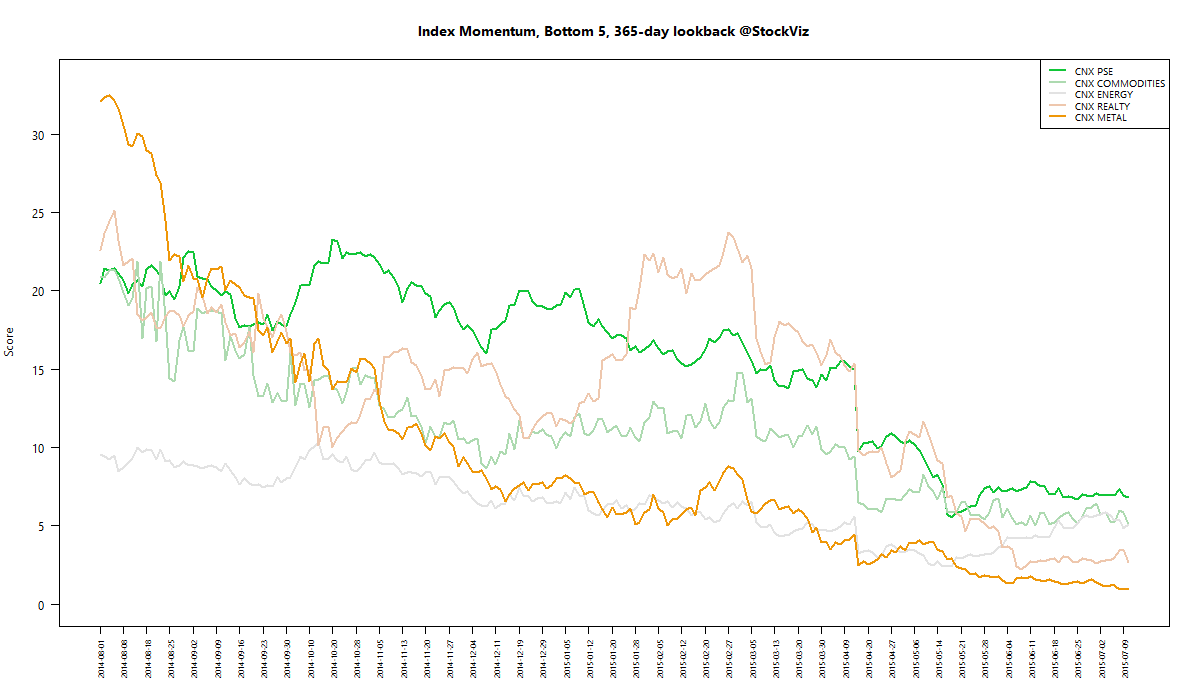
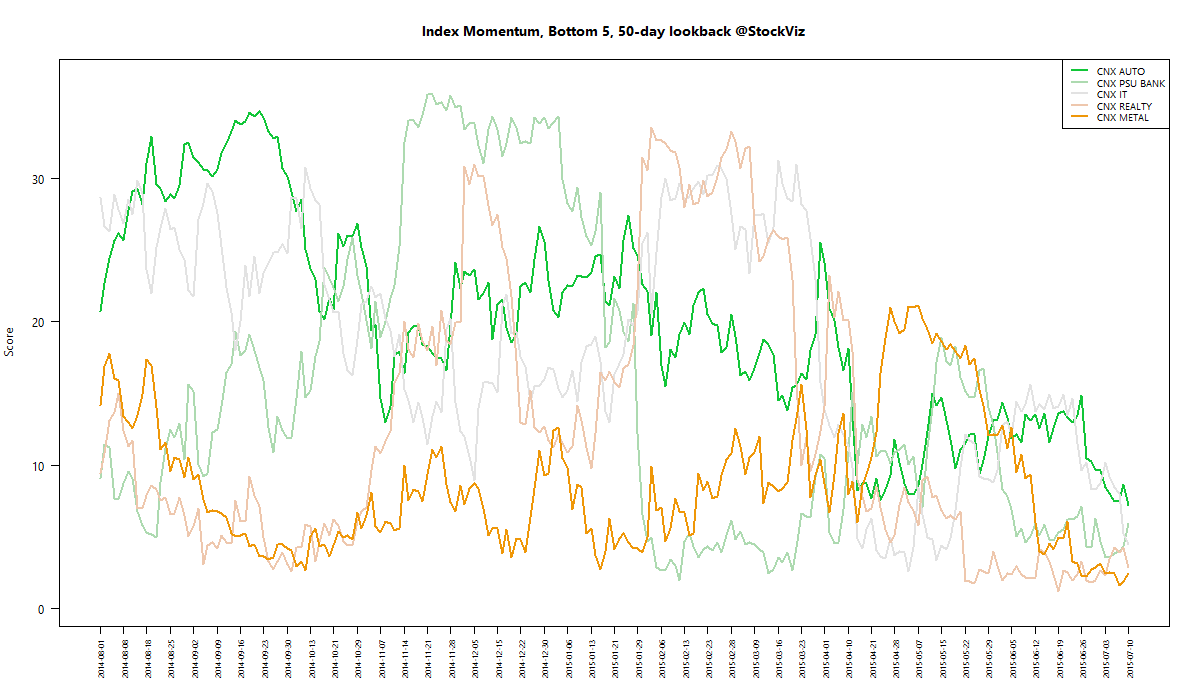
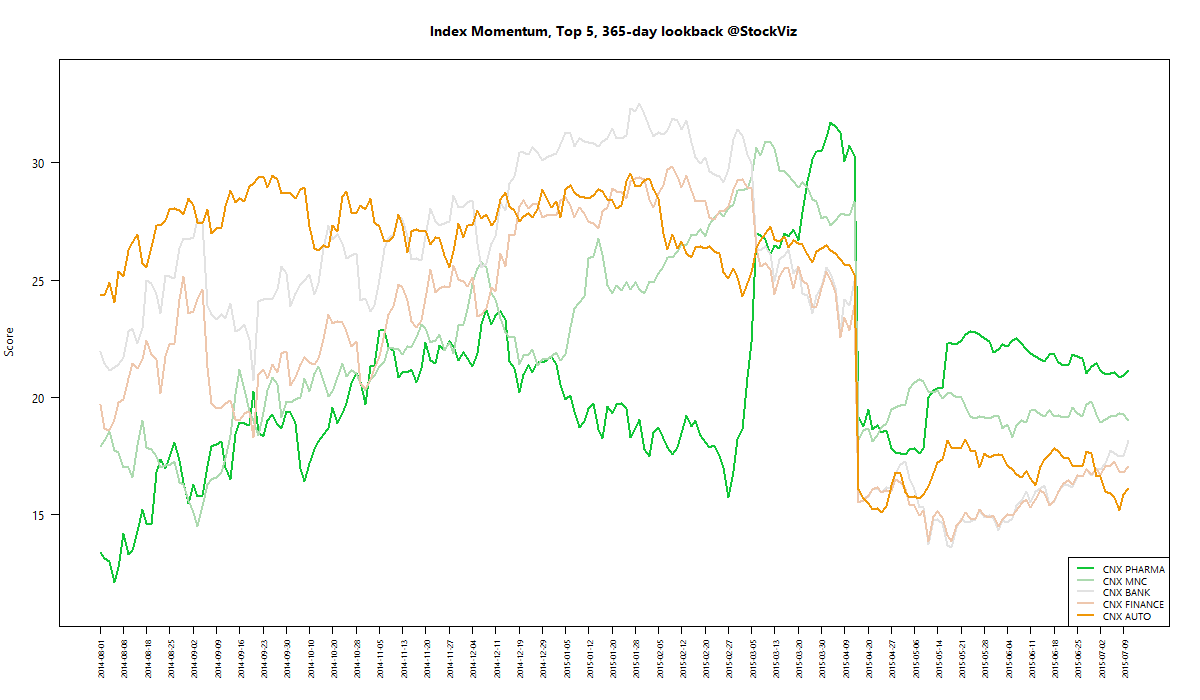
We run our proprietary momentum scoring algorithm on indices just like we do on stocks. You can use the momentum scores of sub-indices to get a sense for which sectors have the wind on their backs and those that are facing headwinds.

Traders can pick their longs in sectors with high short-term momentum and their shorts in sectors with low momentum. Investors can use the longer lookback scores to position themselves using our re-factored index Themes.

You can see how the momentum algorithm has performed on individual stocks here.

Here are the best and the worst sub-indices:
index momentum best 365 2015-07-03 png

index momentum best 50 2015-07-03 png

index momentum worst 365 2015-07-03 png

index momentum worst 50 2015-07-03 png

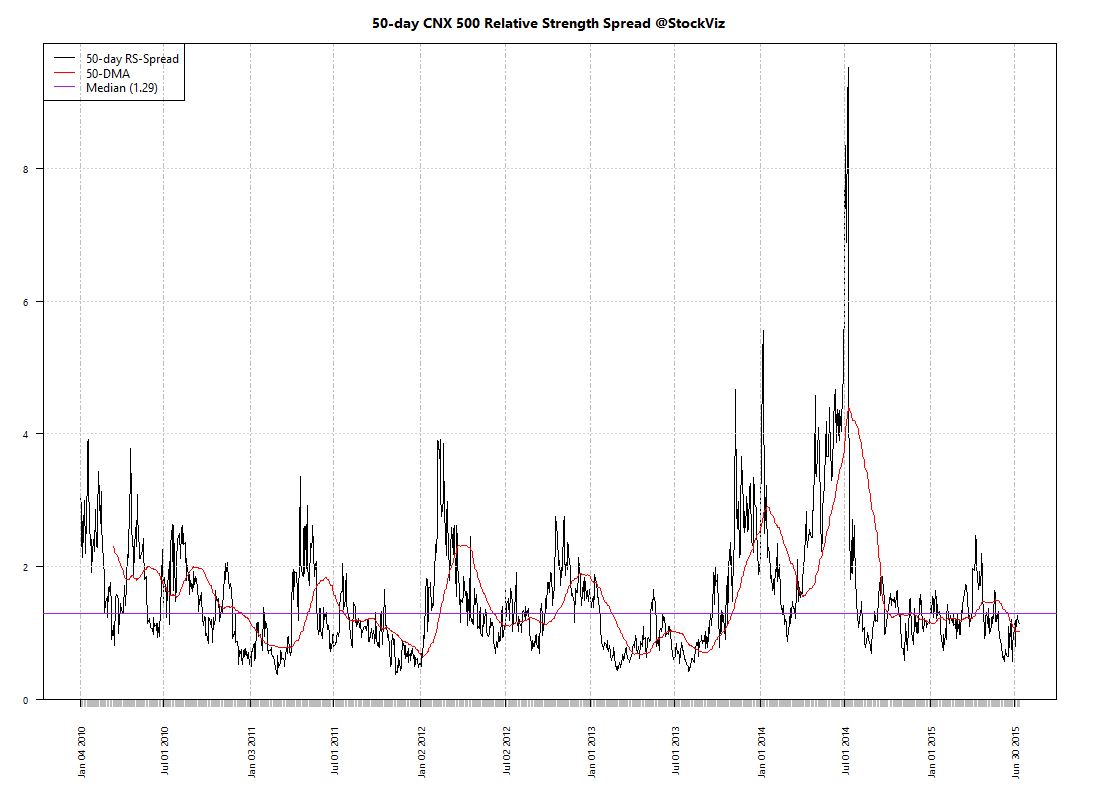
Relative Strength Spread

CNX_500 relative-spread-index 50 2015-07-03 png

Refactored Index Performance

50-day performance, from April 24, 2015 through July 03, 2015:

Trend Model Summary

Index Signal % From Peak Day of Peak
CNX AUTO SHORT
6.66
2015-Jan-27
CNX BANK SHORT
8.88
2015-Jan-27
CNX ENERGY SHORT
25.33
2008-Jan-14
CNX FMCG LONG
9.20
2015-Feb-25
CNX INFRA LONG
46.95
2008-Jan-09
CNX IT LONG
88.27
2000-Feb-21
CNX MEDIA LONG
23.15
2008-Jan-04
CNX METAL LONG
58.71
2008-Jan-04
CNX MNC LONG
1.66
2015-Mar-12
CNX NIFTY SHORT
5.68
2015-Mar-03
CNX PHARMA LONG
11.32
2015-Apr-08
CNX PSE LONG
23.84
2008-Jan-04
CNX REALTY SHORT
90.35
2008-Jan-14
50-day performance turns green for most indices and the MNCs have more or less covered their draw-downs. Looks like financials and FMCG have found their mojo. Will the markets keep their trend?

Correlation Update 04.07.2015

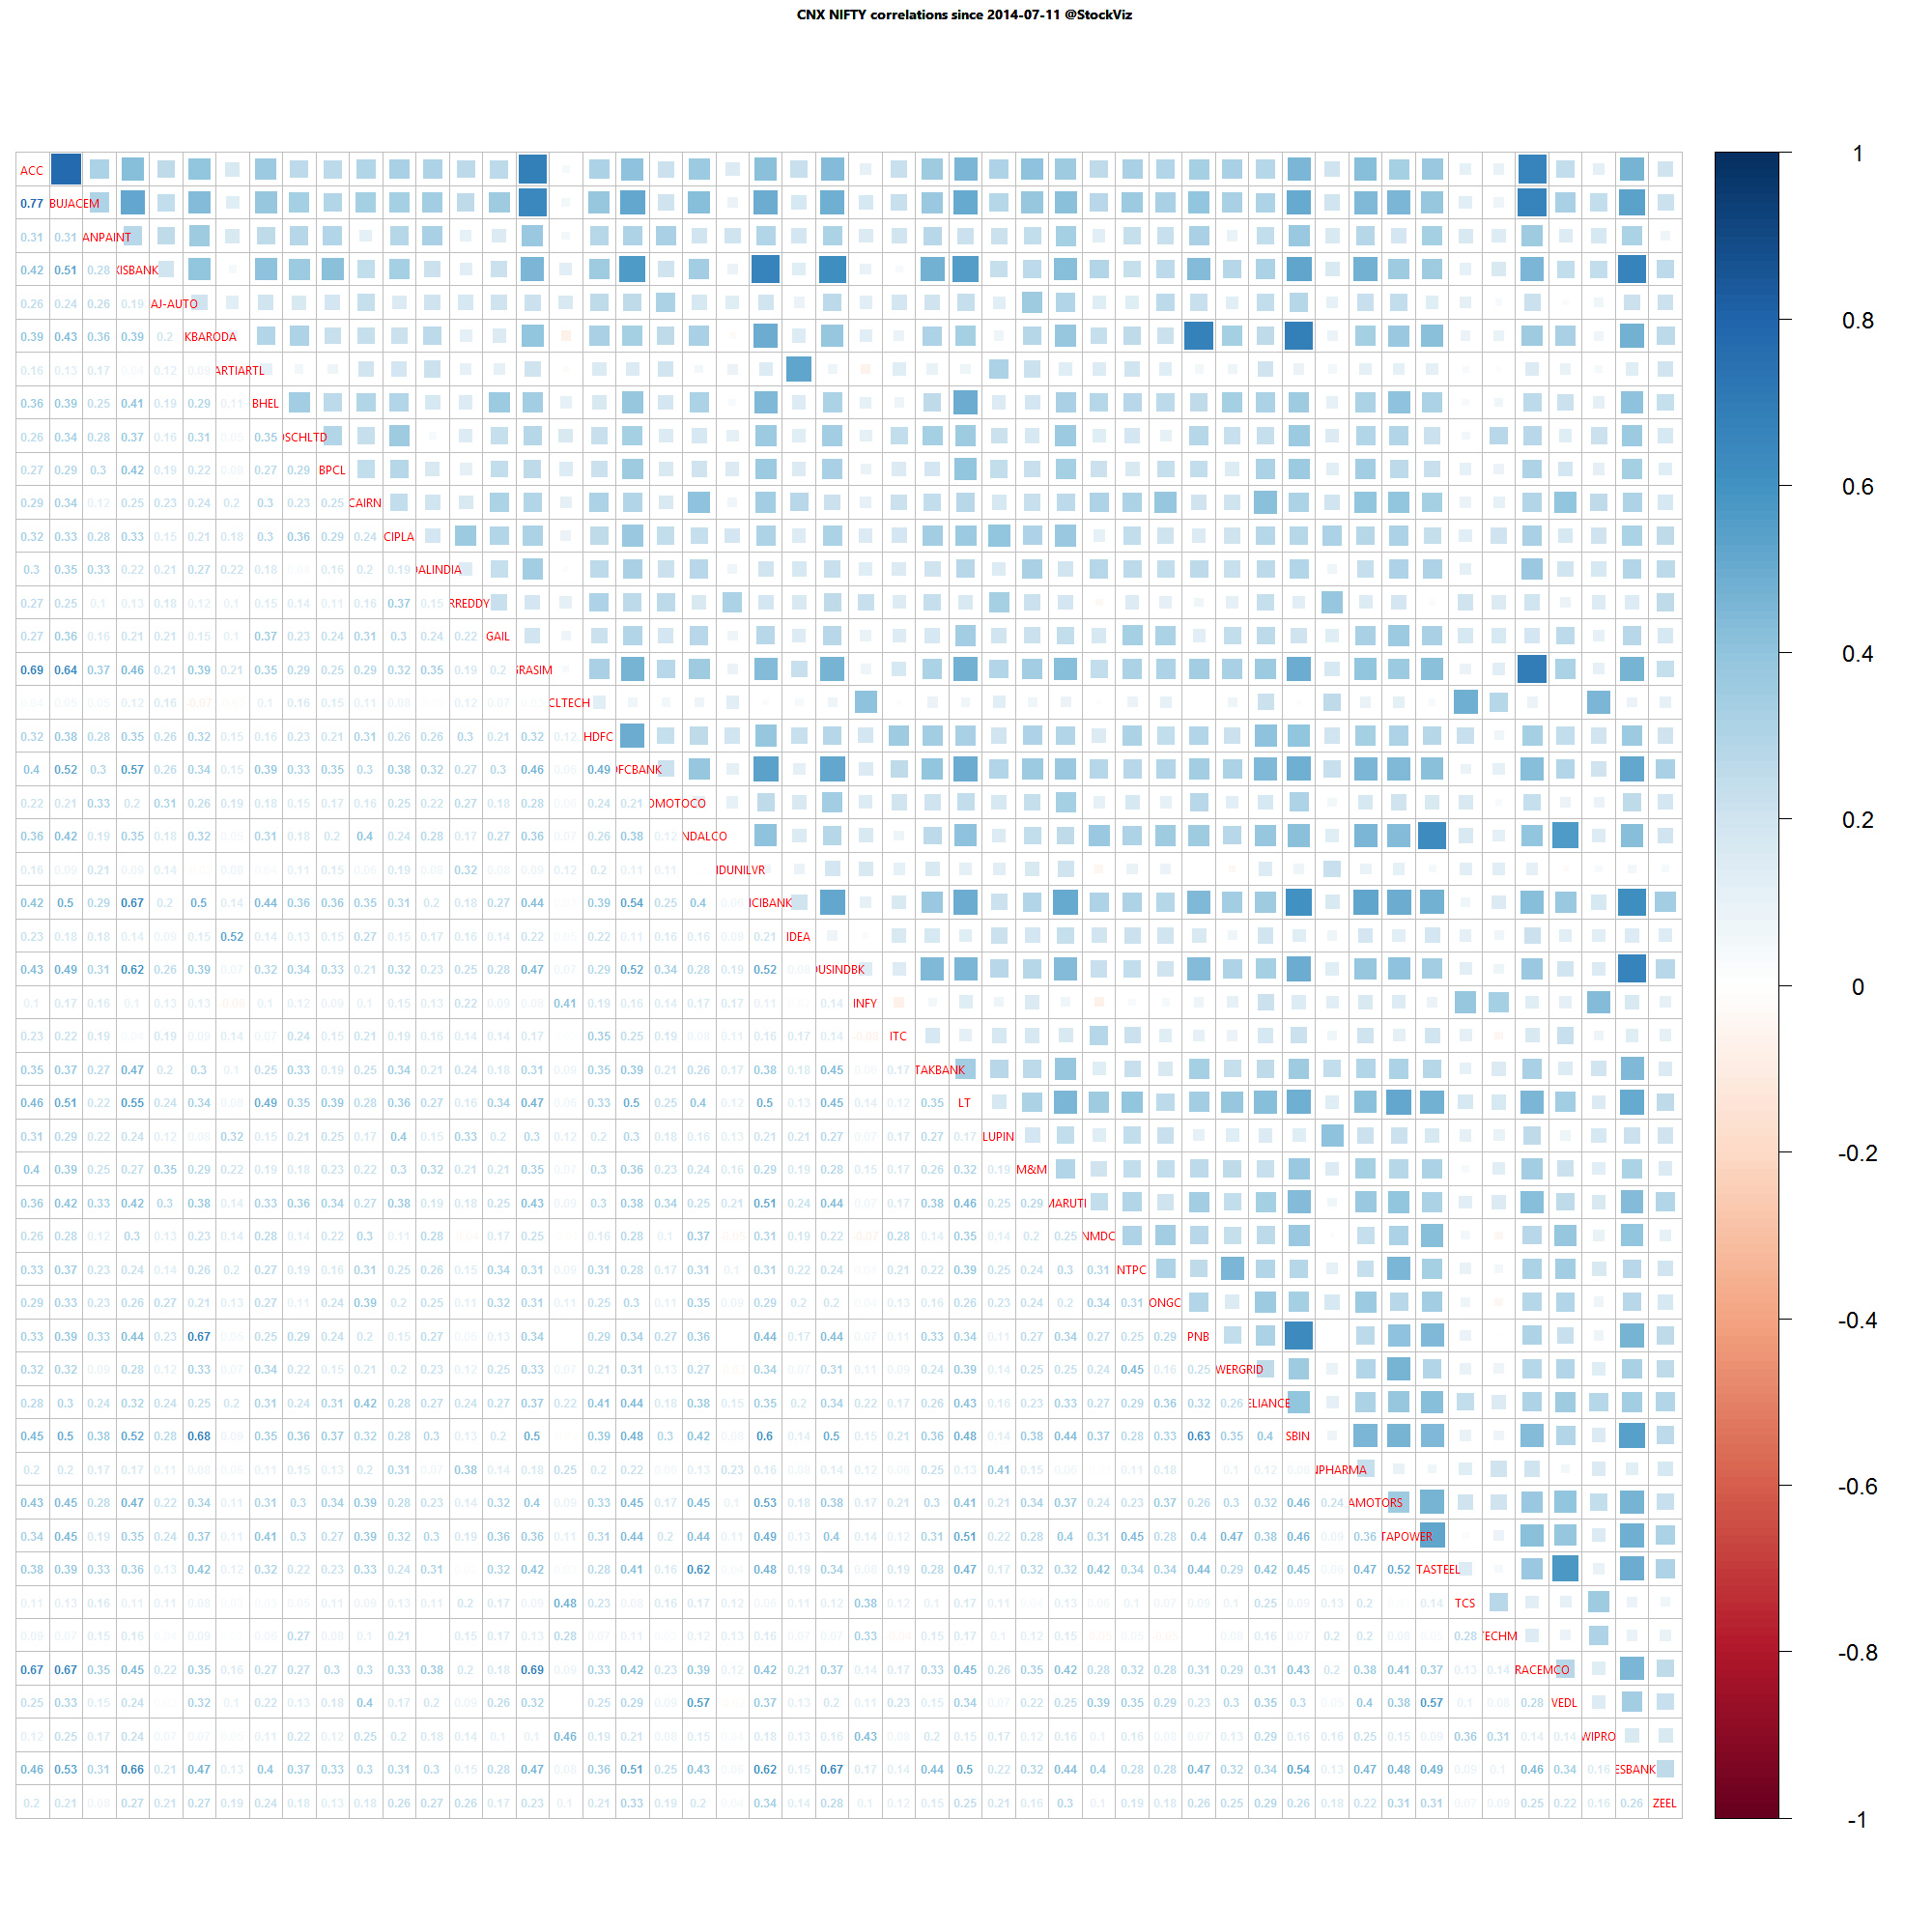
Nifty one year daily return correlations

Nifty one year daily return correlations

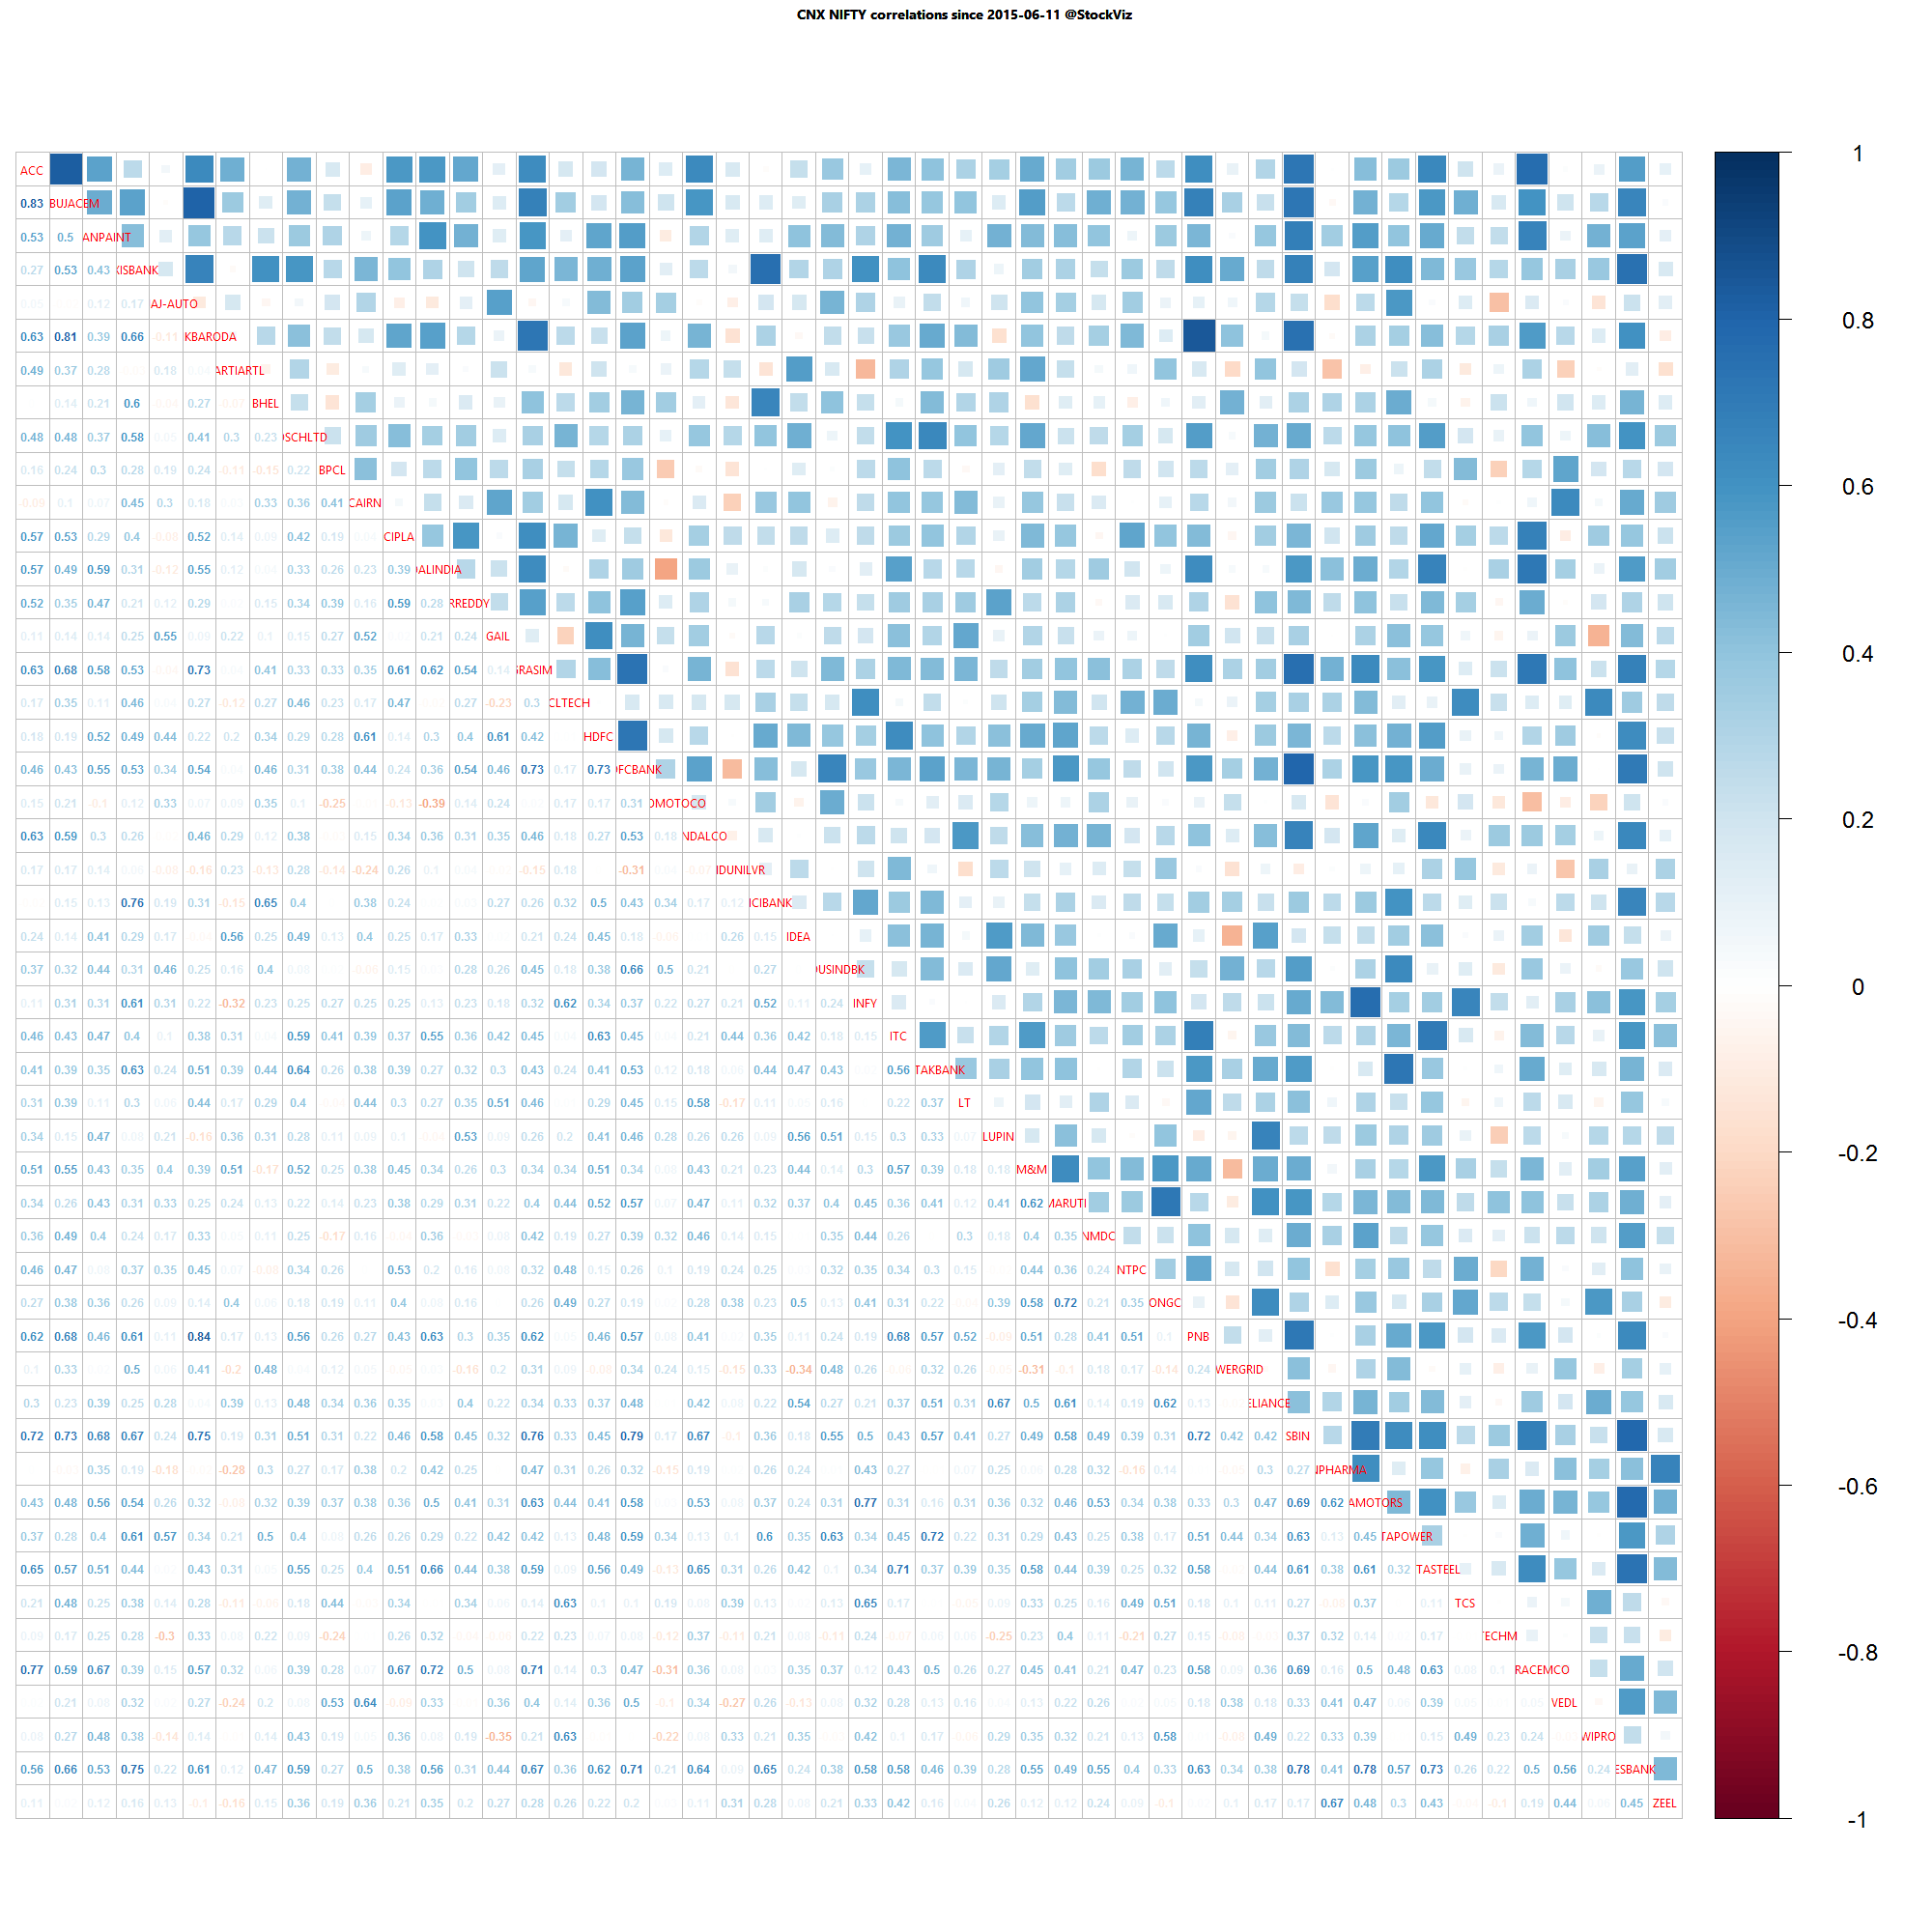
Nifty one month daily return correlations

Nifty one month daily return correlations

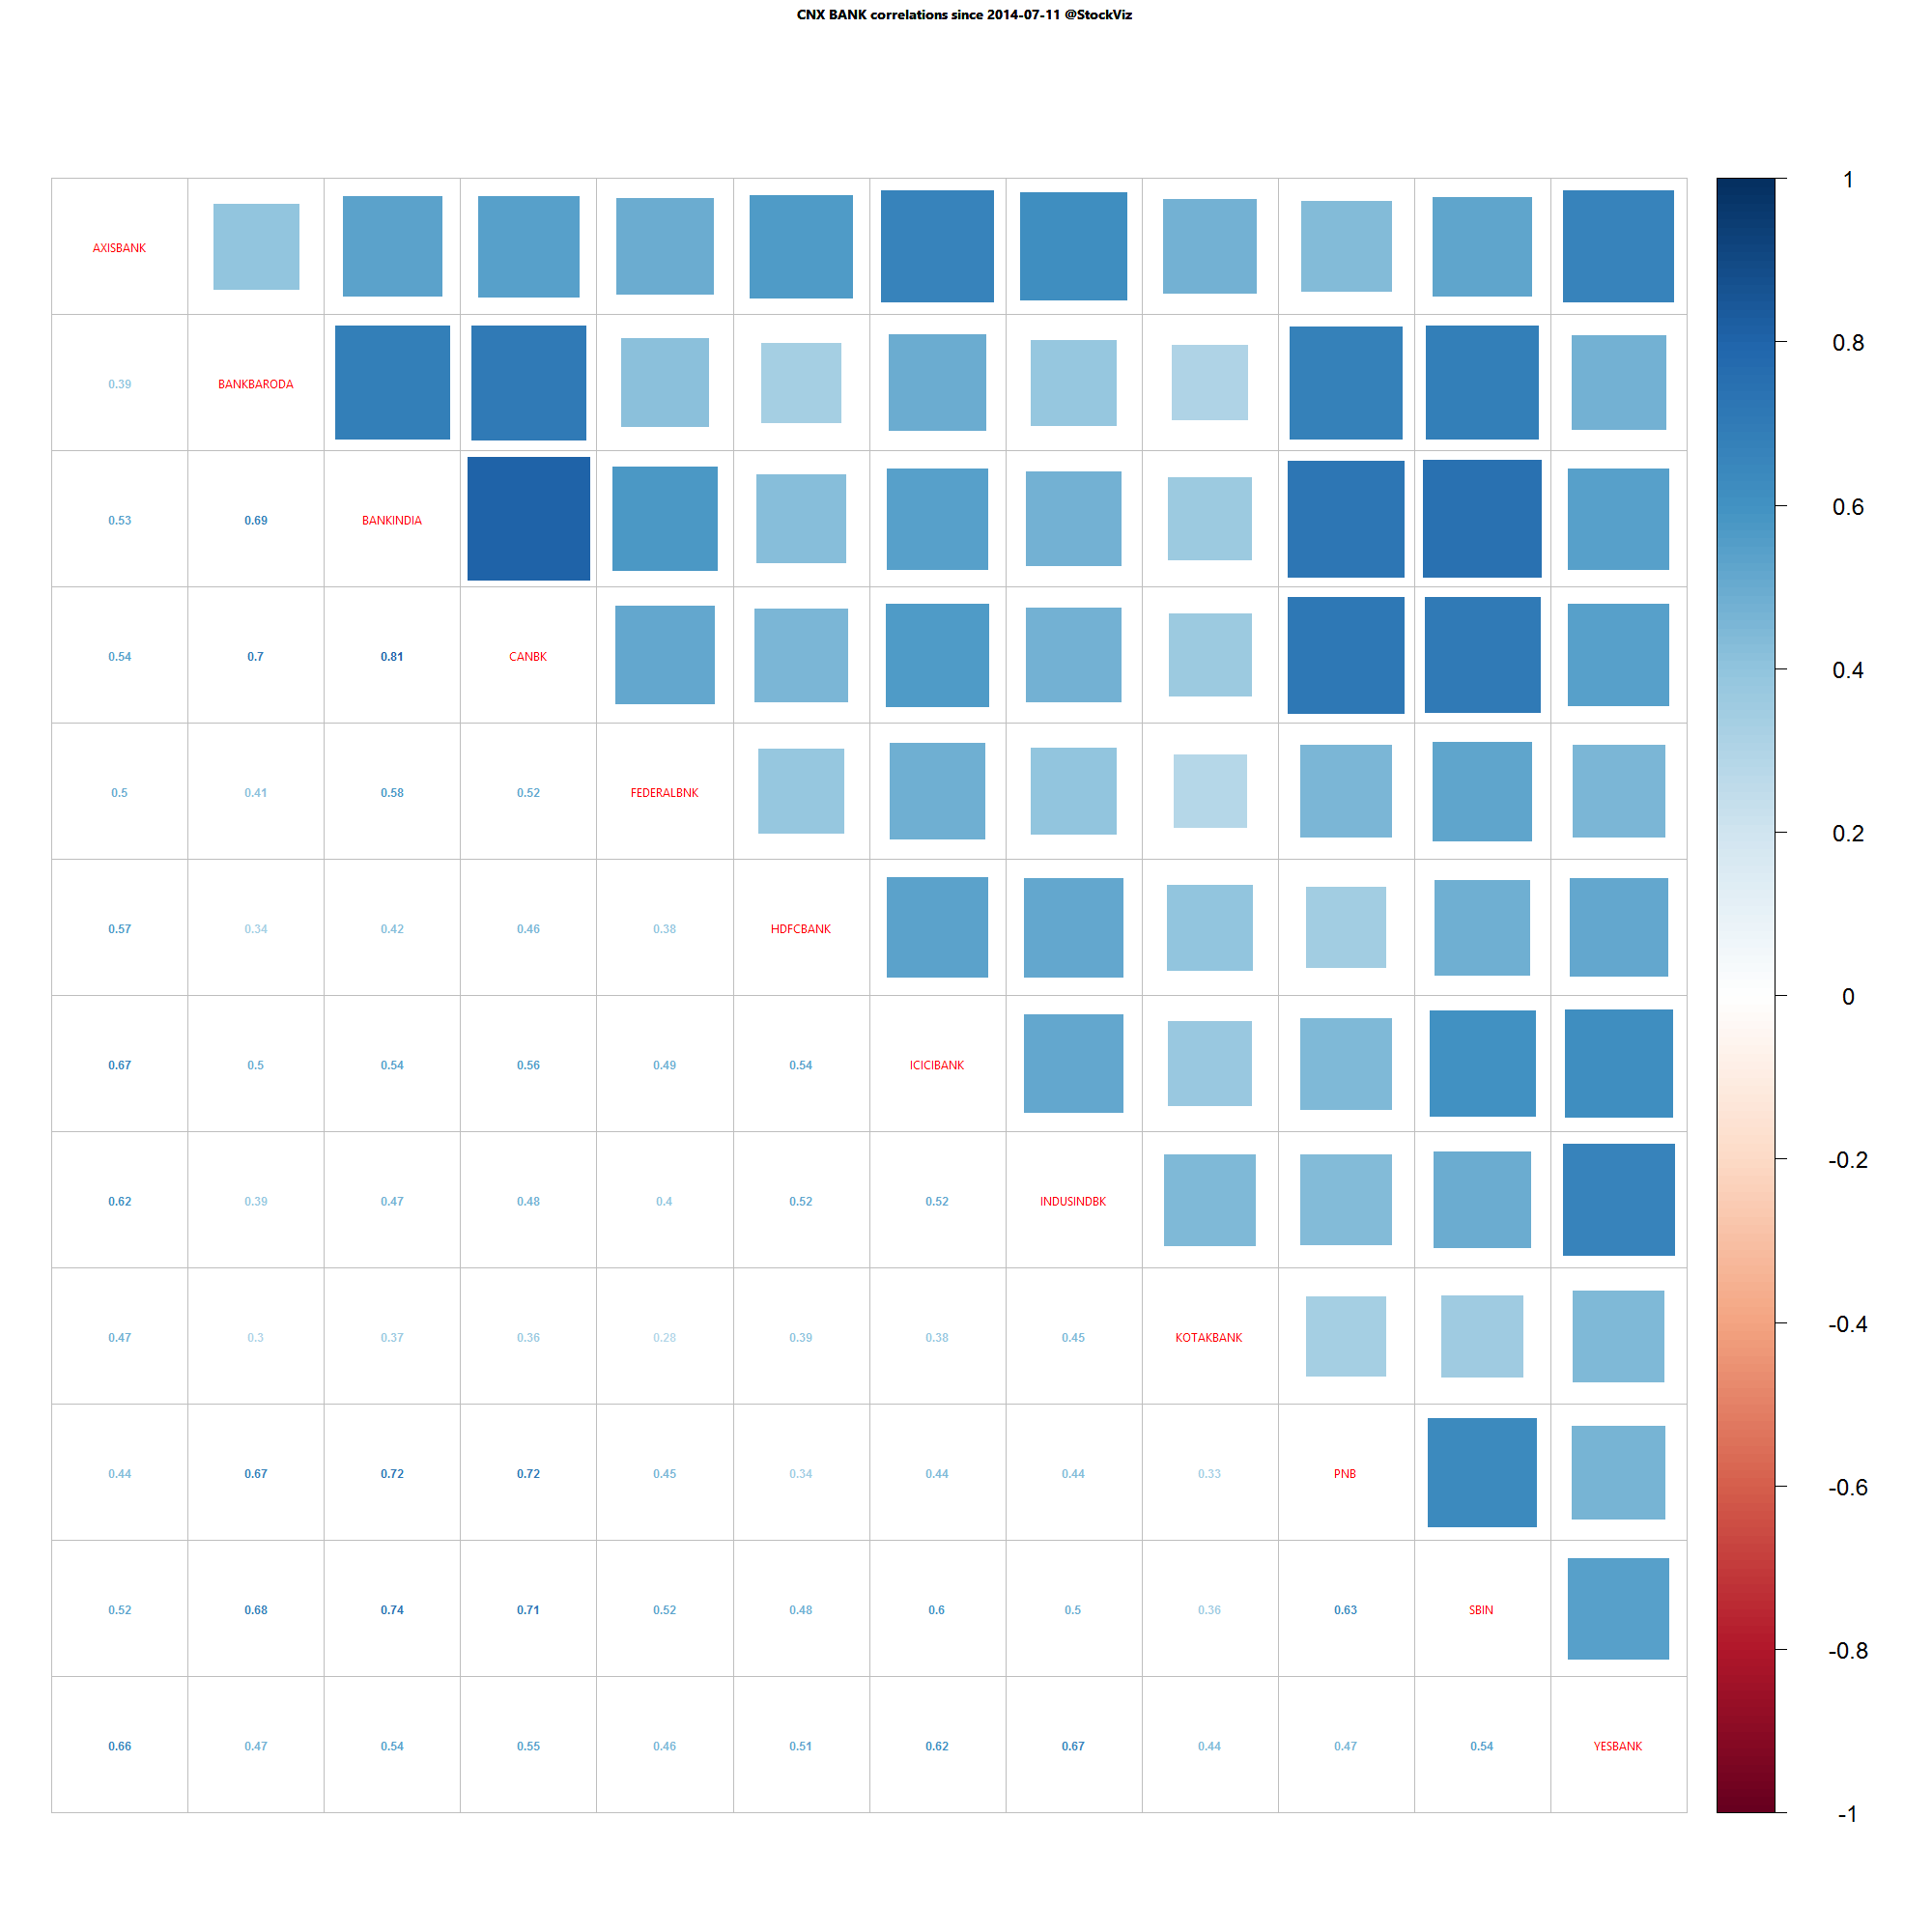
Bank Nifty one year daily return correlations

Bank Nifty one year daily return correlations

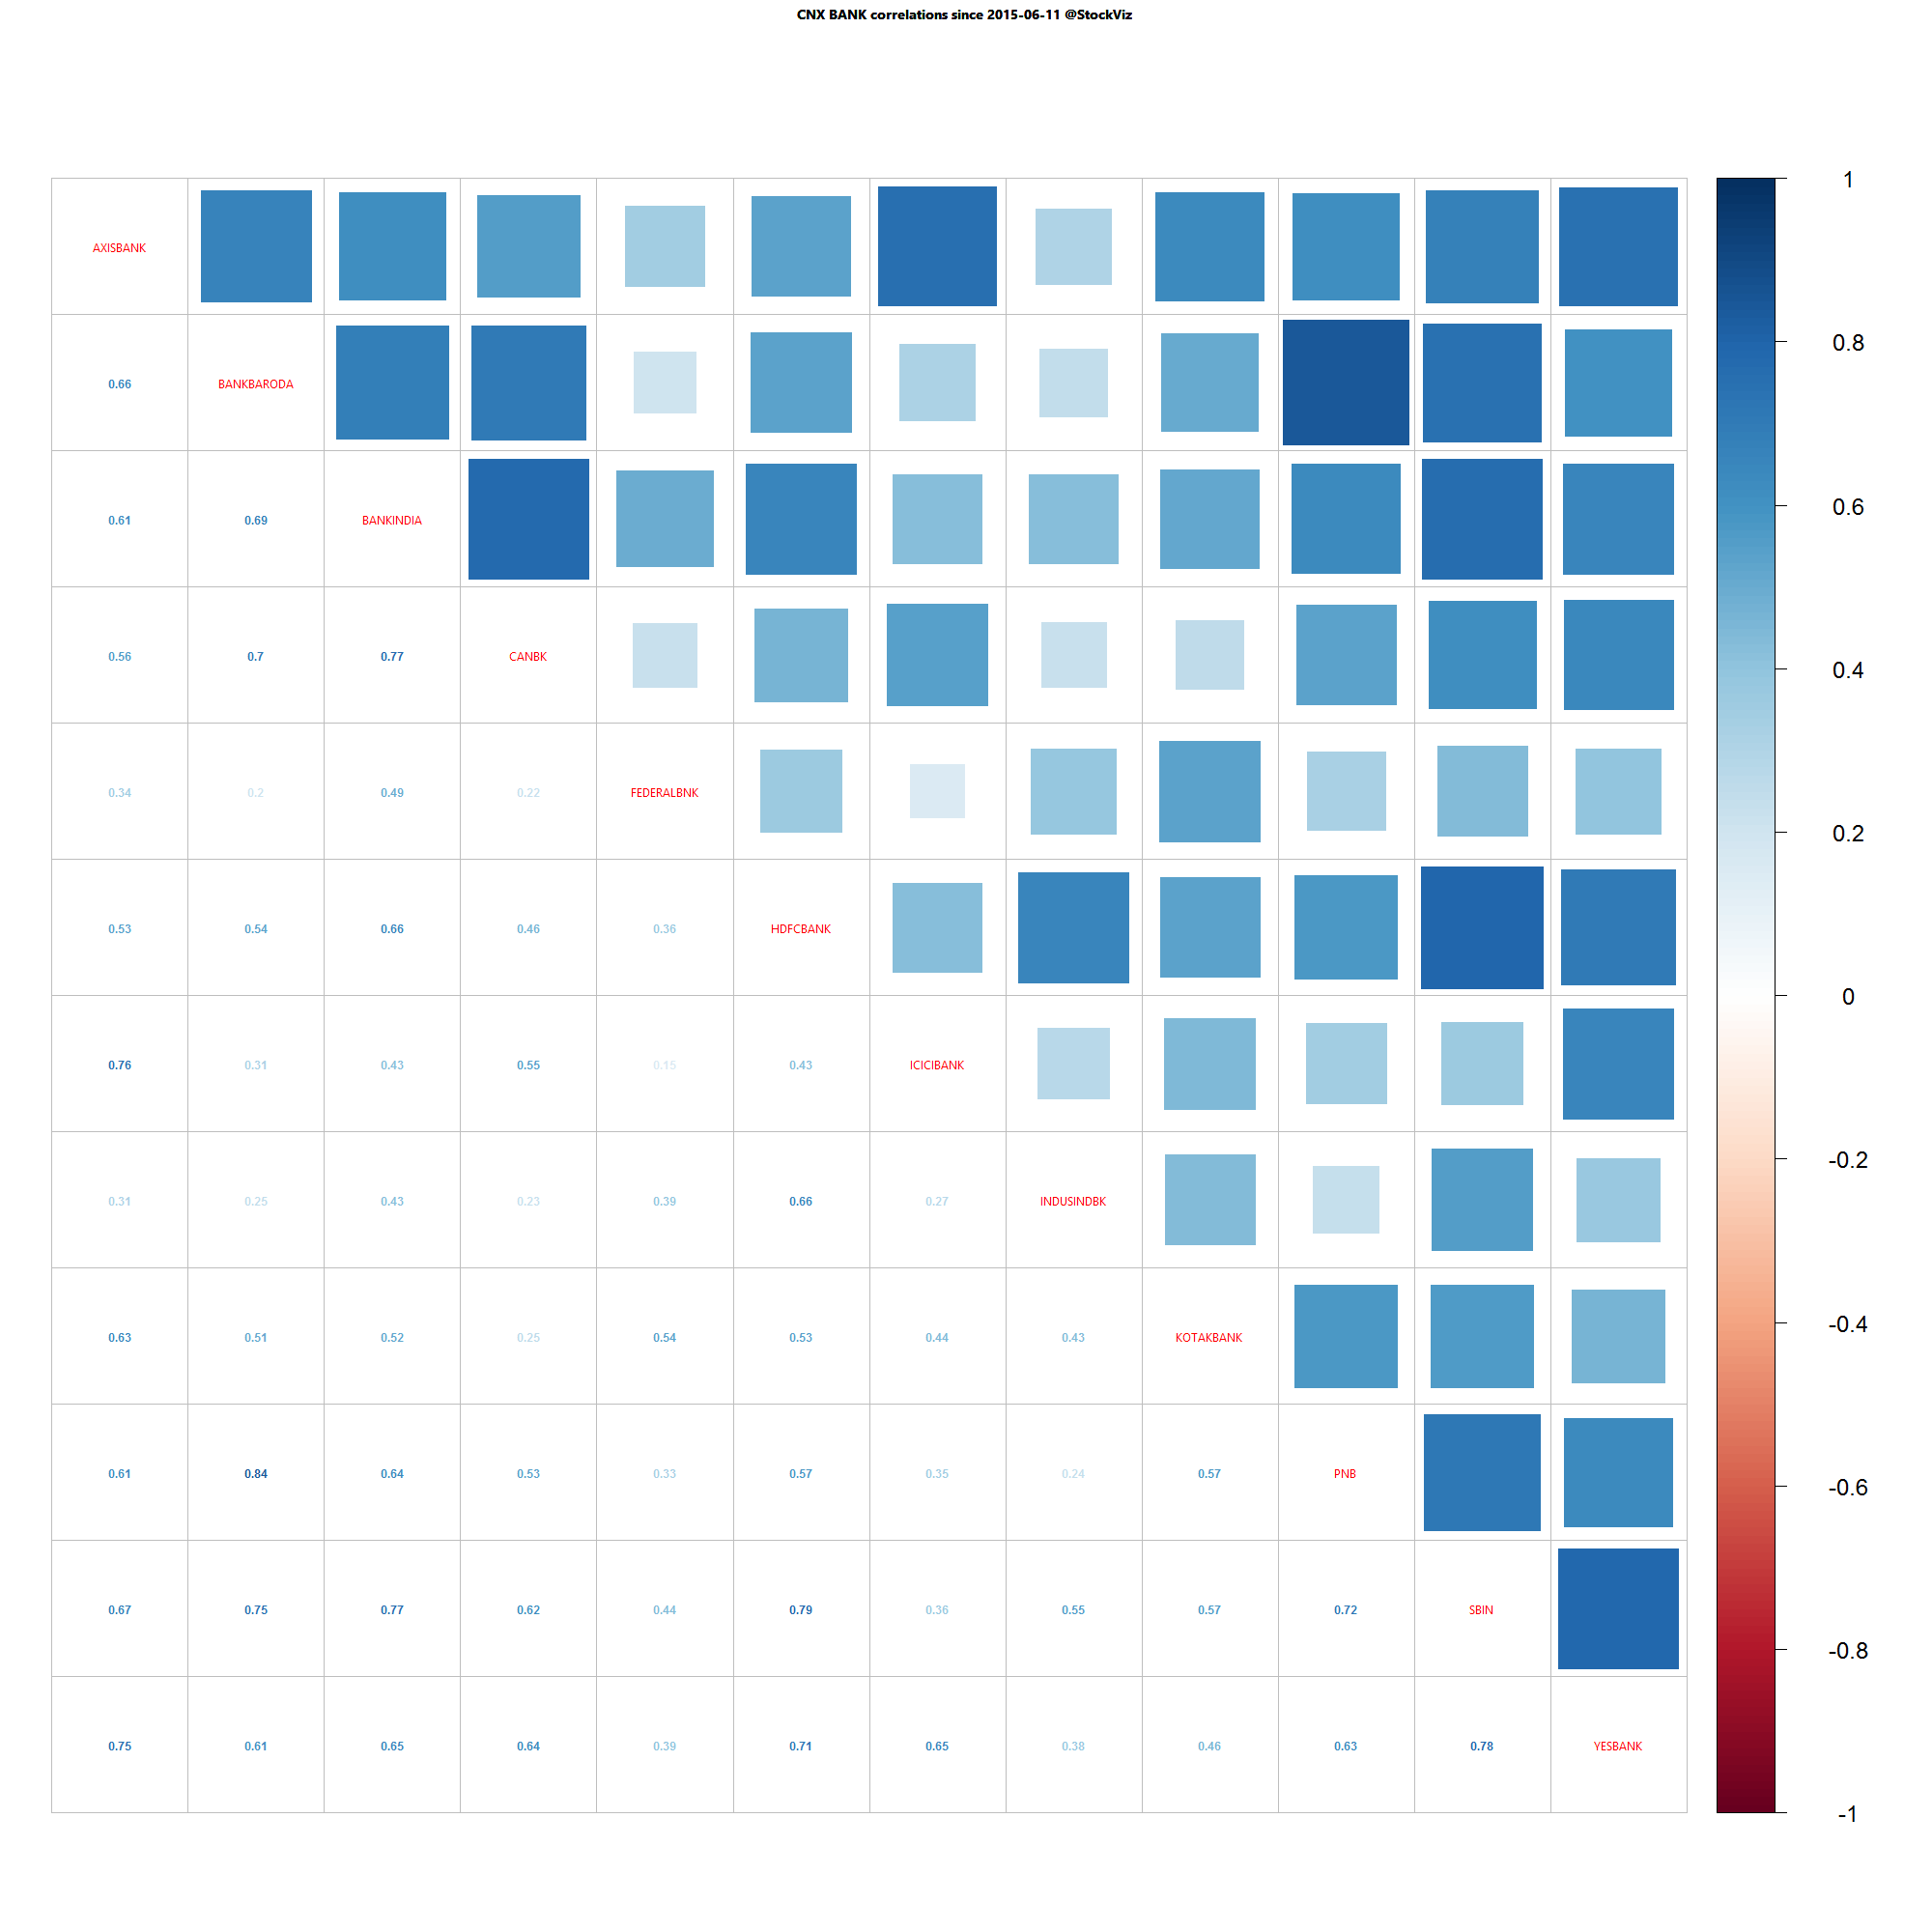
Bank Nifty one month daily return correlations

Bank Nifty one month daily return correlations

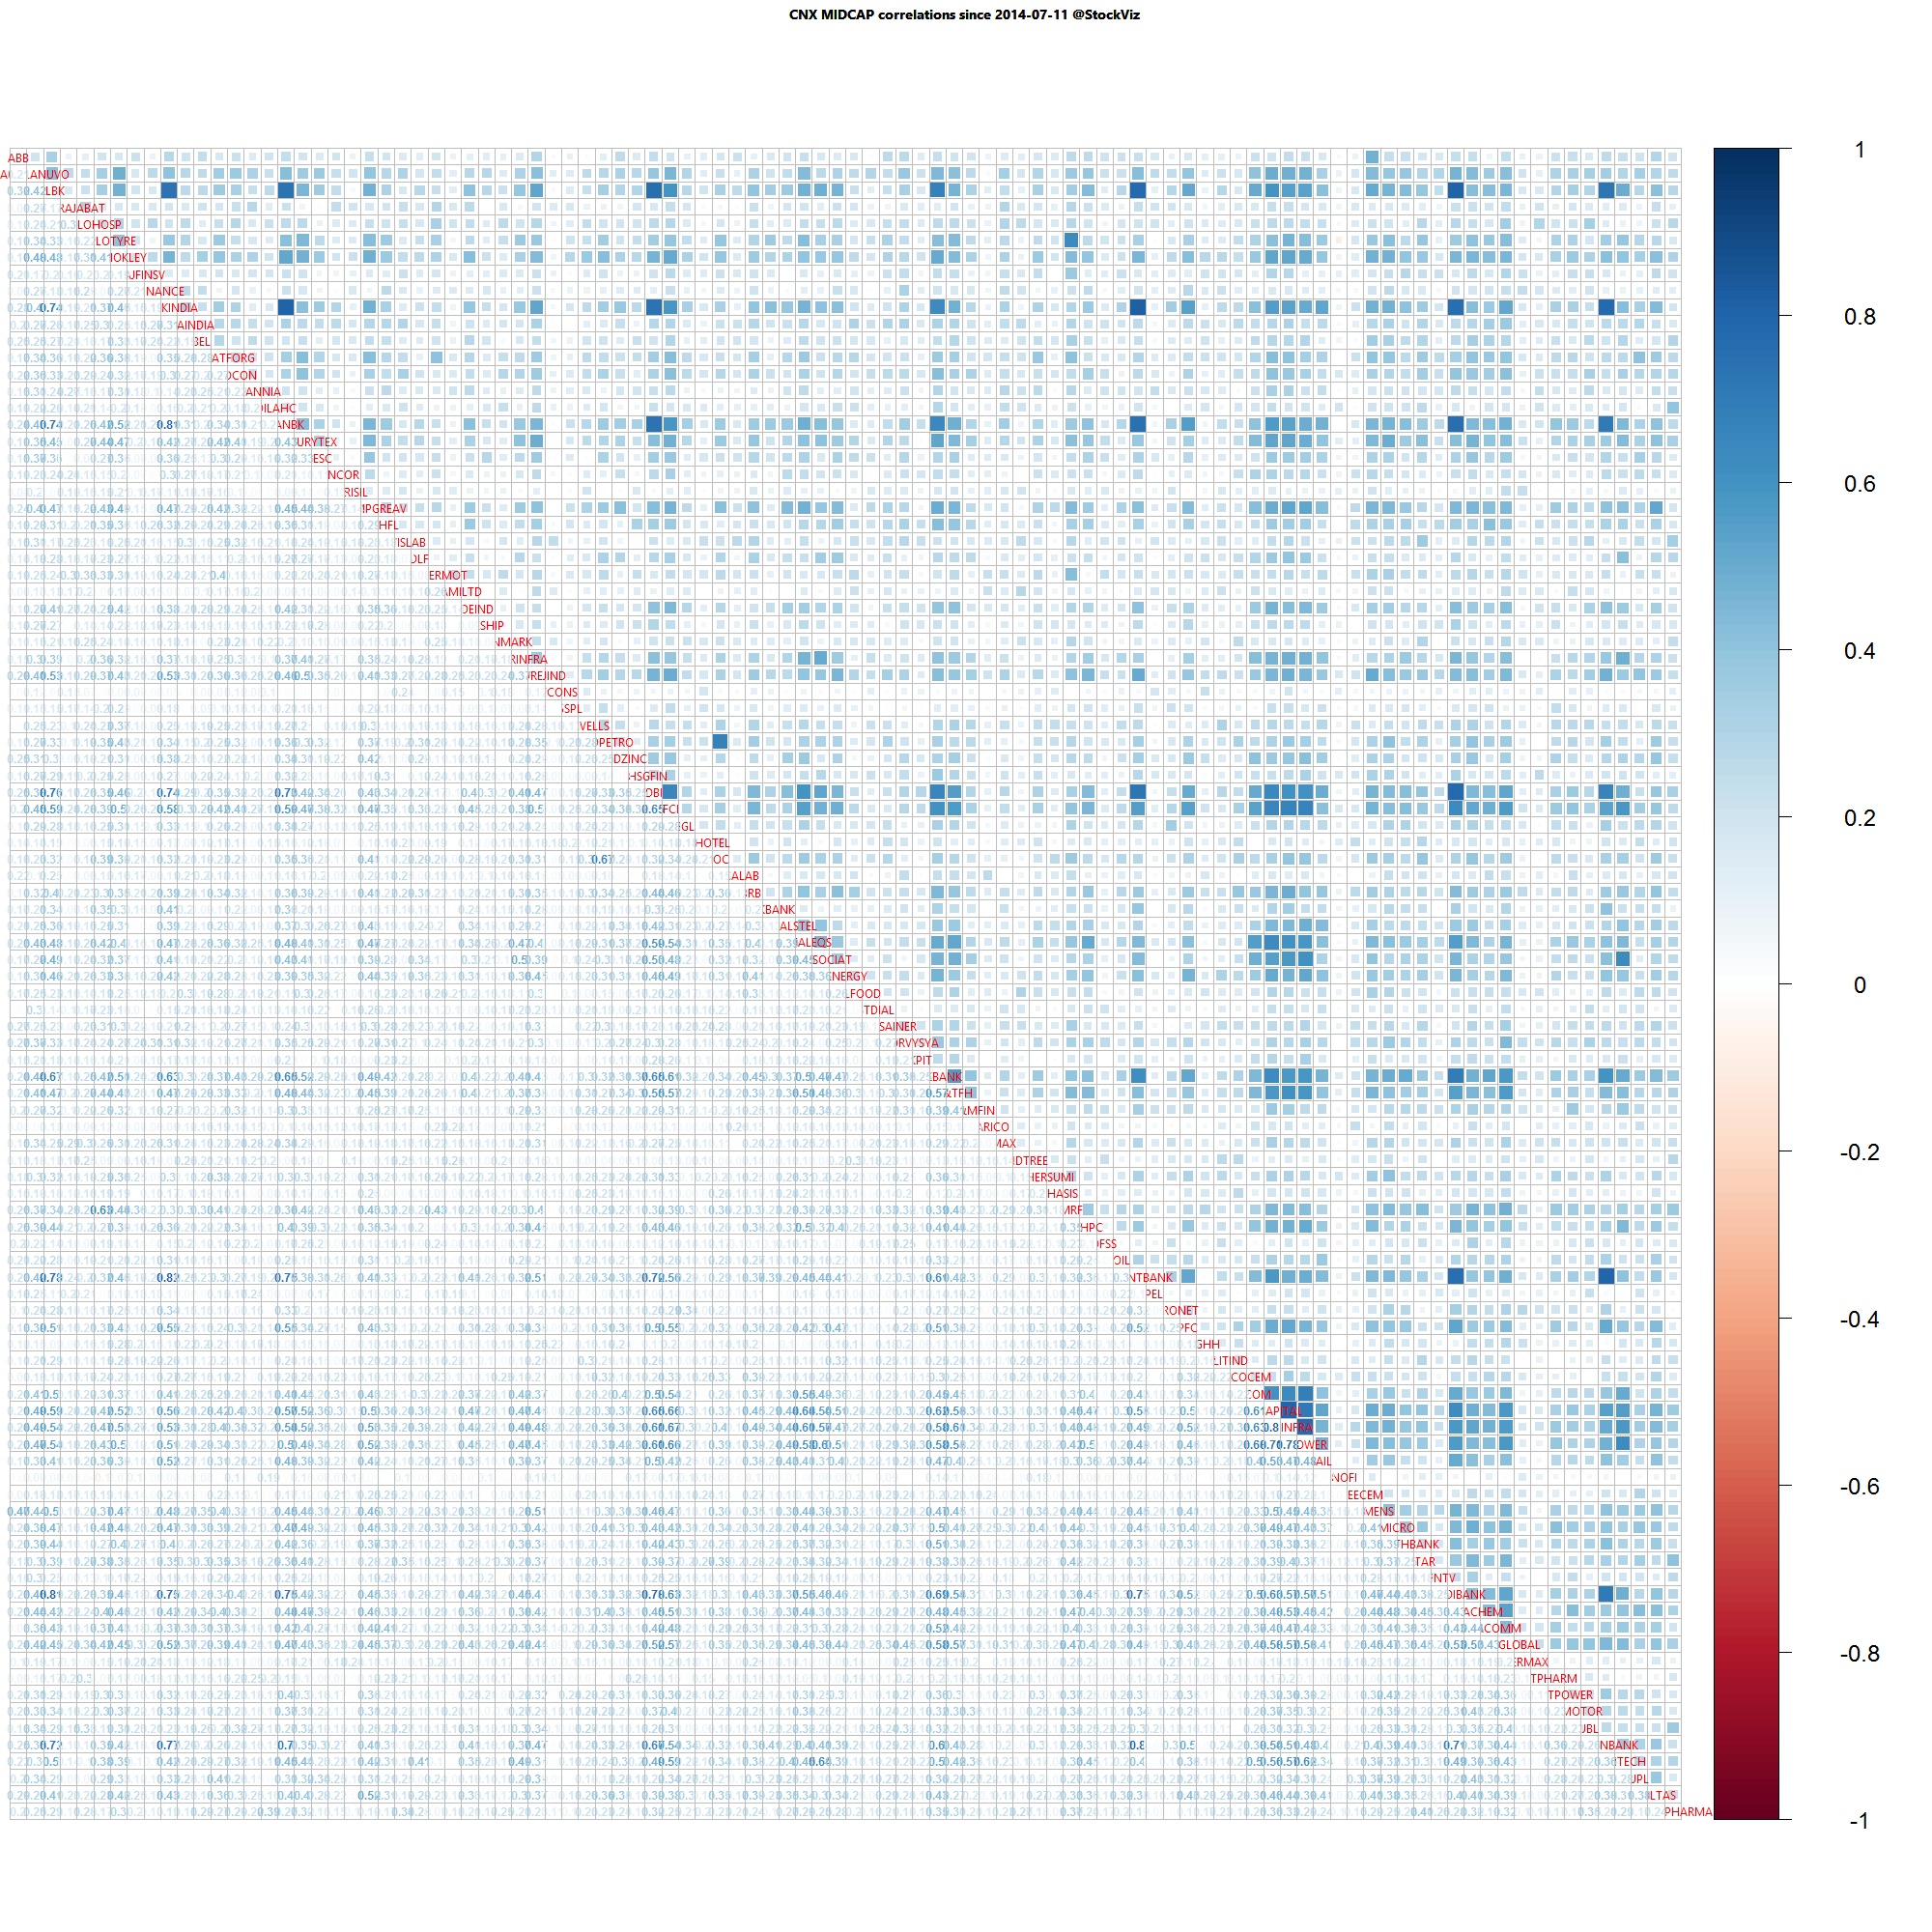
Midcap one year daily return correlations

Midcap one year daily return correlations

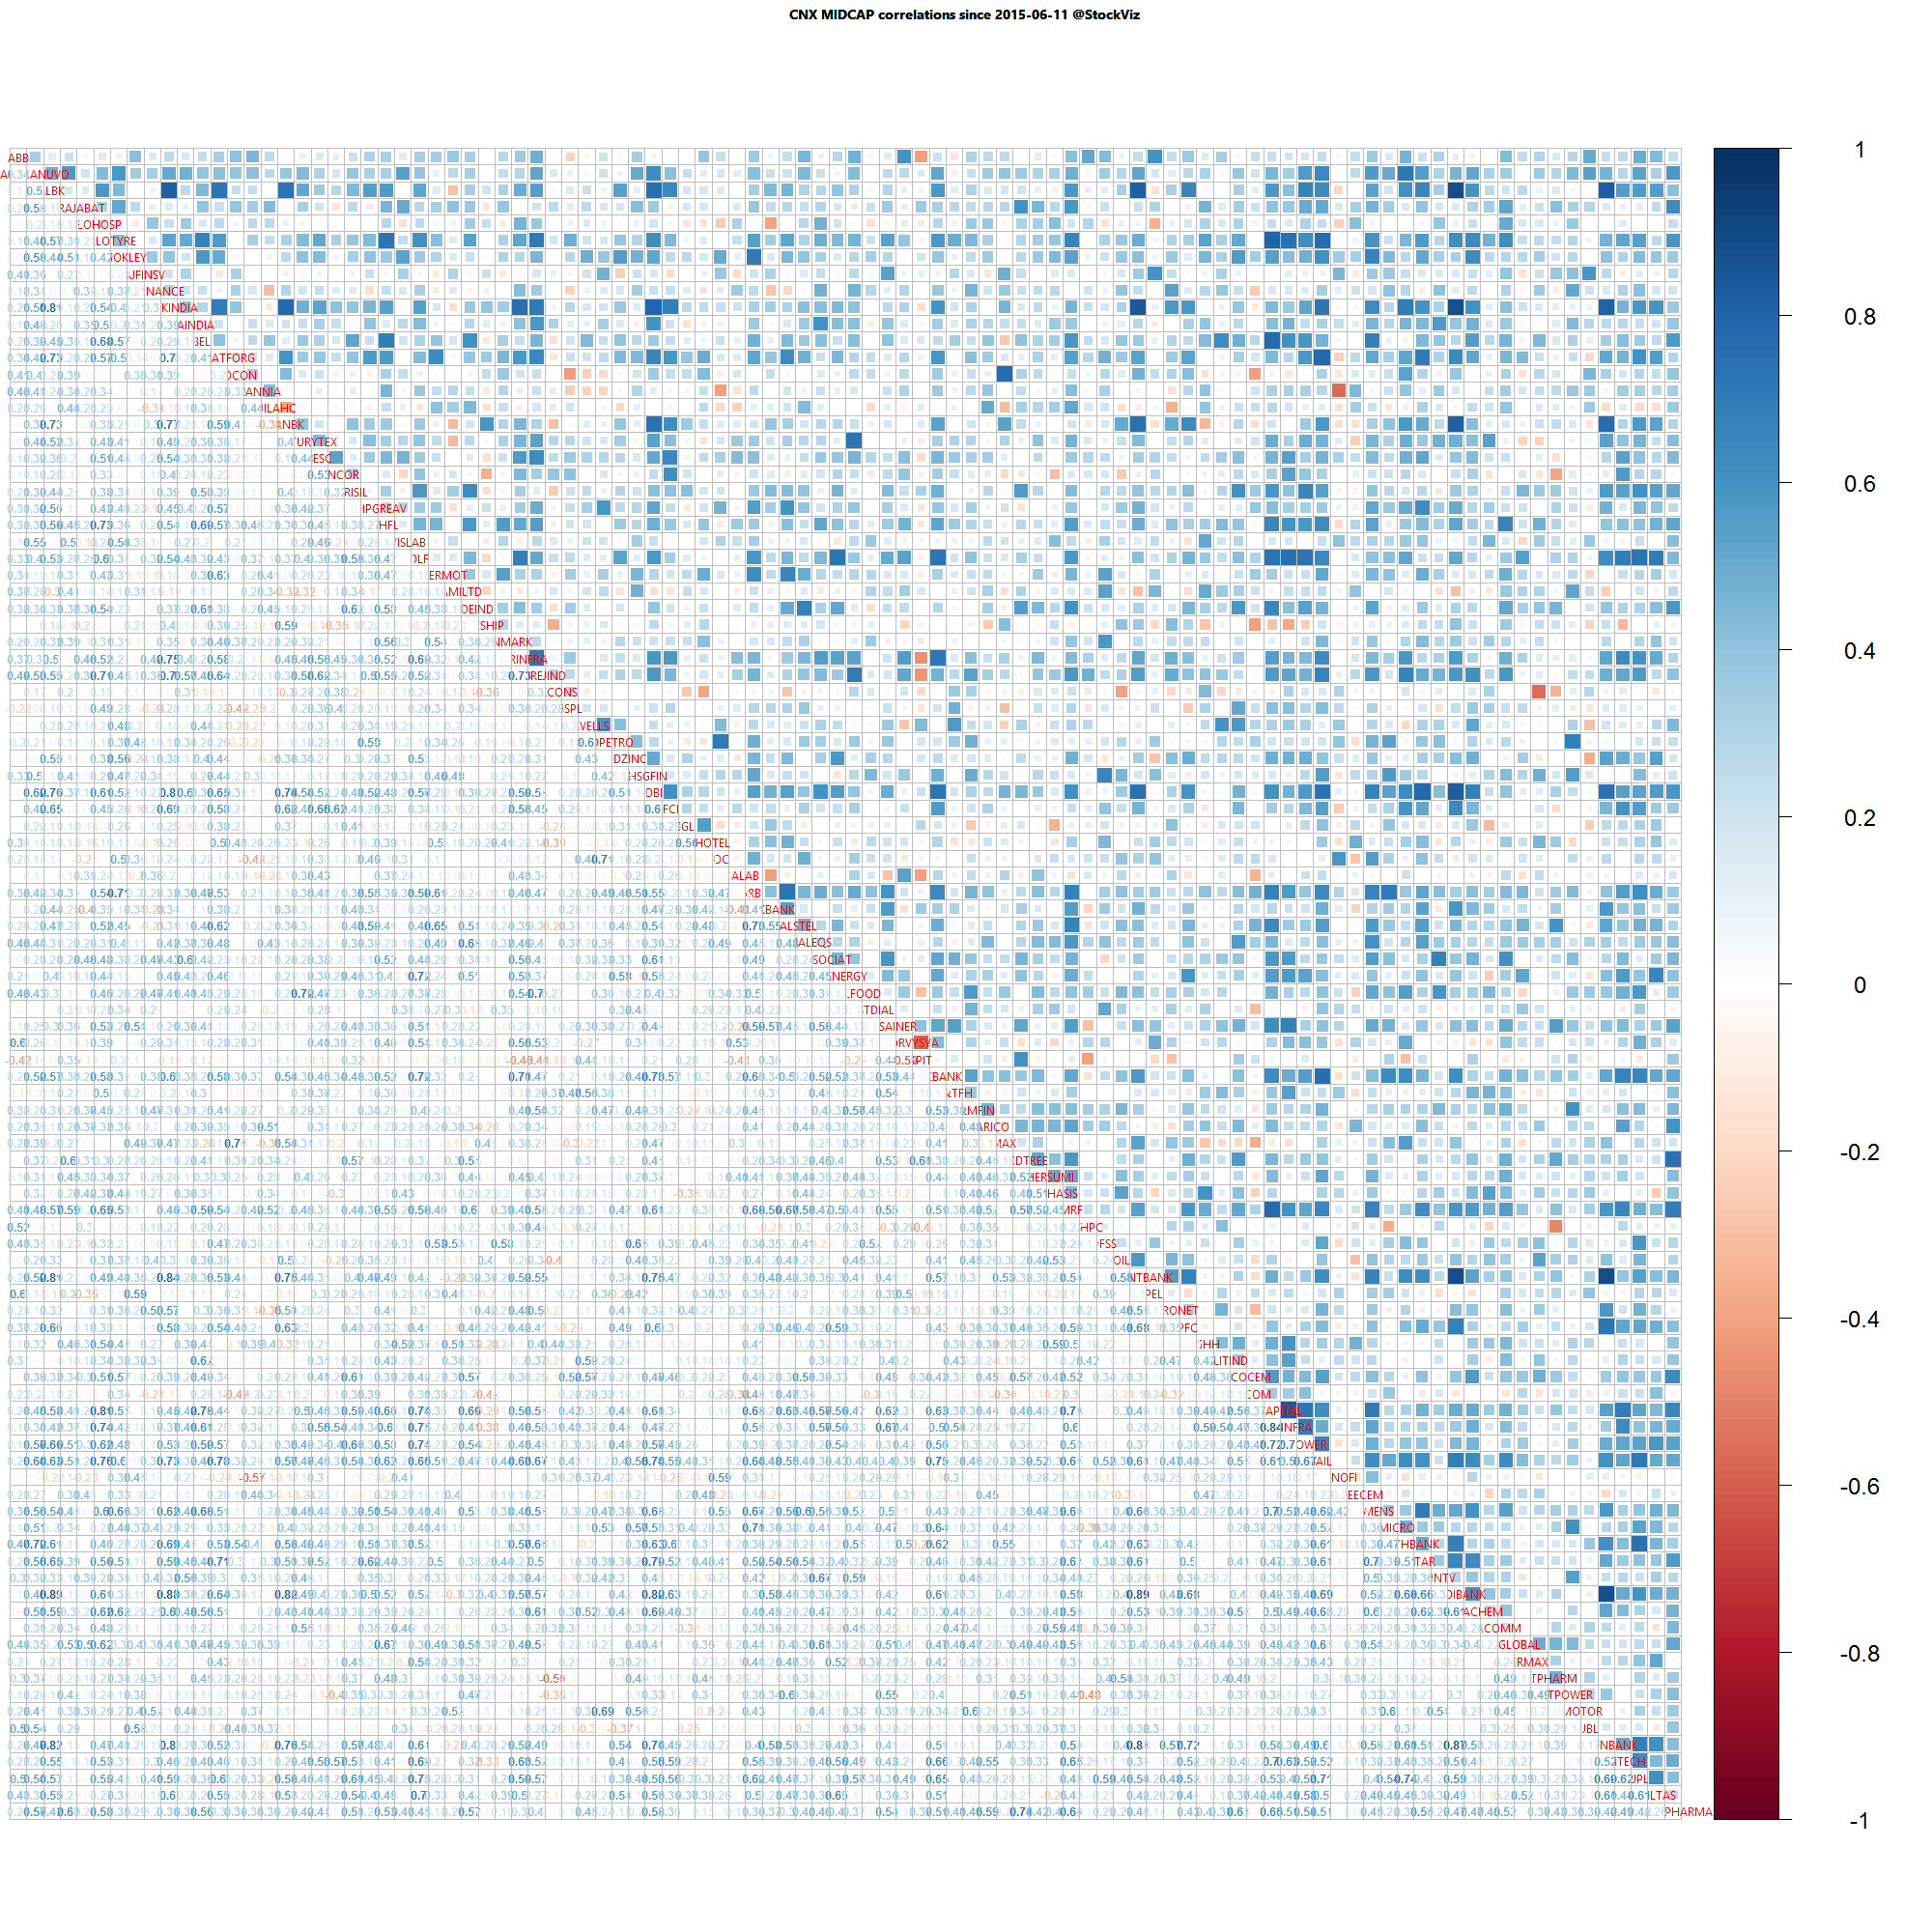
Midcap one month daily return correlations

Midcap one month daily return correlations

A lot of thick blue squares mean that positive correlations are high. Red squares mean negative correlations are high. Whites are the doldrums.

Implied Volatility around Earnings Announcements

Introduction

There is a common belief that option implied volatility, which is high before earnings announcements, quickly dissipates after the event. So sell options before the event to profit from the fall in IV. We decided to put this theory to test by observing at-the-money IVs 5-days before earnings announcements and their subsequent behavior.

It is not what you expect.

ATM IVs

Here are the at-the-money implied vols 5-days before and the day after announcements:

atm iv announcement

In our study, IV falls only 44% of the time. So the blanket statement fails. IV dissipation is not guaranteed. There are a lot of other things that affect IV and earnings alone is not sufficient to predict the outcome.

However, if the IV was more the 50, then IV dissipates 70% of the time. However, these odds could be similar to those without earnings announcements as well (all things equal.) So further research is required.

Conclusion

Don’t go around selling options thinking that IV will dissipate after earnings announcements. Know your odds.

Macro Update June 2015

US TREASURIES VS. GILT SPREAD

The spread between 10yr US Treasuries and Indian Gilts remained within a tight range this month.

ust-ind-10yr-spread.2011-01-18

Long-term bond yields continued their ascent:

ust-yield-curve.2015-06-01

INSTITUTIONAL INVESTMENTS

FIIs came back to the debt market but took money out of equities…

fii-investments.2014-01-01.2015-06-30

… while DIIs gulped down debt as well.

dii-investments.2014-01-01.2015-06-30

Oil

Oil futures remained flat.

wti-brent.2011-01-18

Gold

If all the uncertainties cannot move gold up, I am not sure what will.

gold.usd

Copper

After a brief period of enthusiasm, it looks like copper has given up on industrial growth again.

copper.usd

Dollar Index

Looks like the dollar index (DXY) has found a range.

Outlook

Although the Indian markets have shrugged off Grexit for now, nobody really knows the extent to which the contagion can spread. It’s basically a known unknown at this point.

With the monsoon expected to be normal and earnings to begin in earnest only by the end of July, the first couple of weeks of July is going to be driven by optimism.