Category: Your Money

Weekly Recap: Inevitablilty

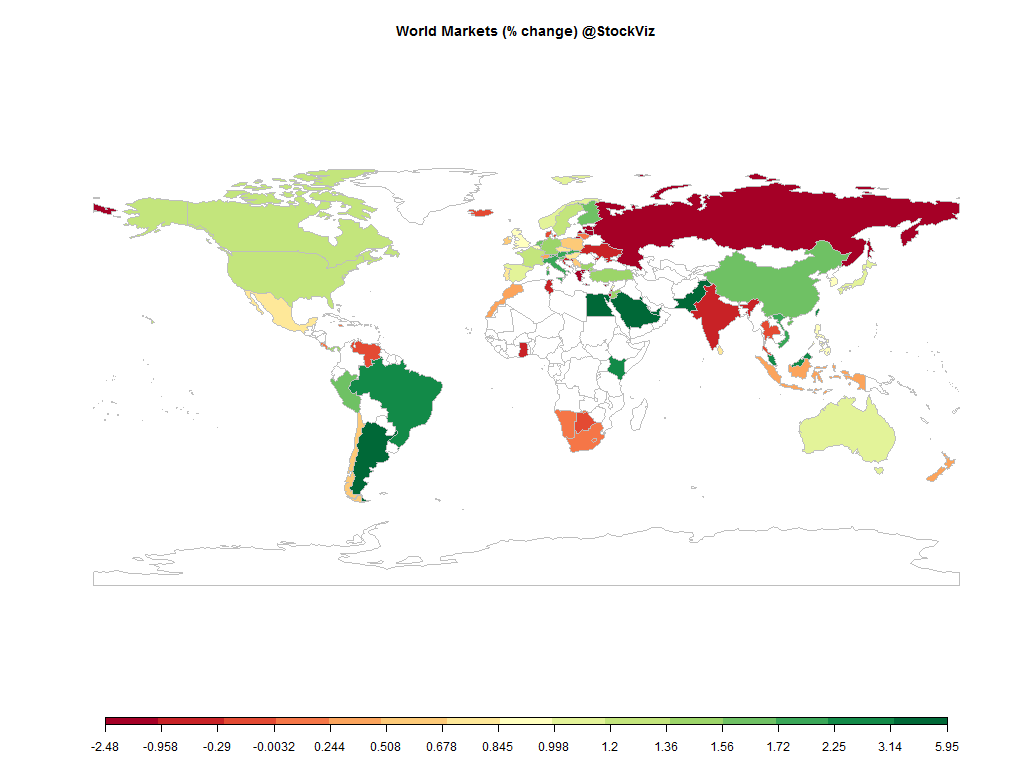
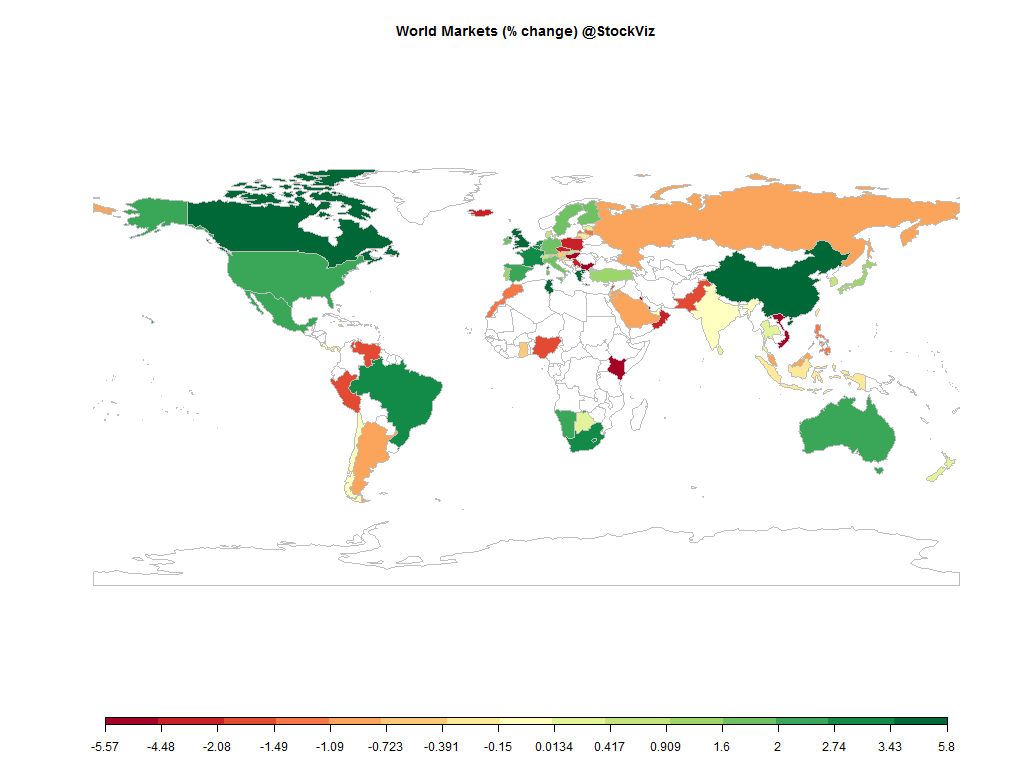
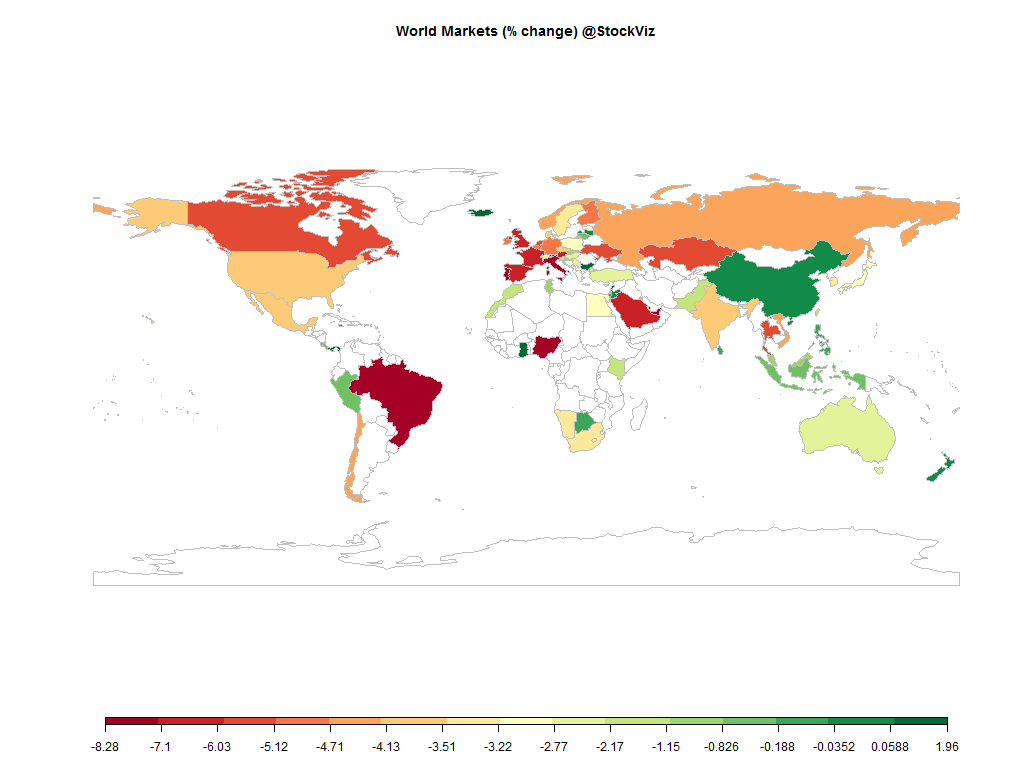
world.2014-12-19.2014-12-26

Equities

Major
DAX(DEU) +1.38%
CAC(FRA) +1.28%
UKX(GBR) +0.99%
NKY(JPN) +1.12%
SPX(USA) +1.24%
MINTs
JCI(IDN) +0.43%
INMEX(MEX) +0.69%
NGSEINDX(NGA) +13.60%
XU030(TUR) +1.50%
BRICS
IBOV(BRA) +2.47%
SHCOMP(CHN) +1.58%
NIFTY(IND) -0.30%
INDEXCF(RUS) -2.16%
TOP40(ZAF) +0.21%

Commodities

Energy
Brent Crude Oil -1.56%
Heating Oil -2.21%
RBOB Gasoline -2.52%
Ethanol +0.80%
Natural Gas -13.76%
WTI Crude Oil -1.88%
Metals
Copper -2.06%
Palladium +1.23%
Gold 100oz -0.23%
Platinum +1.37%
Silver 5000oz +1.26%

Currencies

USDEUR:+0.44% USDJPY:+0.74%

MINTs
USDIDR(IDN) -0.70%
USDMXN(MEX) +0.35%
USDNGN(NGA) +1.11%
USDTRY(TUR) +0.27%
BRICS
USDBRL(BRA) +0.75%
USDCNY(CHN) -0.13%
USDINR(IND) +0.42%
USDRUB(RUS) -9.38%
USDZAR(ZAF) +0.03%
Agricultural
Cattle +1.66%
Cotton +1.63%
Feeder Cattle -3.89%
Lumber -0.24%
Orange Juice -0.87%
White Sugar +0.23%
Coffee (Robusta) -1.84%
Corn +1.35%
Wheat -2.81%
Cocoa +0.00%
Lean Hogs -1.17%
Soybean Meal +3.90%
Sugar #11 -1.41%
Coffee (Arabica) -4.22%
Soybeans +2.05%

Credit Indices

Index Change
Markit CDX EM +1.37%
Markit CDX NA HY +0.34%
Markit CDX NA IG -0.81%
Markit iTraxx Asia ex-Japan IG -4.39%
Markit iTraxx Australia -4.03%
Markit iTraxx Europe -4.00%
Markit iTraxx Europe Crossover -20.00%
Markit iTraxx Japan -1.28%
Markit iTraxx SovX Western Europe -2.25%
Markit LCDX (Loan CDS) +0.00%
Markit MCDX (Municipal CDS) +1.08%
It was one heckuva week with the upside surprise in US GDP, thin holiday trading and a volatile expiry.

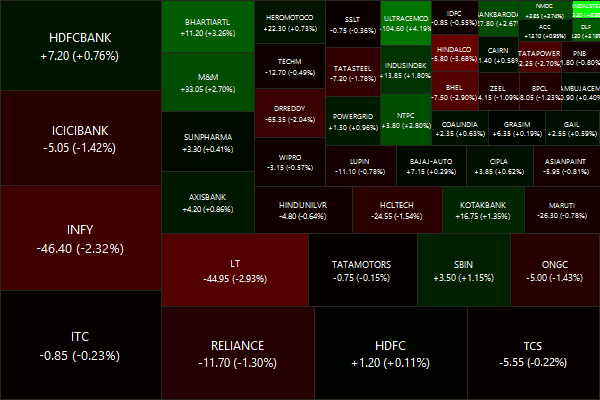
Nifty Heatmap

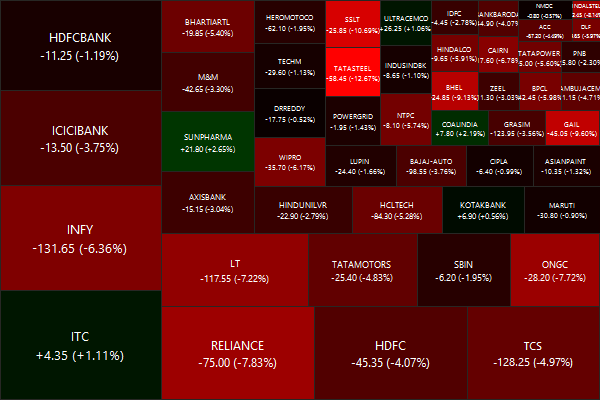
CNX NIFTY.2014-12-19.2014-12-26

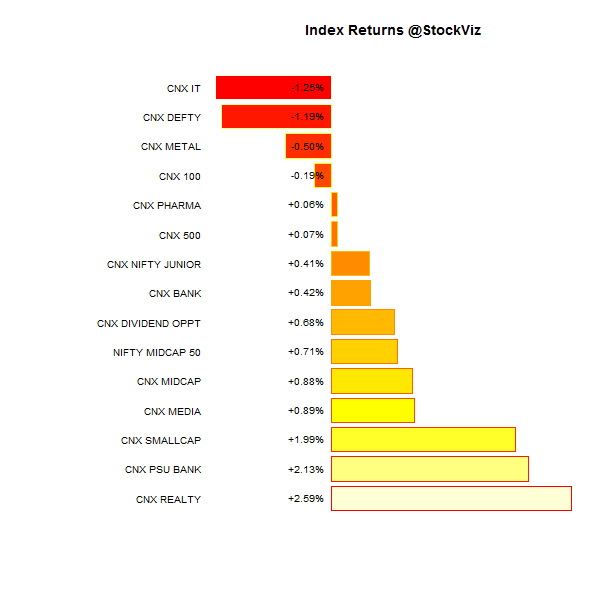
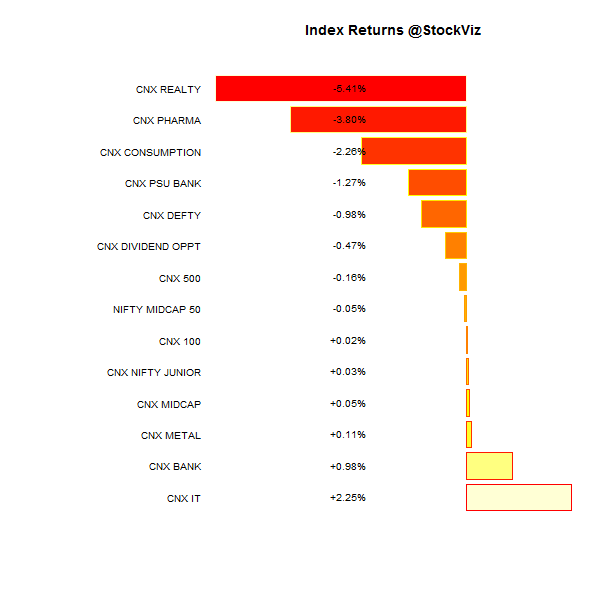
Index Returns

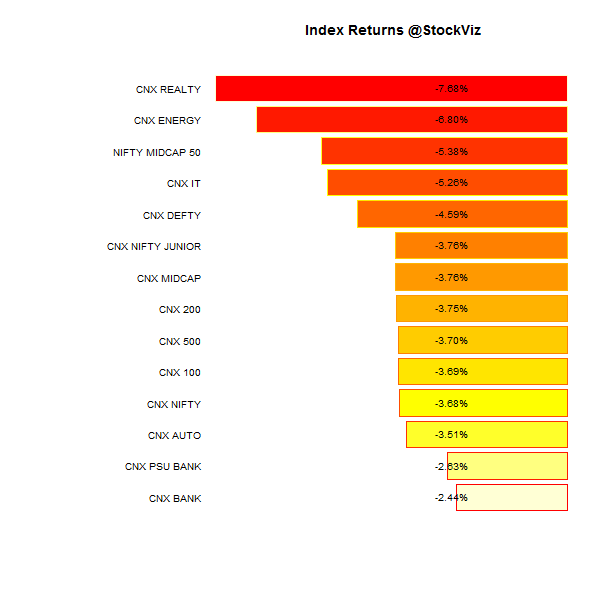
index performance.2014-12-19.2014-12-26

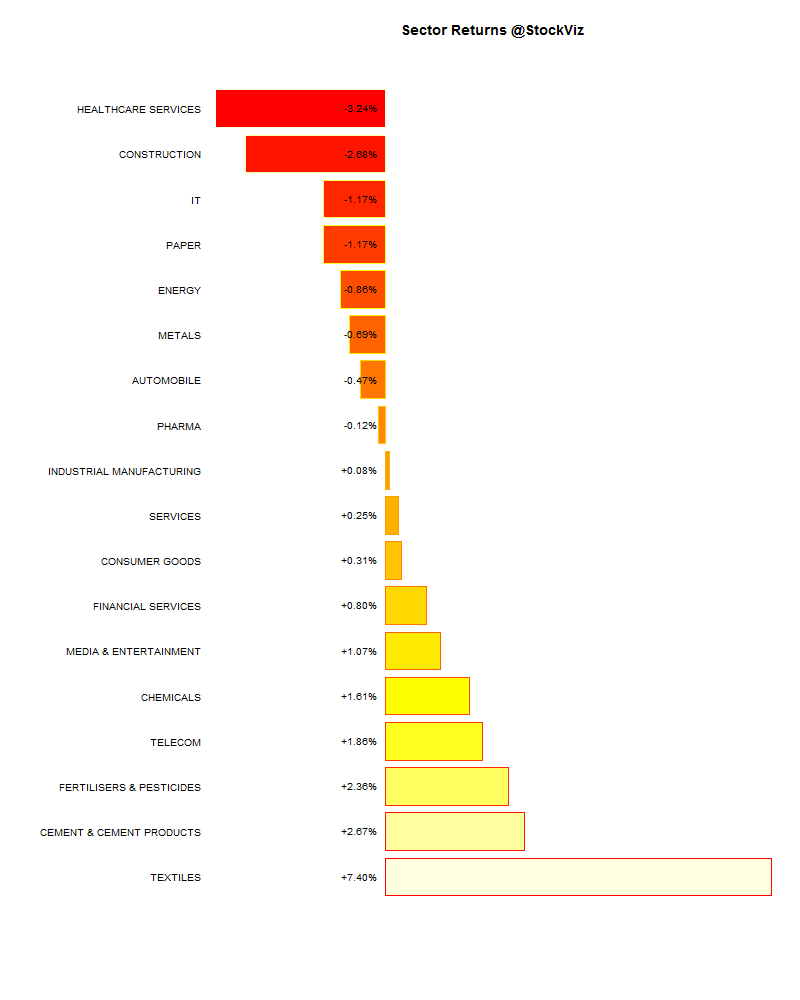
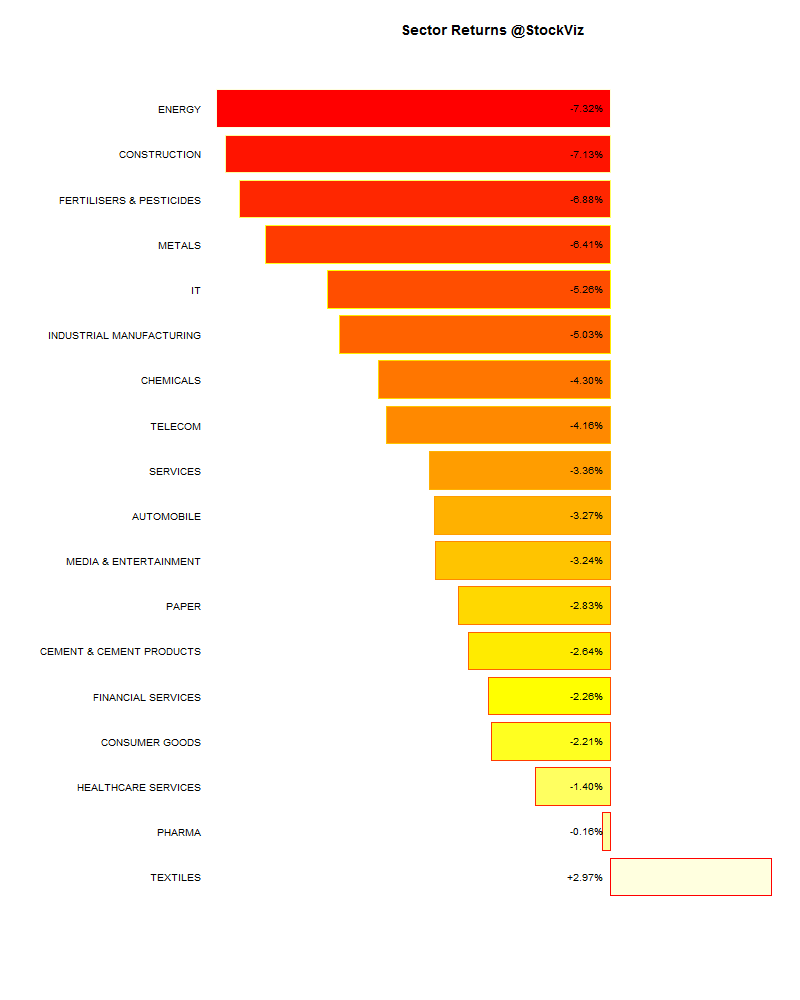
Sector Performance

sector performance.2014-12-19.2014-12-26

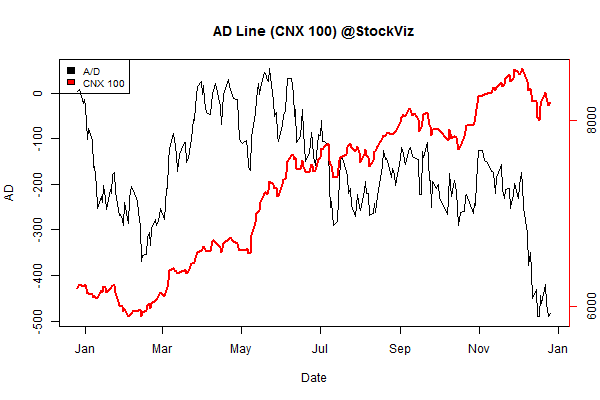
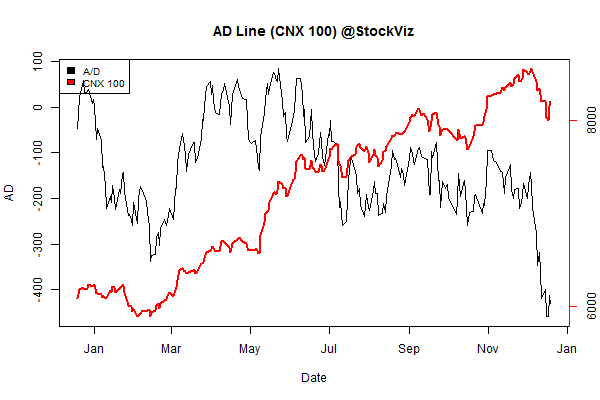
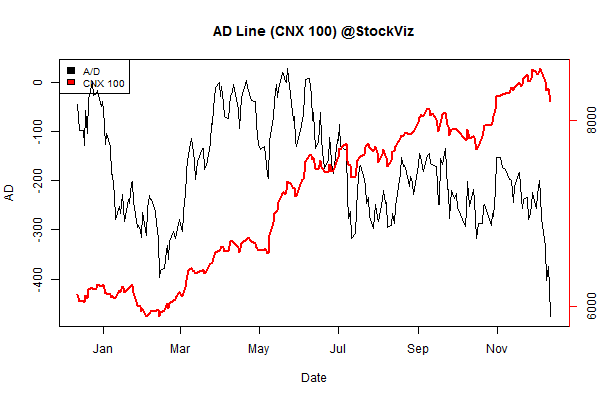
Advance Decline

advance.decline.line2.2014-12-19.2014-12-26

Market Cap Decile Performance

Decile Mkt. Cap. Adv/Decl
1 (micro) -3.05% 66/70
2 -0.47% 63/72
3 -0.82% 64/72
4 -0.50% 65/69
5 -1.73% 64/72
6 -0.27% 67/68
7 +1.35% 75/61
8 +0.02% 69/66
9 +1.19% 62/74
10 (mega) -0.43% 72/64
One big nothingburger.

Top Winners and Losers

BANKINDIA +5.00%
JINDALSTEL +8.98%
UNIONBANK +9.00%
HINDPETRO -5.26%
INFRATEL -4.89%
HINDALCO -3.68%
No bombs feel, computers did not take control…

ETF Performance

PSUBNKBEES +2.35%
BANKBEES +0.85%
INFRABEES +0.80%
JUNIORBEES +0.53%
GOLDBEES -0.01%
CPSEETF -0.36%
NIFTYBEES -0.71%
… and PSU banks outperformed.

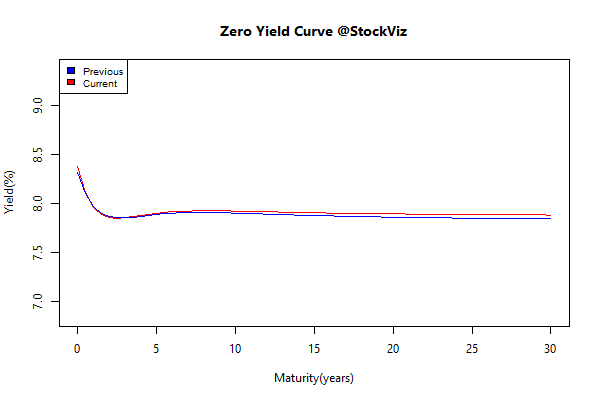
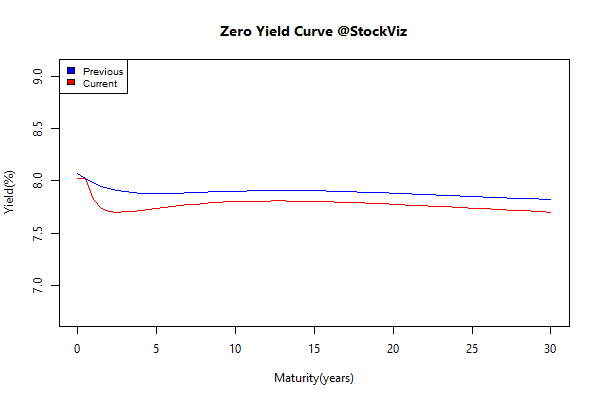
Yield Curve

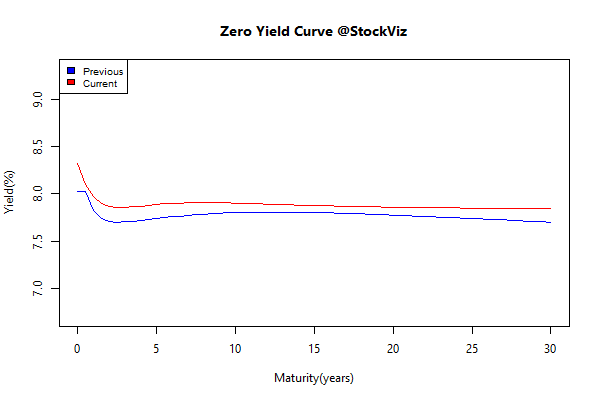
yield Curve.2014-12-19.2014-12-26

Bond Indices

Sub Index Change in YTM Total Return(%)
GSEC TB -0.42 +0.27%
GSEC SUB 1-3 -0.15 +0.60%
GSEC SUB 3-8 +0.02 +0.22%
GSEC SUB 8 +0.07 -0.40%
The long bond gave up some ground (FIIs selling?)

Investment Theme Performance

Thought for the weekend

The most important thing to understand is that both bear markets and volatility are inevitable. In fact, they are the true source of the equity risk premium, and why it has historically been so large.

Stocks are riskier than bonds. Thus, investors demand a premium, in the form of a higher expected return, as compensation for taking the greater risk stocks entail. The key word is “expected.” If stocks always outperformed, there would be no risk in purchasing them. It’s the risk of the unexpected happening that leads to the equity risk premium.

Source: How To Think About Bear Markets

FundCompare: Pruning your Mutual Fund portfolio

The dilemma

Ownership of a diversified, un-correlated set of assets remains the touchstone of a well crafted portfolio. We had discussed how adding bonds to your equity portfolio reduces volatility before. However, comparing correlations between funds within the same asset class is a challenge.

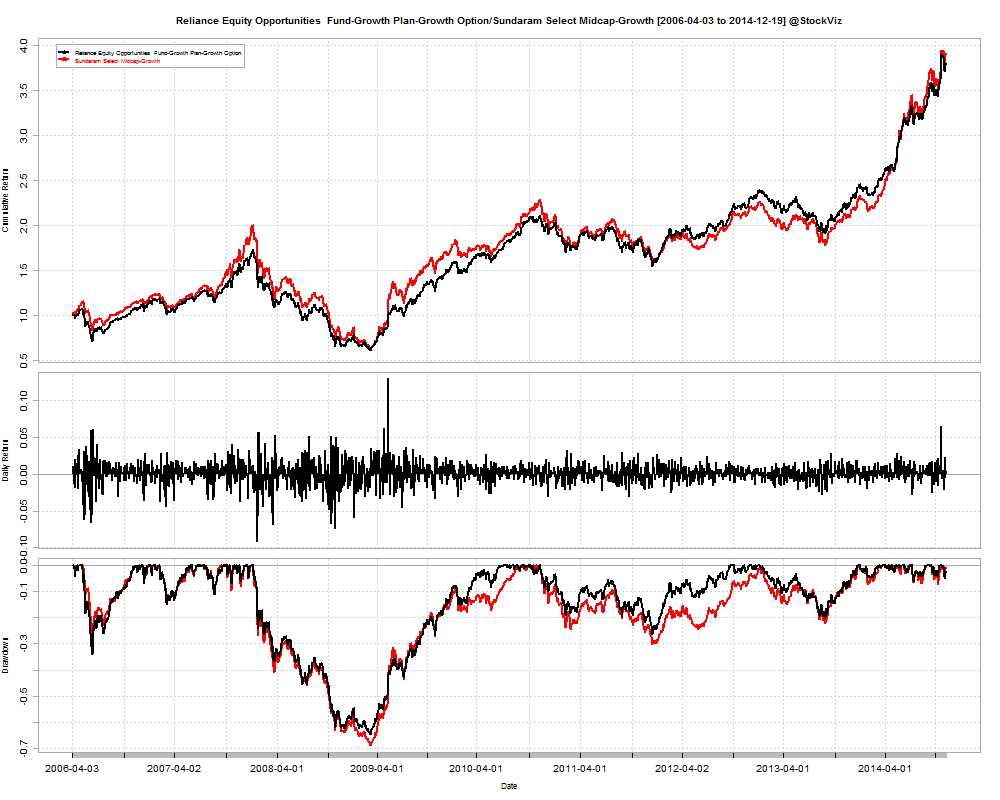
For example, say you already have the Reliance Equity Opportunities Fund in your portfolio and your agent is pitching the Sundaram Select Midcap fund, how do you figure out whether to add to your existing holding of the Reliance fund, add an extra line item or switch to Sundaram?

Comparative returns

reliance_sund_returns

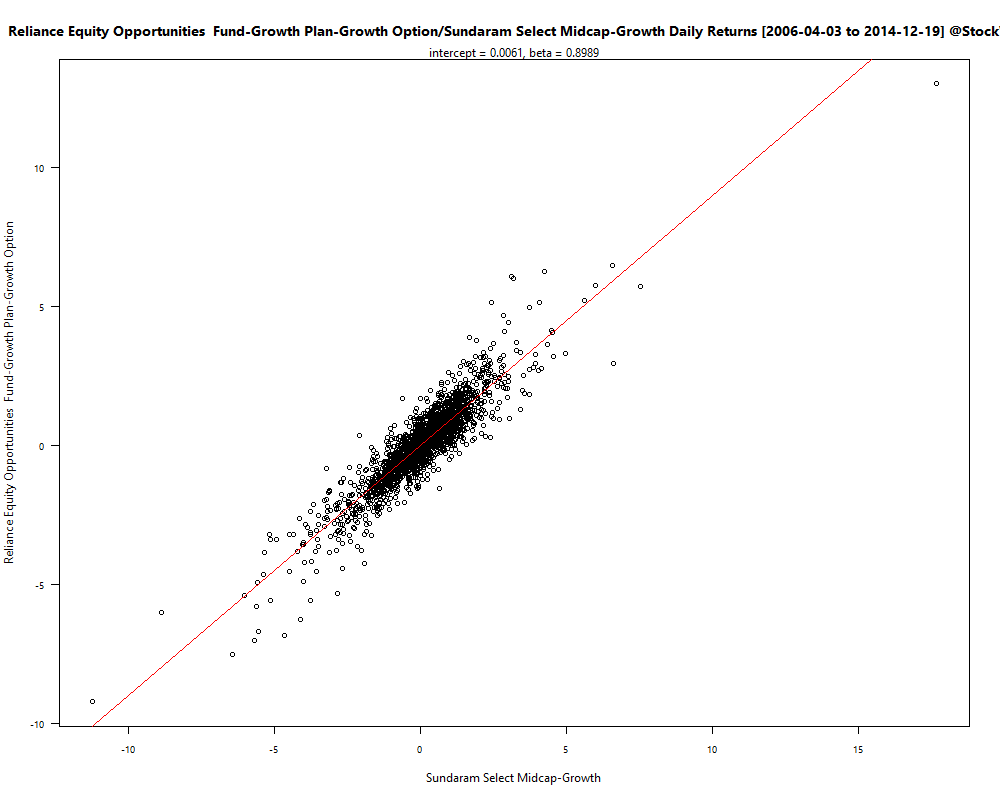
Between 2006-04-03 and 2014-12-19, Reliance’s Fund returned a cumulative 280.08% with an IRR of 16.55% vs. Sundaram’s cumulative return of 290.44% and an IRR of 16.91%.

As you can see, the wealth charts are almost on top of each other. The correlation chart confirms it:

reliance sund cor

Except for a few outliers, they are almost the same fund packaged differently.

Histogram of returns

The FundCompare tool also gives you the histogram of fund returns and the associated skewness. In this case, the Reliance Fund has a skew of -0.15 vs. Sundaram’s +0.22. Given that the average returns are more-or-less the same, this means that Sundaram’s Fund is better. Besides, it also appears that Sundaram’s Fund has a better Sharpe ratio.

Given that Reliance’s Fund has an expense ratio of 2.29% vs. Sundaram’s 2.26%, I would say “switch.”

Compare Your Funds

Before pulling the trigger based on what your fund broker/adviser tells you, get a free quantitative analysis of your options on our FundCompare tool.

Weekly Recap: Conflicts

world.2014-12-12.2014-12-19

Equities

Major
DAX(DEU) +2.00%
CAC(FRA) +3.23%
UKX(GBR) +3.88%
NKY(JPN) +1.44%
SPX(USA) +2.42%
MINTs
JCI(IDN) -0.31%
INMEX(MEX) +2.18%
NGSEINDX(NGA) -1.49%
XU030(TUR) +0.92%
BRICS
IBOV(BRA) +3.43%
SHCOMP(CHN) +5.80%
NIFTY(IND) +0.01%
INDEXCF(RUS) -0.72%
TOP40(ZAF) +2.96%

Commodities

Energy
Ethanol -5.78%
WTI Crude Oil -0.41%
RBOB Gasoline -1.60%
Brent Crude Oil -1.00%
Heating Oil -2.34%
Natural Gas -8.76%
Metals
Gold 100oz -2.18%
Palladium -1.18%
Platinum -2.83%
Copper -0.68%
Silver 5000oz -7.02%

Currencies

USDEUR:+1.82% USDJPY:+0.64%

MINTs
USDIDR(IDN) +0.24%
USDMXN(MEX) -0.68%
USDNGN(NGA) +0.83%
USDTRY(TUR) +0.75%
BRICS
USDBRL(BRA) +0.32%
USDCNY(CHN) +0.53%
USDINR(IND) +1.61%
USDRUB(RUS) +2.29%
USDZAR(ZAF) -0.08%
Agricultural
Cocoa +3.59%
Corn +3.53%
Soybean Meal -3.96%
Soybeans -1.39%
Coffee (Arabica) +0.57%
Cotton +0.12%
Feeder Cattle -2.39%
Orange Juice -5.25%
Sugar #11 -0.40%
Wheat +0.88%
Cattle -0.34%
Coffee (Robusta) -2.21%
Lean Hogs -6.49%
Lumber +0.29%
White Sugar +0.10%

Credit Indices

Index Change
Markit CDX EM -0.30%
Markit CDX NA HY +0.52%
Markit CDX NA IG +0.73%
Markit iTraxx Asia ex-Japan IG +8.59%
Markit iTraxx Australia +7.20%
Markit iTraxx Europe +4.16%
Markit iTraxx Europe Crossover +16.58%
Markit iTraxx Japan +2.11%
Markit iTraxx SovX Western Europe +2.94%
Markit LCDX (Loan CDS) -0.18%
Markit MCDX (Municipal CDS) +2.46%
All I can say about this week is that I am glad that its over.
The NIFTY ended flat for the week but that hides the roller-coaster ride it put investors through. After all the oil-related panic, the S&P ended up more than 2% for the week.
Oil ended down, dollar up.
Hopefully Santa visits before expiry.

Index Returns

index performance.2014-12-12.2014-12-19

Advance Decline

advance.decline.line2.2014-12-12.2014-12-19

Market Cap Decile Performance

Decile Mkt. Cap. Adv/Decl
1 (micro) -6.25% 63/74
2 -3.65% 63/73
3 -2.93% 64/73
4 -2.21% 61/75
5 -3.07% 63/73
6 -1.98% 65/72
7 -2.00% 56/80
8 -1.38% 64/73
9 -1.17% 64/72
10 (mega) -0.01% 68/69
The sell-off was brutal below the mega-caps…

Top Winners and Losers

ZEEL +5.45%
PETRONET +6.27%
PFC +8.11%
DLF -13.19%
BAJAJHLDNG -8.34%
RCOM -7.32%
Broad based action saw a mix of winners and losers…

ETF Performance

CPSEETF +3.32%
BANKBEES +0.98%
INFRABEES +0.54%
NIFTYBEES -0.03%
JUNIORBEES -0.22%
GOLDBEES -0.99%
PSUBNKBEES -1.93%
Banks withstood the onslaught well…

Yield Curve

yield Curve.2014-12-12.2014-12-19

Bond Indices

Sub Index Change in YTM Total Return(%)
GSEC TB +0.44 +0.04%
GSEC SUB 1-3 +0.43 -0.43%
GSEC SUB 3-8 +0.19 -0.53%
GSEC SUB 8 +0.08 -0.34%
Yields went up – breaking a long streak of falling rates.

Investment Theme Performance

Thought for the weekend

Asset managers and asset owners have a relationship beset with natural conflicts.

  1. Asset owners want fees below 10 bps; asset managers prefer “2% + 20%.”
  2. Asset owners want transparency; asset managers favor black-box opacity.
  3. Asset owners want simplicity; asset managers hire rocket scientists to create complex optimized solutions for sex appeal.
  4. Asset owners want “future” outperformance after they fund a manager; asset managers would be satisfied with strong past outperformance to facilitate future asset gathering.
  5. Asset owners want a bigger alpha; asset managers would happily sell them the possibility of alpha and charge handsomely for the service of selling hope.

Source: The Promise of Smart Beta

Weekly Recap: They’re all making it up

world.2014-12-05.2014-12-12

Equities

Major
DAX(DEU) -4.88%
CAC(FRA) -7.03%
UKX(GBR) -6.56%
NKY(JPN) -3.06%
SPX(USA) -3.61%
MINTs
JCI(IDN) -0.53%
INMEX(MEX) -3.90%
NGSEINDX(NGA) -7.42%
XU030(TUR) -2.58%
BRICS
IBOV(BRA) -7.42%
SHCOMP(CHN) +0.02%
NIFTY(IND) -3.68%
INDEXCF(RUS) -4.55%
TOP40(ZAF) -3.36%

Commodities

Energy
RBOB Gasoline -10.98%
Ethanol -3.18%
Natural Gas -0.87%
WTI Crude Oil -13.42%
Brent Crude Oil -11.22%
Heating Oil -5.34%
Metals
Copper +0.34%
Gold 100oz +2.74%
Palladium +1.51%
Platinum +0.66%
Silver 5000oz +5.56%

Currencies

USDEUR:-1.39% USDJPY:-2.31%

MINTs
USDIDR(IDN) +1.37%
USDMXN(MEX) +2.25%
USDNGN(NGA) -0.98%
USDTRY(TUR) +1.61%
BRICS
USDBRL(BRA) +2.24%
USDCNY(CHN) +0.59%
USDINR(IND) +0.83%
USDRUB(RUS) +10.19%
USDZAR(ZAF) +2.05%
Agricultural
Corn +4.55%
Cotton -0.49%
Lean Hogs -4.11%
Wheat +3.80%
Cocoa -3.08%
Sugar #11 -0.92%
White Sugar -1.09%
Coffee (Arabica) -2.77%
Feeder Cattle -4.18%
Orange Juice +4.01%
Soybean Meal -3.86%
Cattle -2.12%
Coffee (Robusta) -4.66%
Lumber +0.24%
Soybeans +1.82%

Credit Indices

Index Change
Markit CDX EM -2.51%
Markit CDX NA HY -1.44%
Markit CDX NA IG +6.32%
Markit iTraxx Asia ex-Japan IG +1.58%
Markit iTraxx Australia +2.31%
Markit iTraxx Europe +2.14%
Markit iTraxx Europe Crossover +18.62%
Markit iTraxx Japan +2.77%
Markit iTraxx SovX Western Europe +0.48%
Markit LCDX (Loan CDS) -0.37%
Markit MCDX (Municipal CDS) +2.93%
It was a brutal week at the markets. All major indices went down like a rock. Dollar rallied and the precious metal complex found a bid. The energy sector is like a drunk grouping in the dark for a bottom. But don’t you worry, SEBI will soon some up with a rule where your broker will have to send you a bag of cash whenever you lose money in the markets.

Nifty Heatmap

CNX NIFTY.2014-12-05.2014-12-12

Index Returns

index performance.2014-12-05.2014-12-12

Sector Performance

sector performance.2014-12-05.2014-12-12

Advance Decline

advance.decline.line2.2014-12-05.2014-12-12

Market Cap Decile Performance

Decile Mkt. Cap. Adv/Decl
1 (micro) -7.17% 67/72
2 -4.35% 62/77
3 -4.12% 55/84
4 -4.96% 56/83
5 -5.77% 54/85
6 -5.63% 61/78
7 -4.51% 61/79
8 -3.75% 66/72
9 -4.15% 68/71
10 (mega) -3.60% 74/66
Maximum pain in the lower market cap tiers…

Top Winners and Losers

AUROPHARMA +2.74%
RANBAXY +4.10%
INFRATEL +9.98%
RCOM -12.68%
TATASTEEL -12.67%
SSLT -10.69%
Select “Story” stocks ended the week in the green.

ETF Performance

GOLDBEES +2.44%
PSUBNKBEES -2.50%
BANKBEES -3.04%
NIFTYBEES -3.82%
JUNIORBEES -3.87%
CPSEETF -4.86%
INFRABEES -7.22%
Nice to see gold in the green after weeks in the red.

Yield Curve

yield Curve.2014-12-05.2014-12-12

Bond Indices

Sub Index Change in YTM Total Return(%)
GSEC TB -0.10 +0.18%
GSEC SUB 1-3 -0.01 +0.35%
GSEC SUB 3-8 -0.17 +0.64%
GSEC SUB 8 -0.17 +0.89%
Falling inflation, slowing growth and a dash for safe assets.

Investment Theme Performance

Not a single strategy worked this week. Here’s to hoping for better days ahead…

Thought for the weekend

They’re watching market prices fluctuate and assigning meaning where none exists. Stories are being told and headlines are being crafted so that there is something for you to click on from your app when you check the news.

They’re giving you an ex-post description of the beliefs of your fellow guessers who are no better at explaining day-to-day randomness than you are.

Source: They’re all making it up.

Related: Why Do Models Beat Experts?

Re-factored Indices and Momentum

We have created a whole bunch of Themes based on indices published by the NSE. We call them Re-factored Indices because they use a weighting that is different from NSE’s. We currently have free-float cap weighted and equal weighted themes. Investors can now invest in standard indices directly, without having to go through an index fund.

These Themes are automatically re-balanced once a month. There is no discretion on what goes into them, the portfolio is decided by the NSE/IISL. Investors can use these to “set it and forget it.”

Long-term out performance

Some indices show persistent long-term out-performance. For example, MNCs have beaten PSEs (StockViz) and have shown to have lower draw-downs. Investors can map the MNC Theme and let NSE/IISL figure out what stocks should be part of that index.

Momentum

Short-term investors can use momentum effects to their advantage and implement a switching strategy. For example, CNX BANK shows greater momentum than CNX ENERGY:

CNX BANK

CNX ENERGY

And over the last week, momentum in CNX REALTY has improved drastically whereas CNX IT has decreased:

CNX IT

CNX REALTY

Conclusion

Re-factored Indices can act as ETF-proxies for long-term, passive investors and opens up interesting momentum strategies for short-term investors.