Category: Your Money

Monthly Recap: Desires > Aspirations

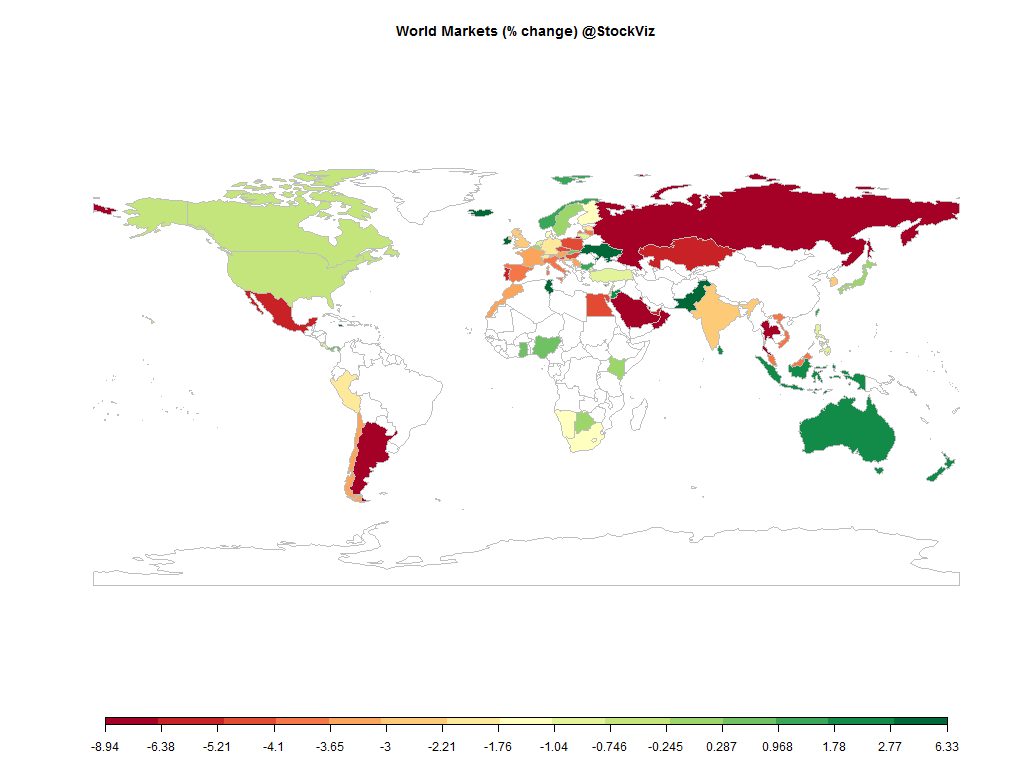
world.2014-11-28.2014-12-31

Equities

Major
DAX(DEU) -2.17%
CAC(FRA) -3.14%
UKX(GBR) -2.60%
NKY(JPN) -0.05%
SPX(USA) -0.45%
MINTs
JCI(IDN) +1.80%
INMEX(MEX) -5.54%
NGSEINDX(NGA) +0.33%
XU030(TUR) -0.93%
BRICS
IBOV(BRA) -11.79%
SHCOMP(CHN) +20.57%
NIFTY(IND) -2.24%
INDEXCF(RUS) -8.94%
TOP40(ZAF) -1.15%

Commodities

Energy
Ethanol -21.95%
Brent Crude Oil -20.57%
WTI Crude Oil -21.45%
Heating Oil -19.32%
Natural Gas -27.91%
RBOB Gasoline -24.60%
Metals
Copper -1.05%
Platinum +0.32%
Gold 100oz +1.75%
Palladium -1.43%
Silver 5000oz +1.95%

Currencies

USDEUR:+3.62% USDJPY:+1.55%

MINTs
USDIDR(IDN) +2.78%
USDMXN(MEX) +6.70%
USDNGN(NGA) +2.44%
USDTRY(TUR) +5.62%
BRICS
USDBRL(BRA) +4.93%
USDCNY(CHN) +1.02%
USDINR(IND) +2.04%
USDRUB(RUS) +18.77%
USDZAR(ZAF) +5.51%
Agricultural
Coffee (Robusta) -12.45%
Lumber +0.82%
Soybeans -1.26%
Sugar #11 -8.60%
Wheat +0.26%
White Sugar -6.78%
Cattle -1.69%
Corn +4.84%
Orange Juice -3.12%
Feeder Cattle -3.24%
Soybean Meal -8.73%
Cocoa +3.43%
Coffee (Arabica) -14.03%
Cotton -3.09%
Lean Hogs -9.28%

Credit Indices

Index Change
Markit CDX EM -2.46%
Markit CDX NA HY -1.07%
Markit CDX NA IG +5.22%
Markit iTraxx Asia ex-Japan IG +1.76%
Markit iTraxx Australia +1.01%
Markit iTraxx Europe +2.30%
Markit iTraxx Europe Crossover +10.27%
Markit iTraxx Japan +2.28%
Markit iTraxx SovX Western Europe -1.51%
Markit LCDX (Loan CDS) -0.49%
Markit MCDX (Municipal CDS) +5.27%
The dollar rallied, oil collapsed, credit spreads widened and the sag in coffee kept punters awake.
Russia and Brazil were the worst performing markets. From Brics to Rics to Ics…

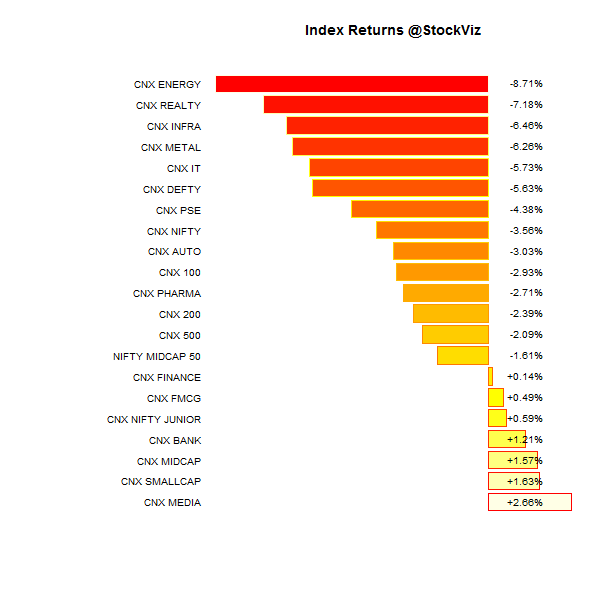
Index Returns

index performance.2014-11-28.2014-12-31

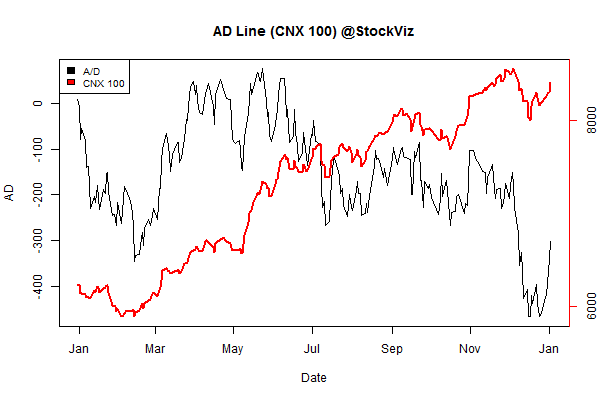
Advance Decline

advance.decline.line2.2014-11-28.2014-12-31

Market Cap Decile Performance

Decile Mkt. Cap. Adv/Decl
1 (small) -9.85% 66/73
2 -5.19% 58/82
3 -4.45% 65/75
4 -2.74% 66/73
5 -3.71% 61/79
6 -3.54% 72/68
7 -1.31% 65/75
8 -1.14% 74/66
9 +0.52% 74/66
10 (mega) -2.85% 73/67
December was brutal, especially for small and mid caps…

Top Winners and Losers

UNIONBANK +11.22%
INFRATEL +12.24%
BAJAJFINSV +13.65%
RCOM -22.24%
TATASTEEL -15.62%
BPCL -13.43%
RCOM vs. Infratel, enuf said.

ETF Performance

BANKBEES +1.51%
GOLDBEES +0.87%
JUNIORBEES +0.24%
PSUBNKBEES +0.08%
CPSEETF -2.57%
NIFTYBEES -3.51%
INFRABEES -7.45%
Banks survived…

Yield Curve

yield Curve.2014-11-28.2014-12-31

Interbank Lending

mibor.30days.2014-12-31

Bond Indices

Sub Index Change in YTM Total Return(%)
GSEC TB -0.16 +0.77%
GSEC SUB 1-3 +0.23 +1.09%
GSEC SUB 3-8 -0.22 +1.65%
GSEC SUB 8 -0.32 +2.72%
#winning

Investment Theme Performance

Thought to sum up the month

When our aspirations conflict with our desires, our desires often win out. How do we stick to our long-term goals?

Make them easy and automatic, make them a matter of habit, and make them fun.

Source: How to Keep Your New Year’s Resolutions

Weekly Recap: The Year Ahead

world.2014-12-26.2015-1-02

Equities

Major
DAX(DEU) -1.59%
CAC(FRA) -1.01%
UKX(GBR) -0.94%
NKY(JPN) -2.07%
SPX(USA) -1.46%
MINTs
JCI(IDN) +1.47%
INMEX(MEX) -1.95%
NGSEINDX(NGA) +0.66%
XU030(TUR) +0.66%
BRICS
IBOV(BRA) -3.26%
SHCOMP(CHN) +2.44%
NIFTY(IND) +2.37%
INDEXCF(RUS) -1.49%
TOP40(ZAF) -0.11%

Commodities

Energy
Heating Oil -6.15%
Natural Gas -2.38%
Ethanol -1.74%
Brent Crude Oil -5.10%
RBOB Gasoline -4.72%
WTI Crude Oil -4.23%
Metals
Gold 100oz -0.68%
Platinum -0.99%
Copper +0.35%
Palladium -2.75%
Silver 5000oz -2.48%

Currencies

USDEUR:+1.49% USDJPY:+0.16%

MINTs
USDIDR(IDN) +1.09%
USDMXN(MEX) +0.83%
USDNGN(NGA) +0.56%
USDTRY(TUR) +1.13%
BRICS
USDBRL(BRA) +0.94%
USDCNY(CHN) -0.09%
USDINR(IND) -0.43%
USDRUB(RUS) +9.81%
USDZAR(ZAF) +0.74%
Agricultural
Coffee (Robusta) -1.56%
Lumber -1.63%
White Sugar -3.21%
Corn -4.64%
Feeder Cattle +4.15%
Soybean Meal -6.21%
Cocoa -0.05%
Coffee (Arabica) -4.97%
Cotton -3.45%
Lean Hogs -0.12%
Wheat -4.92%
Cattle +0.91%
Orange Juice +2.30%
Soybeans -4.37%
Sugar #11 -3.19%

Credit Indices

Index Change
Markit CDX EM -0.55%
Markit CDX NA HY -0.58%
Markit CDX NA IG +1.90%
Markit iTraxx Asia ex-Japan IG +1.11%
Markit iTraxx Australia +2.17%
Markit iTraxx Europe +4.55%
Markit iTraxx Europe Crossover +23.20%
Markit iTraxx Japan +0.47%
Markit iTraxx SovX Western Europe -0.83%
Markit LCDX (Loan CDS) -0.24%
Markit MCDX (Municipal CDS) -0.61%
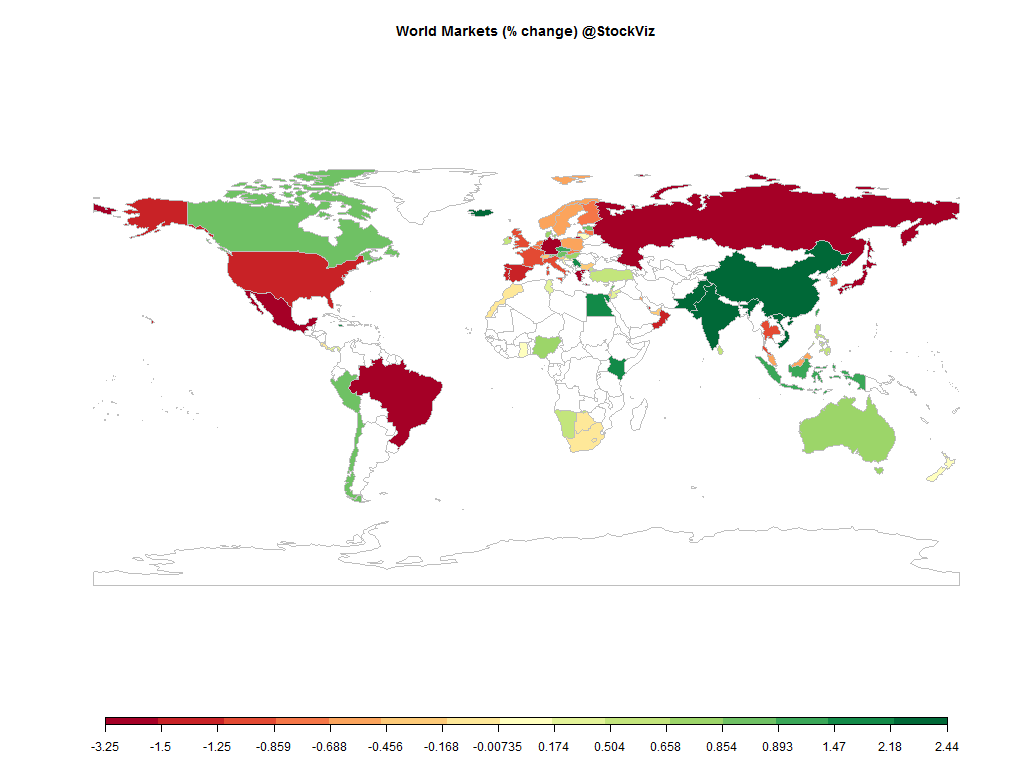
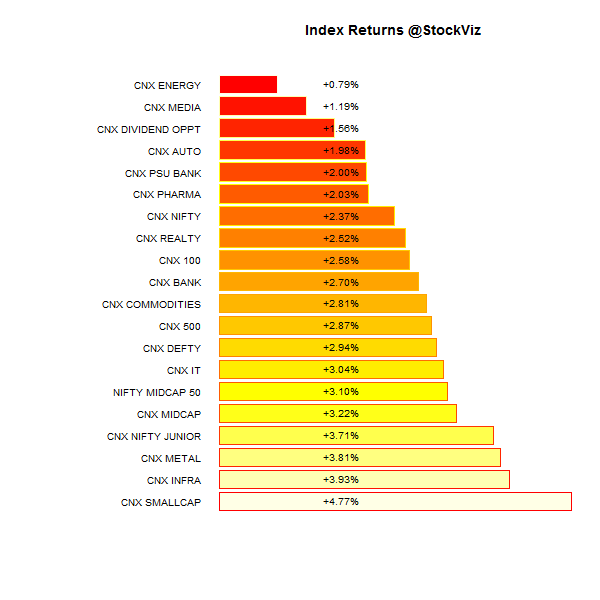
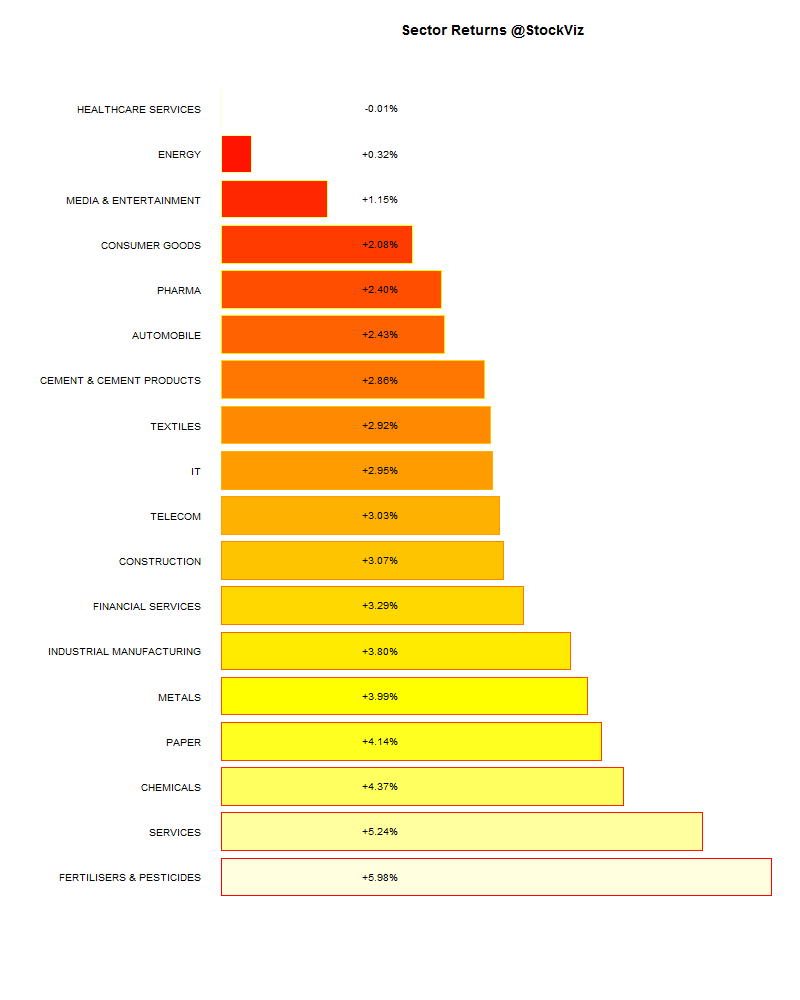
India was one of the few markets that were green in the first week of 2015. Credit spreads got wider, NKY down more than 2% and Europe was forced to eat Greek yogurt.

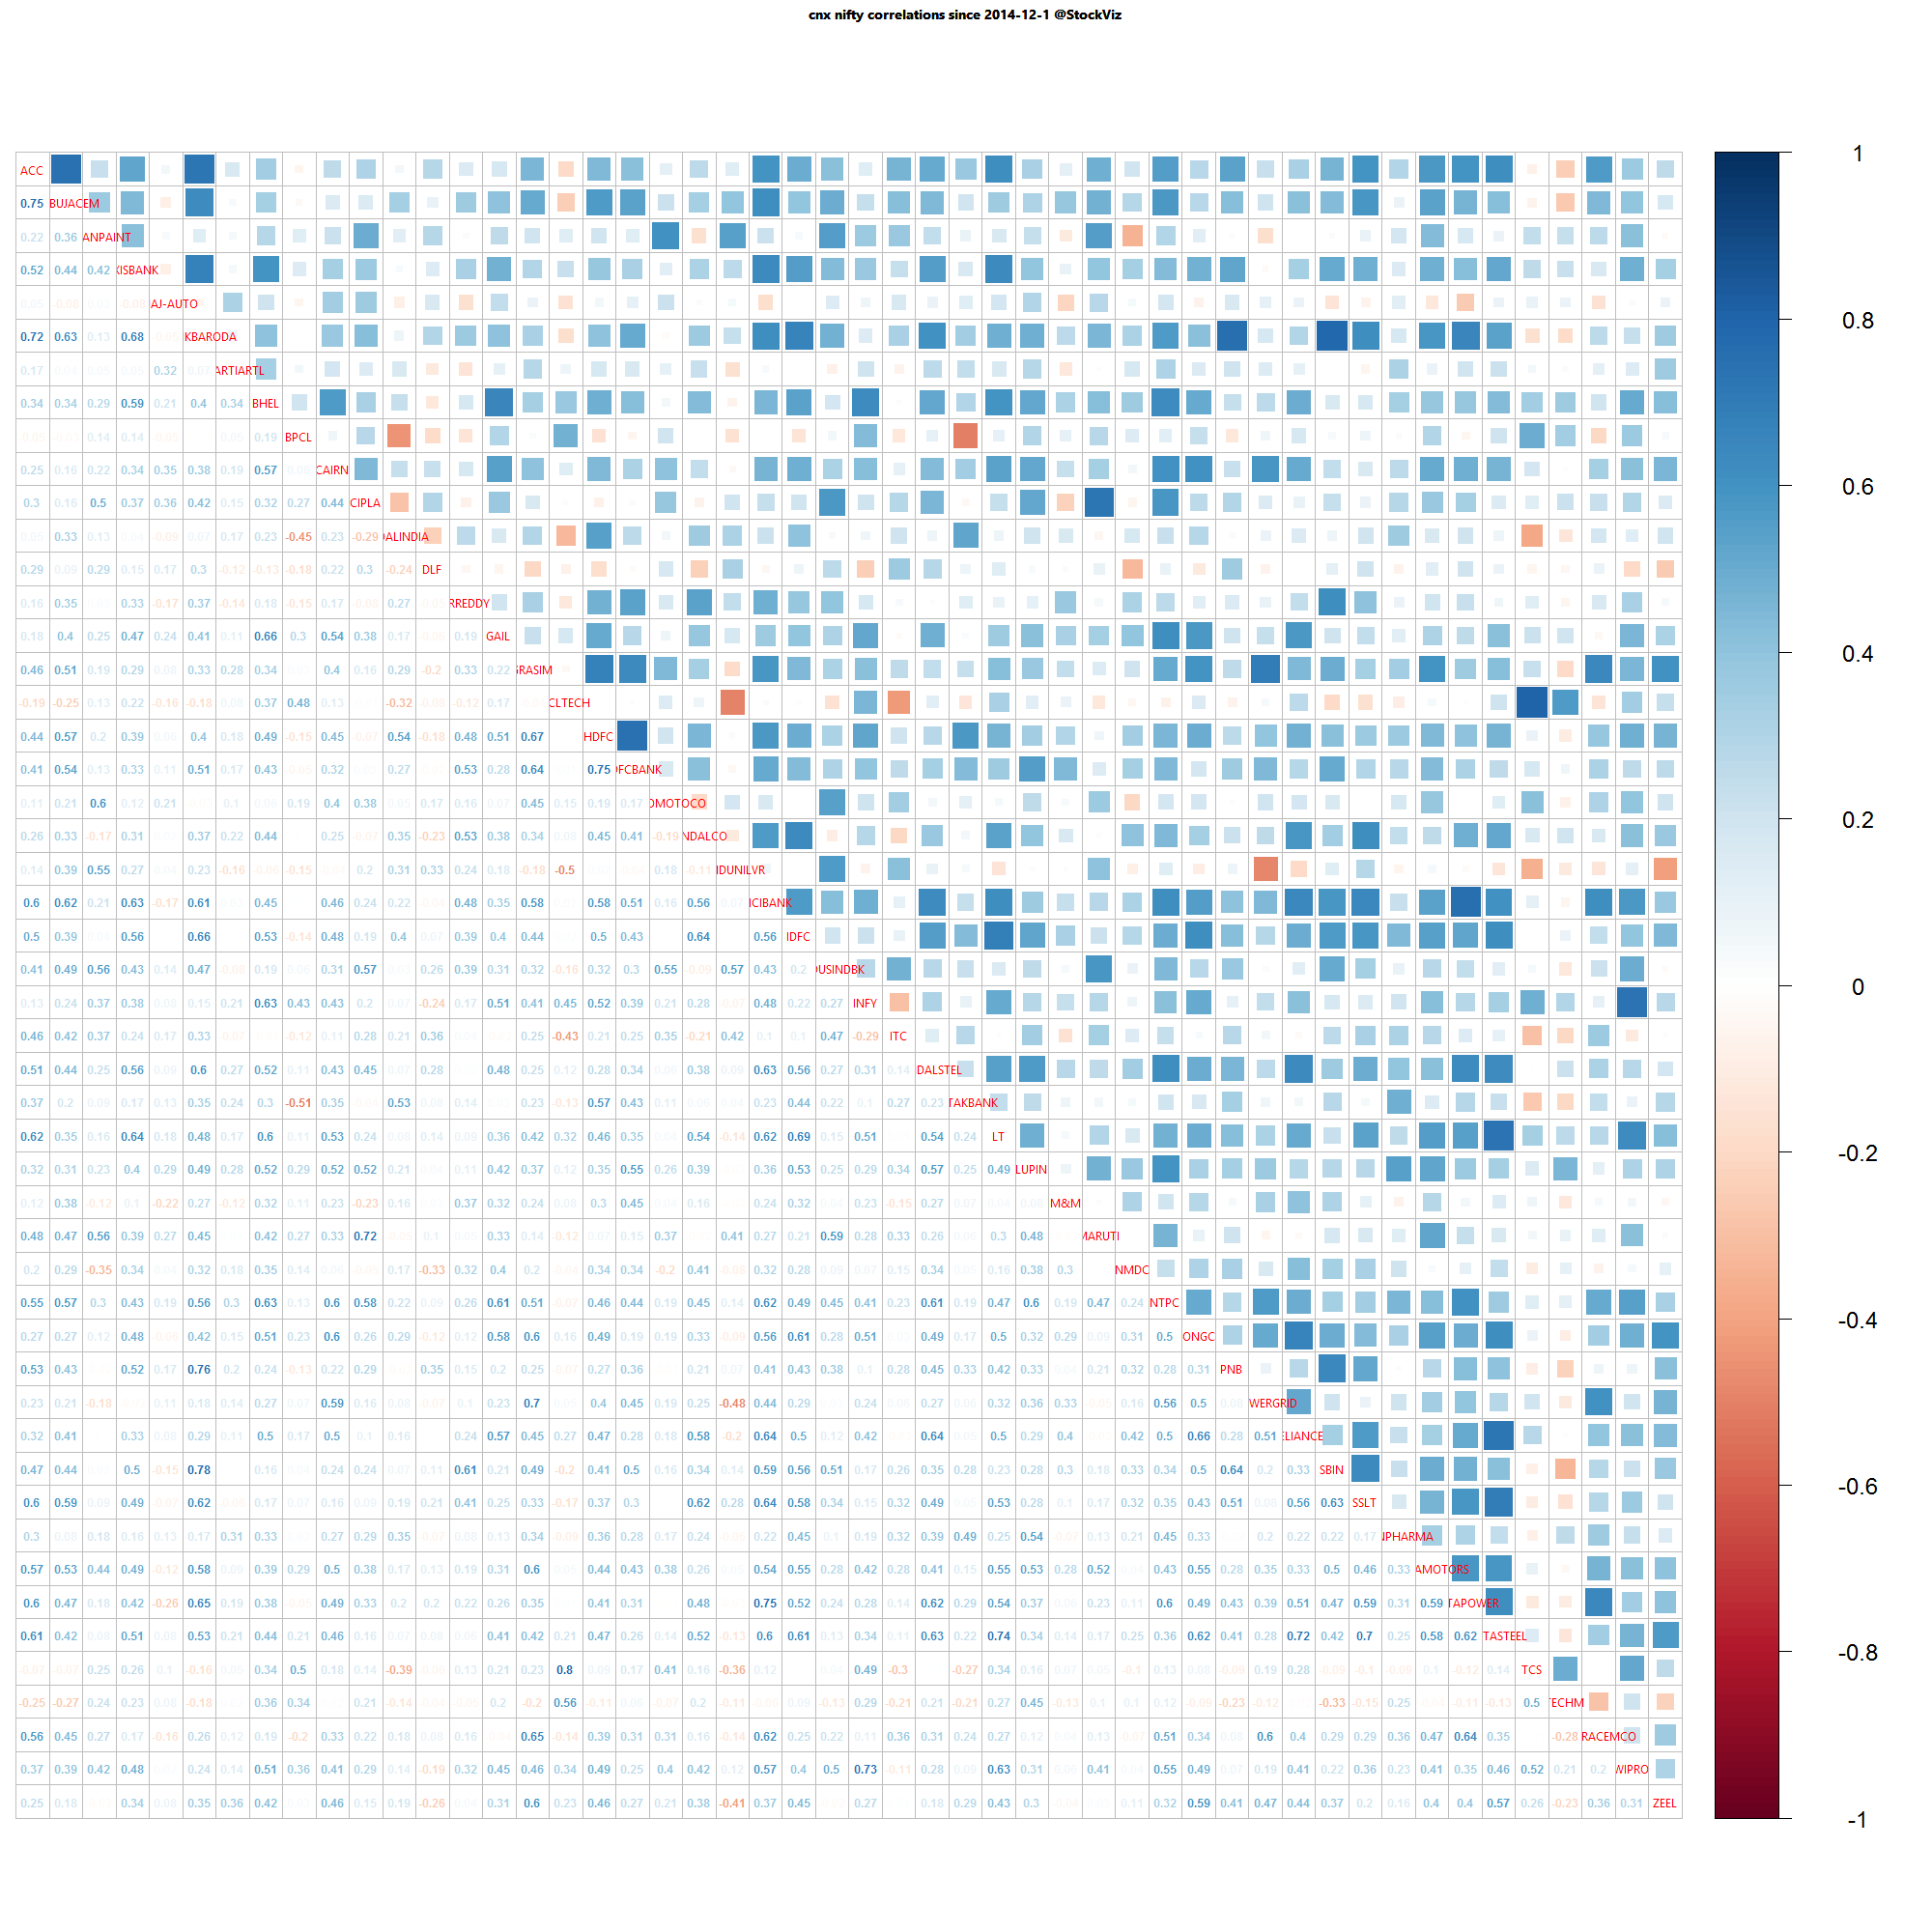
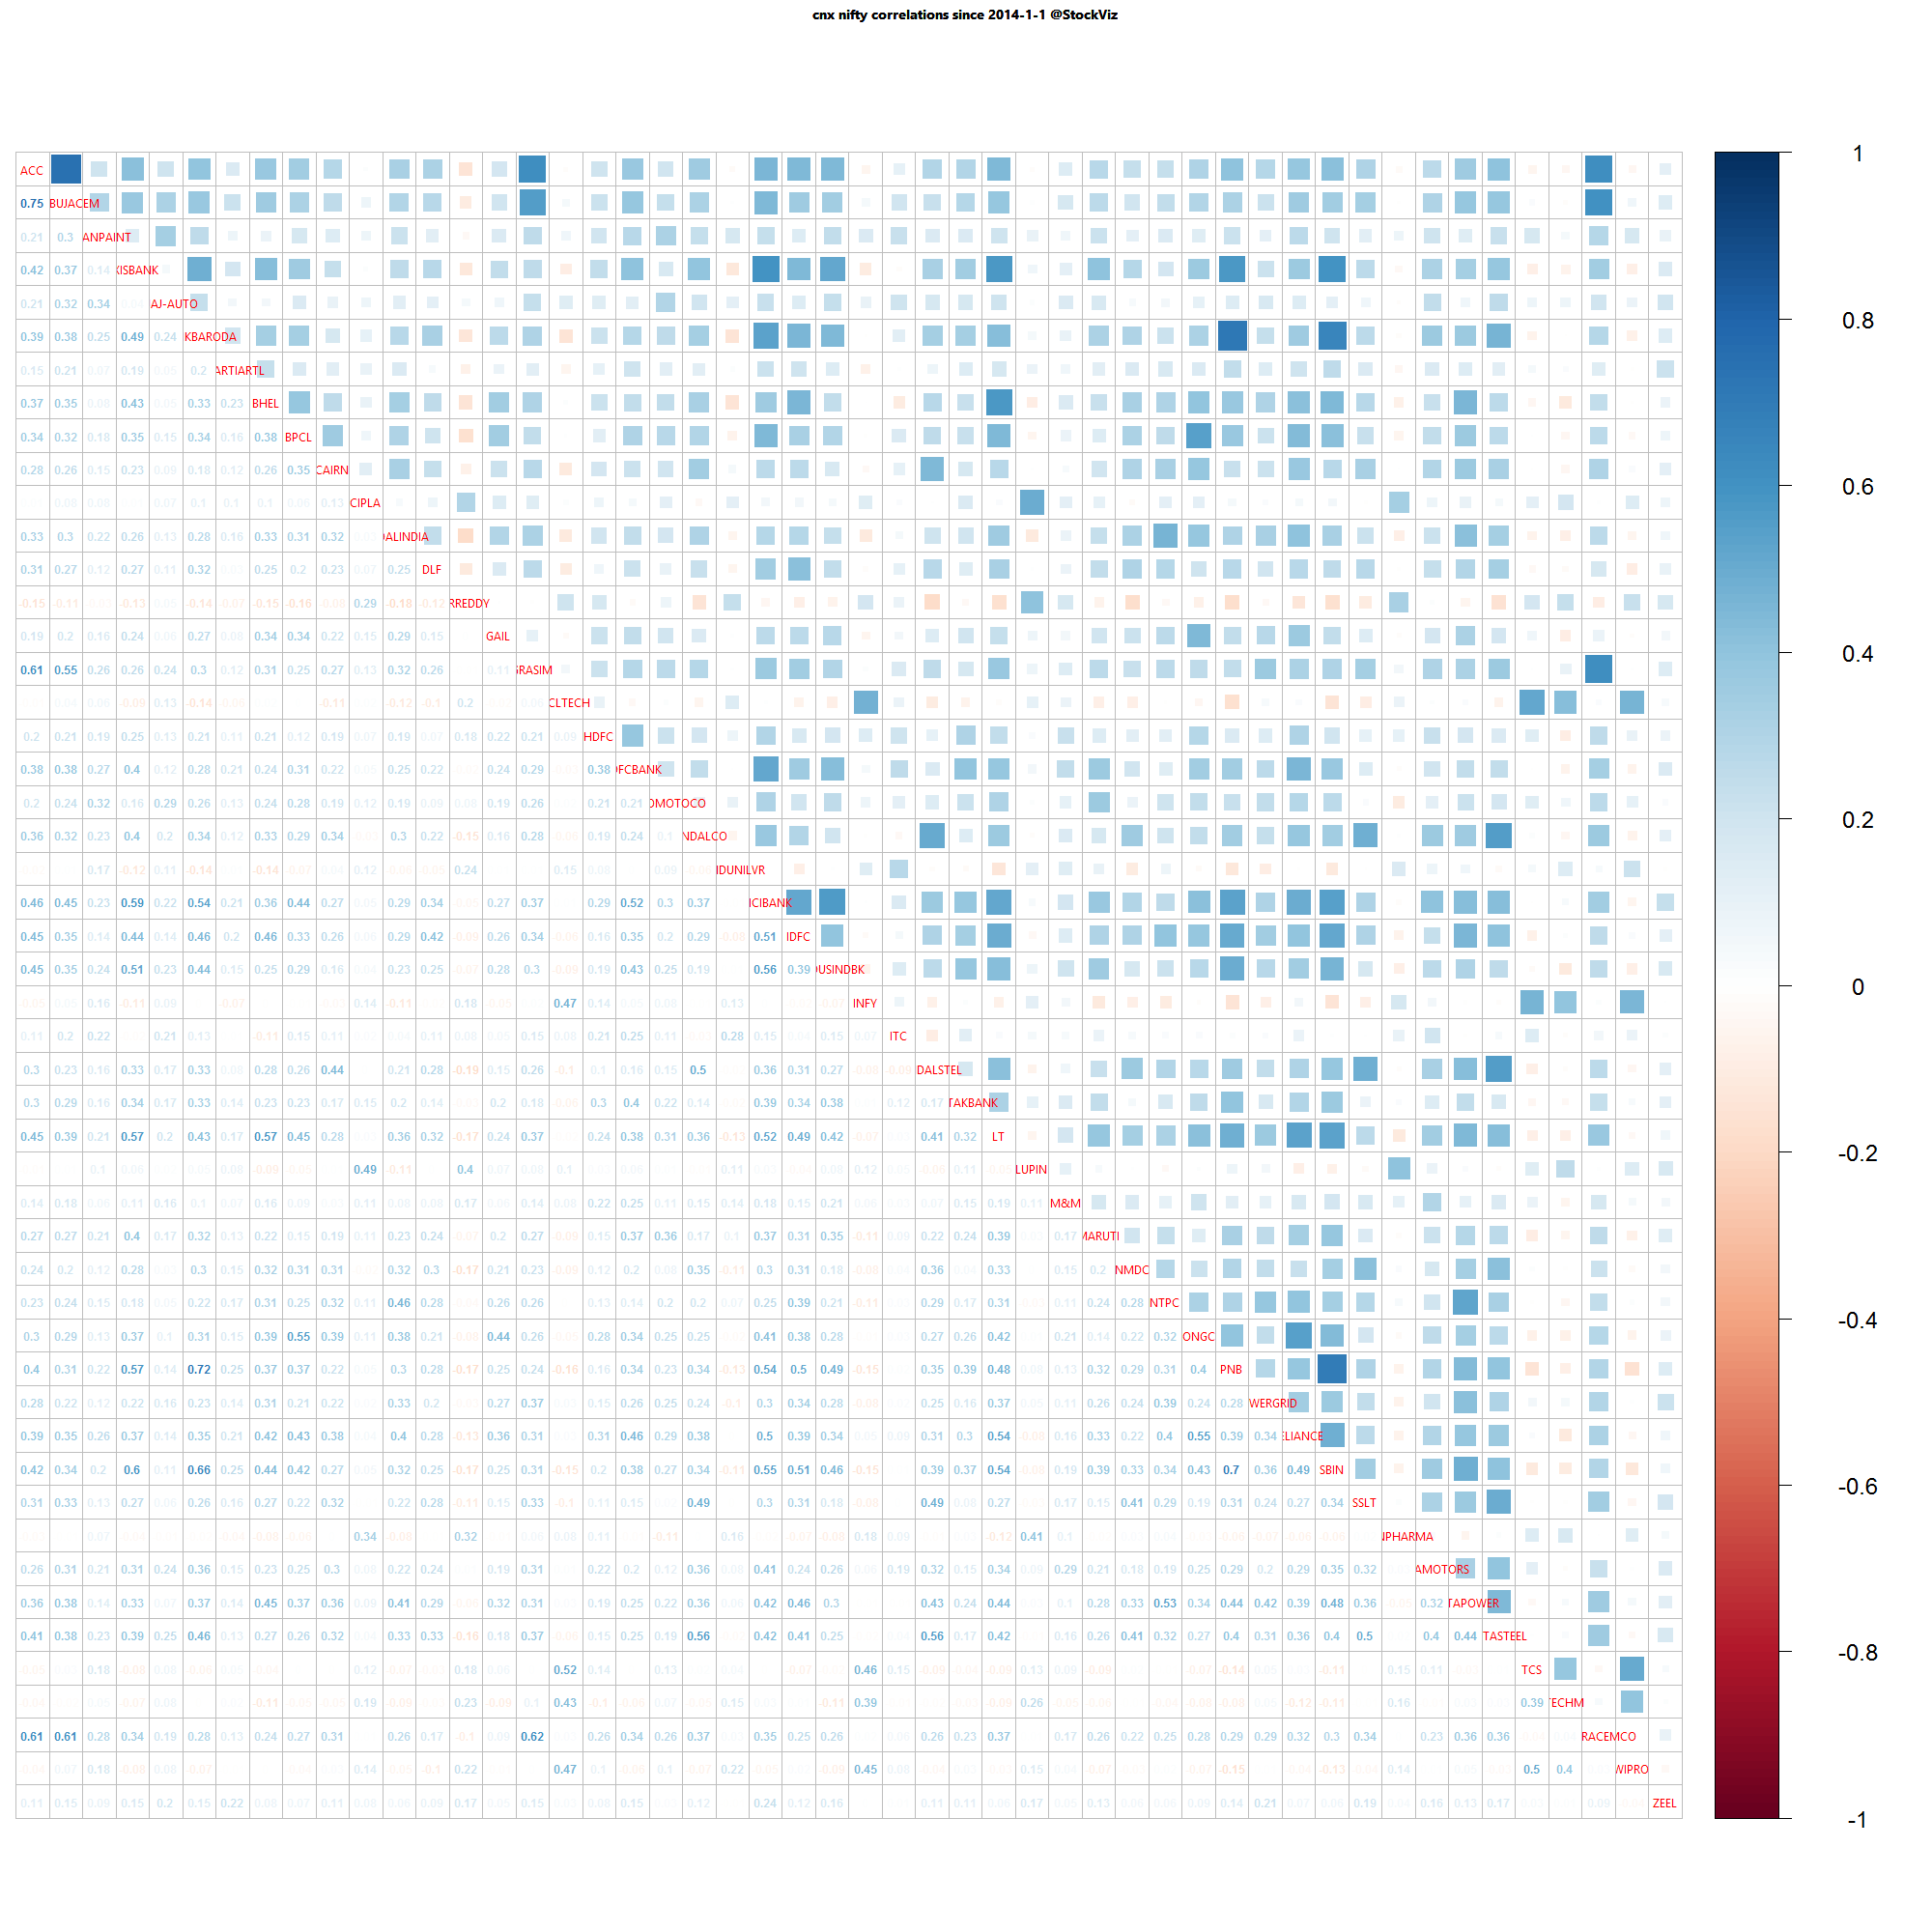
Nifty Heatmap

CNX NIFTY.2014-12-26.2015-1-02

Index Returns

index performance.2014-12-26.2015-1-02

Sector Performance

sector performance.2014-12-26.2015-1-02

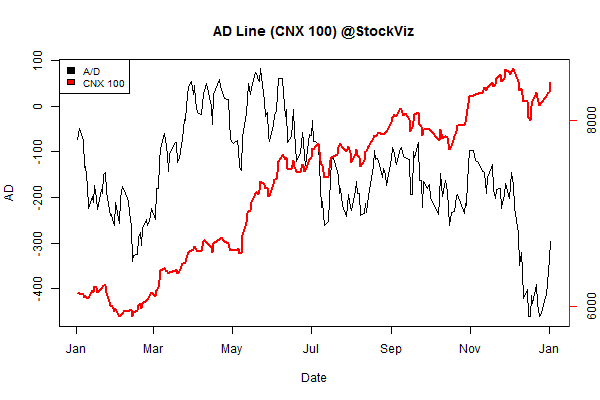
Advance Decline

advance.decline.line2.2014-12-26.2015-1-02

Market Cap Decile Performance

Decile Mkt. Cap. Adv/Decl
1 (micro) -0.44% 68/62
2 +4.13% 69/61
3 +3.59% 69/59
4 +5.05% 76/54
5 +4.83% 79/50
6 +4.44% 77/53
7 +4.12% 77/53
8 +4.33% 74/55
9 +3.88% 75/55
10 (mega) +1.77% 66/64
No child left behind?

Top Winners and Losers

BHEL +9.44%
ADANIPORTS +10.43%
LICHSGFIN +11.73%
BAJAJFINSV -2.59%
M&M -2.44%
GLENMARK -1.32%
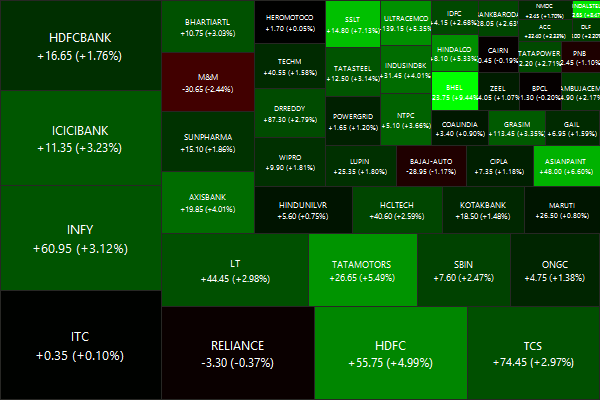
Presented without comment.

ETF Performance

JUNIORBEES +3.69%
INFRABEES +2.60%
BANKBEES +2.52%
NIFTYBEES +2.30%
PSUBNKBEES +2.25%
CPSEETF +1.78%
GOLDBEES -0.41%
The “gyan sangam” effect was good for a couple of points on the bank ETFs…

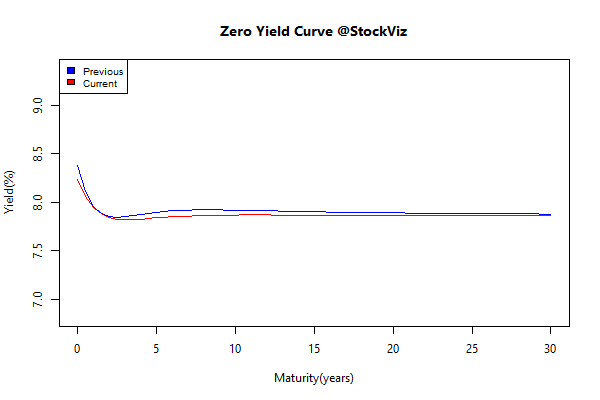
Yield Curve

yield Curve.2014-12-26.2015-1-02

Bond Indices

Sub Index Change in YTM Total Return(%)
GSEC TB +0.15 +0.11%
GSEC SUB 1-3 +0.04 +0.01%
GSEC SUB 3-8 -0.06 +0.25%
GSEC SUB 8 -0.05 +0.38%
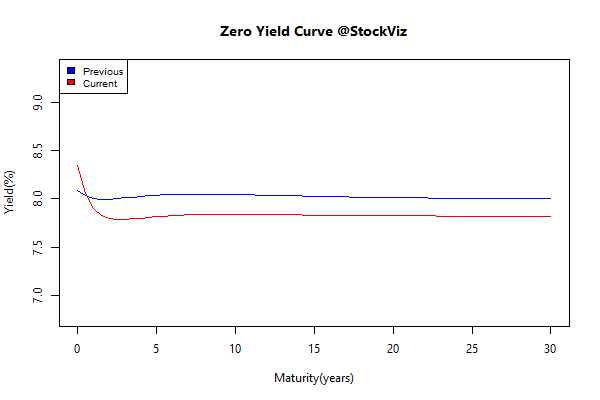
An inverted, flat curve with rate cuts fully baked in.

Investment Theme Performance

Thought for the weekend

Will Vladimir Putin pose naked to win back Russian affections?
Will China buy Venezuela?
Will Whole Foods open stores across India?
Will Kim Jong Un release a fitness video?

An Unserious Look at the Year Ahead

Strategies that rocked in 2014

WHAT IS A “THEME”?

A StockViz Investment Theme is a portfolio of stocks that follows a particular strategy. It is a convenient way for you to:

  1. stick to a strategy
  2. follow a preset rebalancing schedule
  3. think in terms of your portfolio strategy rather than individual stocks
  4. avoid common behavioral pitfalls
  5. systematically track your P&L and strategy performance

WHAT IS AN INVESTMENT STRATEGY?

An investment strategy is a specific way of going about the process of investing. It identifies specific variables that define a stock. Variables can be anything: risk, style, sector, balance-sheet items, etc..

By mapping specific Themes to your account, you ensure that you stay pure to your strategy allocation. And that there is no “flying by the seat of your pants” investing.

HOW HAVE YOUR THEMES PERFORMED?

We started 2014 with eight investment strategies. Here is how they performed:

It was one of those rare years when both momentum and value performed at the same time. The Modi-rally coincided nicely with the bottoming of the cycle.

Passive buy-and-hold

Implementing a strategy involves churn. For die-hard fans of the passive buy-and-hold clan, here’s how 2014 looked like:

PSUBNKBEES +71.37%
BANKBEES +64.94%
JUNIORBEES +43.70%
NIFTYBEES +31.57%
INFRABEES +25.83%
GOLDBEES -9.32%
Gold was a money loser and public-sector banks, in spite of all the bad loans and scams, out-performed the rest of the market by a mile.

WHAT SHOULD I DO NEXT?

You should open a demat account with StockViz and invest through our Themes.

Choices: Large-cap Investing

While looking at investing in large-cap stocks, investors have quite a few options available to them.

Mutual Funds

Previously, we discussed ‘Top 100’ funds — funds that invest in the largest market-cap stocks. This is one way to go about adding large-cap exposure to your portfolio. However, the expense ratios of more than 2% will eat into your returns. Remember, returns are not predictable, but fees are forever.

Passive ETFs

You can buy an equal proportion of the NIFTYBEES and the JUNIORBEES ETFs. Since these are exchange traded, you don’t have to go through the hassle of “surrendering” your mutual fund “units” and keeping track of exit-loads etc. Besides, NIFTYBEES’ expense ratio is 0.5% and JUNIORBEES’ 1%. Overall, you pay 0.75% to Goldman Sachs to manage the ETFs.

Not a bad deal, considering that you end up tracking the CNX 100 index which represents the top 100 stocks by market cap.

Active ETFs

We have a Theme that takes a tactical route when it comes to tracking the CNX 100 index. Its called the CNX 100 50-Day Tactical Theme. The basic idea is to switch between (NIFTYBEES + JUNIORBEES) and LIQUIDBEES depending on whether the CNX 100 index is trading above or below its 50-day moving average. Details of the strategy can be found here.

The drawback is that in flat markets, you end up getting whipsawed a lot. But if you have the discipline to stick with it for over 5-years, it has the ability to deliver superior risk-adjusted returns.

Conclusion

Each of the approaches described above have their advantages and disadvantages. With mutual funds, you have a brand-name manager who is working for you. With the passive route, you save on fees. The tactical route will probably lessen drawdowns during a market crash and preserve capital.

What you end up investing in finally boils down to whatever sails your boat.
Comparison: Top 100 Funds

Large-cap stocks

Large-cap stocks are less volatile, ceterus paribus, compared to mid-cap and small-cap stocks. For most first-time investors, the set of Top 100 Funds offers a straight-forward way of adding equity exposure.

Fund/Scheme IRR (2014) Expense
Birla Sun Life Top 100 Fund -Growth Option 48.27% 2.82%
ICICI Prudential Top 100 Fund – Regular Plan – Growth 37.71% 2.77%
IDBI India Top 100 Equity Fund Growth 40.05% 2.87%
UTI – TOP 100 Fund- Growth Option 40.68% 2.43%

Picking the right scheme

Birla Sun Life Top 100 Fund -Growth Option.performance

As an investor, you should care about two things: risk-adjusted returns and expenses. While the Birla fund gave better returns, it charged a higher fee compared to UTI. But are those higher returns sustainable? Investors should be willing to pay more for more. This is where the FundCompare tool can help.

Birla vs. UTI

Birla vs. UTI Top 100

Between 2009-07-01 and 2014-12-29, Birla Sun Life Top 100 Fund (Growth Option) has returned a cumulative 155.00% with an IRR of 18.56% vs. UTI TOP 100 Fund (Growth Option)’s cumulative return of 108.35% and an IRR of 14.28%.

On the face of it, Birla’s higher fees seems worth it. But it looks like higher returns came at the expense of higher risk. Birla’s beta (vs. CNX 100) is 0.90761 vs. UTI’s 0.83478 and the latter had deeper drawdowns as well. However, the Sortino Ratio tilts the scale towards Birla’s fund: 0.10762 vs. UTI’s 0.09043.

Conclusion

If you are looking for large-cap exposure then go for Birla Sun Life Top 100 Fund.