Introduction
Our previous post looked at the 10 best mutual funds based on sharpe ratio, bear-beta, information ratio, draw-down depth and draw-down length between Jan-2010 and May-2015. Here are the 10 worst funds based on the same metrics.
As you can imagine, infrastructure funds performed poorly in this time-frame. We ignore them for now.
Sharpe Ratio
Fund | SHARPE | IRR |
---|---|---|
0.00
|
-0.16
|
|
0.01
|
0.23
|
|
0.01
|
0.79
|
|
0.02
|
1.18
|
|
0.02
|
0.87
|
|
0.02
|
1.56
|
|
0.02
|
1.37
|
|
0.02
|
1.38
|
|
0.02
|
1.69
|
|
0.02
|
1.56
|
Bear-Beta
Fund | BETA BEAR | IRR |
---|---|---|
1.19
|
1.18
|
|
1.12
|
3.11
|
|
1.05
|
5.74
|
|
1.03
|
0.23
|
|
1.01
|
1.69
|
|
1.00
|
4.32
|
|
0.97
|
5.79
|
|
0.96
|
2.02
|
|
0.95
|
1.56
|
|
0.93
|
7.76
|
Information Ratio
Fund | IR | IRR |
---|---|---|
-1.14
|
0.23
|
|
-0.81
|
0.79
|
|
-0.75
|
0.87
|
|
-0.75
|
-0.16
|
|
-0.67
|
1.18
|
|
-0.62
|
1.37
|
|
-0.51
|
1.49
|
|
-0.49
|
1.71
|
|
-0.49
|
1.56
|
|
-0.48
|
1.57
|
Draw-down Depth
Fund | DRAW DEPTH | IRR |
---|---|---|
-54.39
|
1.18
|
|
-52.28
|
3.11
|
|
-51.83
|
0.23
|
|
-46.87
|
0.79
|
|
-44.69
|
5.79
|
|
-42.41
|
1.56
|
|
-42.38
|
1.69
|
|
-41.63
|
0.87
|
|
-40.74
|
8.64
|
|
-40.61
|
5.74
|
Draw-down Length
Fund | DRAW LENGTH | IRR |
---|---|---|
1092.00
|
0.23
|
|
932.00
|
0.79
|
|
842.00
|
5.79
|
|
840.00
|
1.56
|
|
838.00
|
1.18
|
|
824.00
|
0.87
|
|
822.00
|
2.42
|
|
820.00
|
3.11
|
|
808.00
|
2.02
|
|
807.00
|
2.06
|
Past Performance
Fund | BETA | IRR |
---|---|---|
0.52
|
-0.16
|
|
1.09
|
0.23
|
|
0.82
|
0.79
|
|
0.84
|
0.87
|
|
1.01
|
1.12
|
|
1.18
|
1.18
|
|
0.85
|
1.37
|
|
0.73
|
1.38
|
|
0.26
|
1.44
|
|
0.75
|
1.49
|
Conclusion
Mutual funds are marketed as wealth builders. However, the truth is that most of them struggle. As you can see from the analysis here, there are quite a few of them with low-single-digit returns over 5-year time-frames. At last count, there were more than 5300 different schemes that you could choose from.
Are you getting the right advise? Get in touch with us if you are looking to invest! Call us or Whatsapp us at +918026650232
Introduction
Mutual fund investors are faced with a zillion choices in the marketplace. At last count, there were more than 5300 different schemes that an investor could choose from. When confronted with such a large number of choices, investors either spiral into an “analysis paralysis” mode and end up doing nothing or blindly invest in whatever their broker recommends – both these paths lead to situations that are injurious to the investor’s long-term financial health.
In this post, we try to simplify the choices in front of the investor by ranking the top 10 funds based these risk metrics: sharpe ratio, bear-beta, information ratio, draw-down depth and draw-down length between Jan-2010 and May-2015.
Sharpe Ratio
Fund | SHARPE | IRR |
---|---|---|
0.35
|
2.12
|
|
0.10
|
24.25
|
|
0.09
|
17.14
|
|
0.08
|
3.87
|
|
0.08
|
2.14
|
|
0.08
|
3.67
|
|
0.07
|
5.79
|
|
0.07
|
17.29
|
|
0.07
|
5.57
|
|
0.07
|
8.11
|
Glad to see the two MNC funds that we have been recommending our clients make the top end of this list.
But also note the single digit IRR funds.
Bear-Beta
Fund | BETA BEAR | IRR |
---|---|---|
-0.03
|
2.12
|
|
0.05
|
4.81
|
|
0.08
|
1.56
|
|
0.20
|
2.14
|
|
0.25
|
3.87
|
|
0.27
|
2.71
|
|
0.30
|
3.67
|
|
0.33
|
2.81
|
|
0.37
|
2.86
|
|
0.41
|
2.37
|
Given the single digit IRRs that test will for this metric, investors can ignore the bear-beta.
Information Ratio
Fund | IR | IRR |
---|---|---|
2.05
|
15.96
|
|
1.95
|
13.96
|
|
1.84
|
16.84
|
|
1.83
|
17.31
|
|
1.73
|
13.27
|
|
1.71
|
15.23
|
|
1.69
|
12.55
|
|
1.57
|
24.25
|
|
1.55
|
13.35
|
|
1.53
|
17.29
|
This is probably a better metric than the Sharpe ratio to rank funds.
Nice to see that both the Value Discovery fund and an MNC fund make this list.
Draw-down Depth
Fund | DRAW DEPTH | IRR |
---|---|---|
-0.35
|
2.12
|
|
-7.46
|
3.87
|
|
-9.69
|
2.14
|
|
-10.87
|
3.67
|
|
-11.57
|
2.81
|
|
-12.05
|
2.71
|
|
-12.06
|
2.86
|
|
-13.00
|
5.57
|
|
-13.26
|
7.30
|
|
-13.81
|
2.37
|
For example, the Blended Plan at the top of the list only lost 0.35% from its peak valuation between 2010 and 2015.
Portfolios with a lot of short-term bonds test well for this metric. But note the pathetic IRRs – no pain = no gain!
Draw-down Length
Fund | DRAW LENGTH | IRR |
---|---|---|
110.00
|
2.86
|
|
126.00
|
8.11
|
|
126.00
|
7.30
|
|
128.00
|
5.57
|
|
140.00
|
17.14
|
|
141.00
|
24.25
|
|
158.00
|
3.67
|
|
190.00
|
4.81
|
|
194.00
|
1.71
|
|
207.00
|
1.44
|
Shorter bounce-backs typically indicate high-quality portfolios.
Nice to see both the MNC funds make this list.
Past Performance
Fund | BETA | IRR |
---|---|---|
0.55
|
24.25
|
|
0.78
|
17.31
|
|
0.69
|
17.29
|
|
0.54
|
17.14
|
|
0.73
|
16.84
|
|
0.76
|
15.96
|
|
0.76
|
15.23
|
|
0.80
|
13.96
|
|
0.74
|
13.35
|
|
0.78
|
13.27
|
Conclusion
We looked at broad spectrum of funds – including those with bond allocations – to ferret out a good set of funds that investors can consider. Depending on what is more important to the investor, the appropriate set of metrics can be weighted to fit individual risk appetites.
Mutual fund investors whom we advise will immediately recognize some of these funds as they are already part of their portfolios. Get in touch with us if you are looking to invest! Call us or Whatsapp us at +918026650232
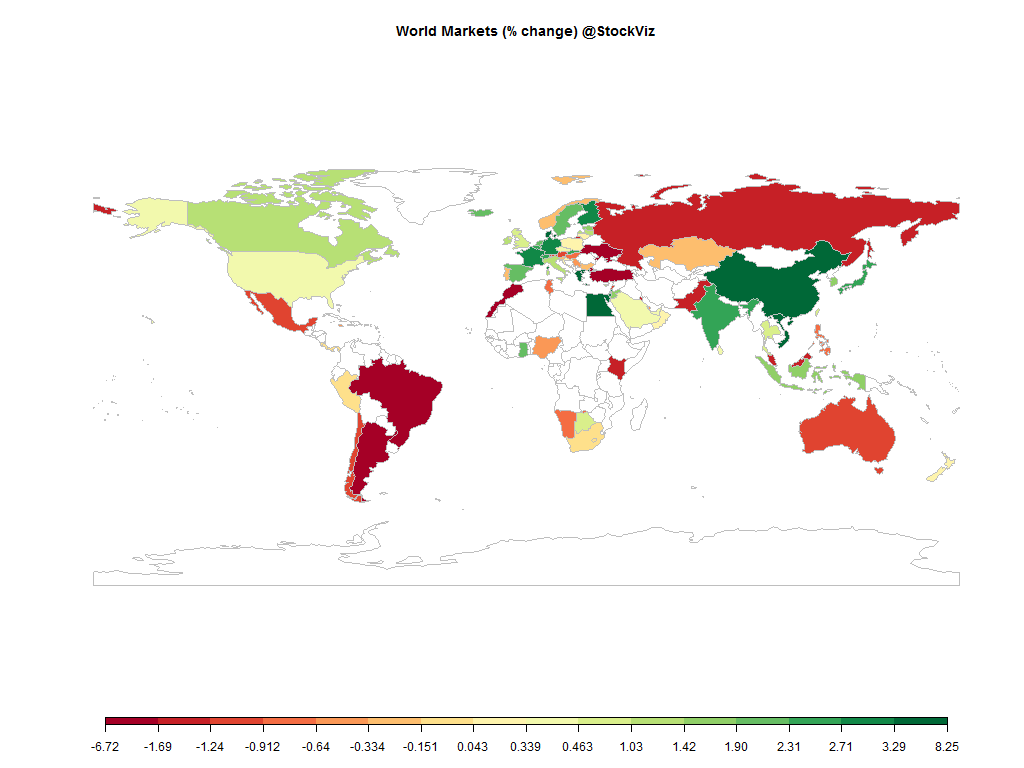
Equities
MINTs | |
---|---|
JCI(IDN) | +1.68% |
INMEX(MEX) | -0.92% |
NGSEINDX(NGA) | -0.49% |
XU030(TUR) | -2.35% |
BRICS | |
---|---|
IBOV(BRA) | -5.07% |
SHCOMP(CHN) | +8.10% |
NIFTY(IND) | +2.38% |
INDEXCF(RUS) | -1.53% |
TOP40(ZAF) | -0.10% |
Commodities
Energy | |
---|---|
Ethanol | -6.26% |
WTI Crude Oil | +0.69% |
Heating Oil | -2.32% |
Natural Gas | -4.60% |
RBOB Gasoline | +0.78% |
Brent Crude Oil | -1.96% |
Metals | |
---|---|
Gold 100oz | -0.95% |
Palladium | -1.45% |
Platinum | -1.95% |
Copper | -4.41% |
Silver 5000oz | -2.29% |
Currencies
MINTs | |
---|---|
USDIDR(IDN) | +0.57% |
USDMXN(MEX) | +1.67% |
USDNGN(NGA) | +0.76% |
USDTRY(TUR) | +0.86% |
BRICS | |
---|---|
USDBRL(BRA) | +3.75% |
USDCNY(CHN) | -0.15% |
USDINR(IND) | +0.01% |
USDRUB(RUS) | +1.27% |
USDZAR(ZAF) | +1.00% |
Agricultural | |
---|---|
Feeder Cattle | +0.59% |
Orange Juice | +5.82% |
Soybean Meal | +0.30% |
Soybeans | -2.83% |
Sugar #11 | -4.12% |
Wheat | +0.98% |
White Sugar | -4.33% |
Cattle | -0.21% |
Cocoa | +2.18% |
Coffee (Arabica) | -7.87% |
Coffee (Robusta) | -3.06% |
Corn | -1.37% |
Cotton | -5.07% |
Lumber | +14.50% |
Lean Hogs | +0.66% |
Credit Indices
Index | Change |
---|---|
Markit CDX EM | +0.21% |
Markit CDX NA HY | -0.07% |
Markit CDX NA IG | +0.44% |
Markit iTraxx Asia ex-Japan IG | -3.17% |
Markit iTraxx Australia | -0.76% |
Markit iTraxx Europe | -0.88% |
Markit iTraxx Europe Crossover | -6.29% |
Markit iTraxx Japan | -1.17% |
Markit iTraxx SovX Western Europe | -0.04% |
Markit LCDX (Loan CDS) | +0.00% |
Markit MCDX (Municipal CDS) | +1.77% |
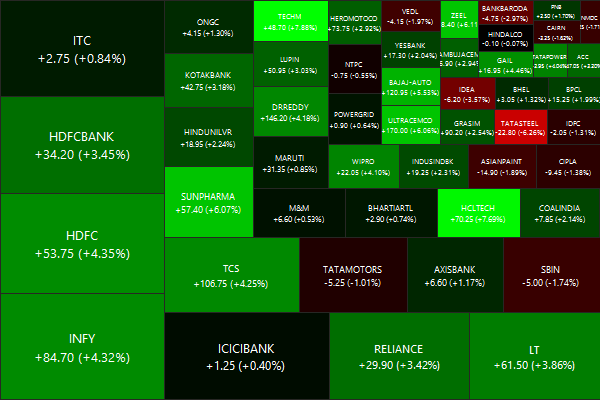
Nifty Heatmap
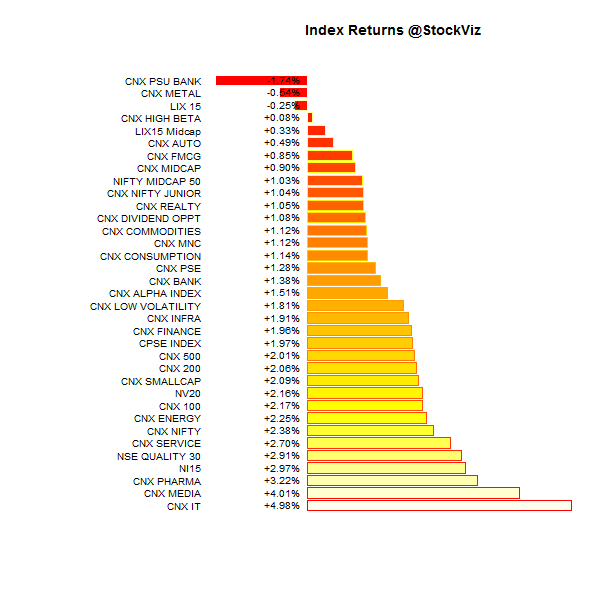
Index Returns
For a deeper dive into indices, check out our weekly Index Update.
Sector Performance
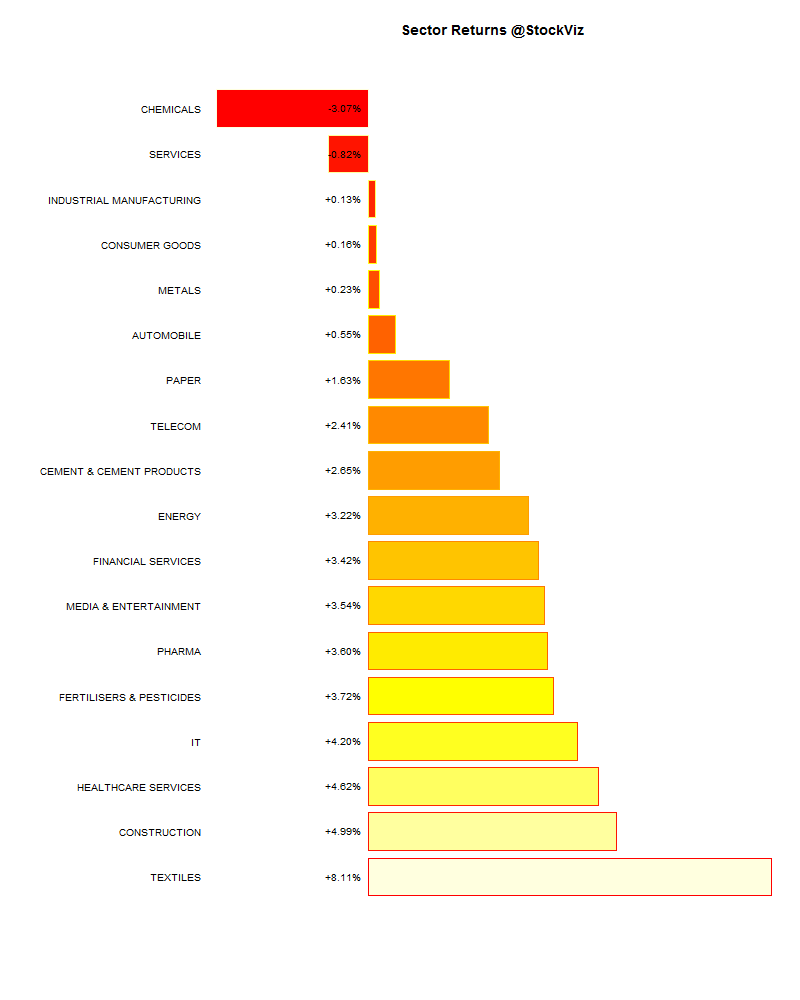
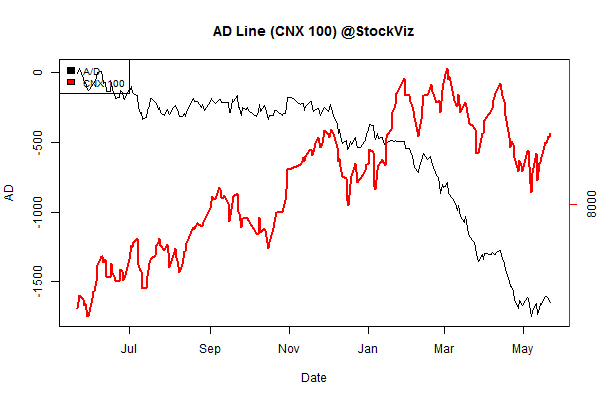
Advance Decline
Market Cap Decile Performance
Decile | Mkt. Cap. | Adv/Decl |
---|---|---|
1 (micro) | -1.51% | 66/62 |
2 | -0.05% | 69/59 |
3 | +2.14% | 76/51 |
4 | +2.33% | 73/55 |
5 | +2.22% | 72/55 |
6 | +1.23% | 69/59 |
7 | +2.07% | 62/66 |
8 | +2.42% | 68/59 |
9 | +1.44% | 68/60 |
10 (mega) | +2.14% | 61/67 |
Top Winners and Losers
ETF Performance
CPSEETF | +1.97% |
NIFTYBEES | +1.73% |
JUNIORBEES | +1.66% |
INFRABEES | +1.05% |
BANKBEES | +0.98% |
PSUBNKBEES | -0.66% |
GOLDBEES | -0.91% |
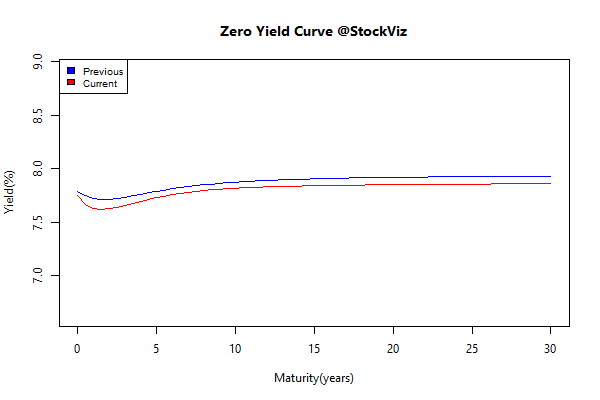
Yield Curve
Bond Indices
Sub Index | Change in YTM | Total Return(%) |
---|---|---|
GSEC TB | -0.18 | +0.20% |
GSEC SUB 1-3 | -0.01 | +0.33% |
GSEC SUB 3-8 | -0.04 | +0.42% |
GSEC SUB 8 | -0.04 | +0.56% |
Investment Theme Performance
Momentum | +2.95% |
CNX 100 Enterprise Yield | +2.89% |
Low Volatility | +2.62% |
ASK Life | +1.89% |
Balance Sheet Strength | +1.80% |
Financial Strength Value | +1.57% |
Magic Formula | +1.41% |
Textile, Metals, Chemicals, Paper and Energy Quality to Price | +0.99% |
PPFAS Long Term Value | +0.73% |
ADAG stocks | +0.64% |
Auto and Consumer Goods Quality to Price | +0.61% |
Quality to Price | +0.48% |
The RBI Restricted List | +0.26% |
Next Trillion | +0.07% |
Tactical CNX 100 | +0.00% |
High Beta | -0.39% |
Media, Health, IT, Telecom, Services, Pharma Quality To Price | -0.41% |
Equity Mutual Funds
Bond Mutual Funds
Thought for the weekend
From the mid-1980’s when PC’s and other hi-tech products first started being assembled in Asia, in places like Taiwan, Hong Kong, Singapore, Thailand and Malaysia, through 2010, after China had achieved the dominant manufacturing position it holds, the airfreight markets became increasingly reliant on the market for getting hi-tech goods built and assembled in Asia to North America and also to Europe.
…
The iPads and other Android-based and Windows-devices both usurped and combined many of the functions previously reserved for the PC platform or other dedicated electronic devices. Emerging from the Great Recession, these increasingly smaller, more powerful, alternative devices with their myriads of “apps” began to offer multiple capabilities on one platform that delivered capabilities which had previously taken multiple devices to deliver. This factor also significantly changed the dynamics of the airfreight markets.
Source: Avondale Asset Management
MOMENTUM
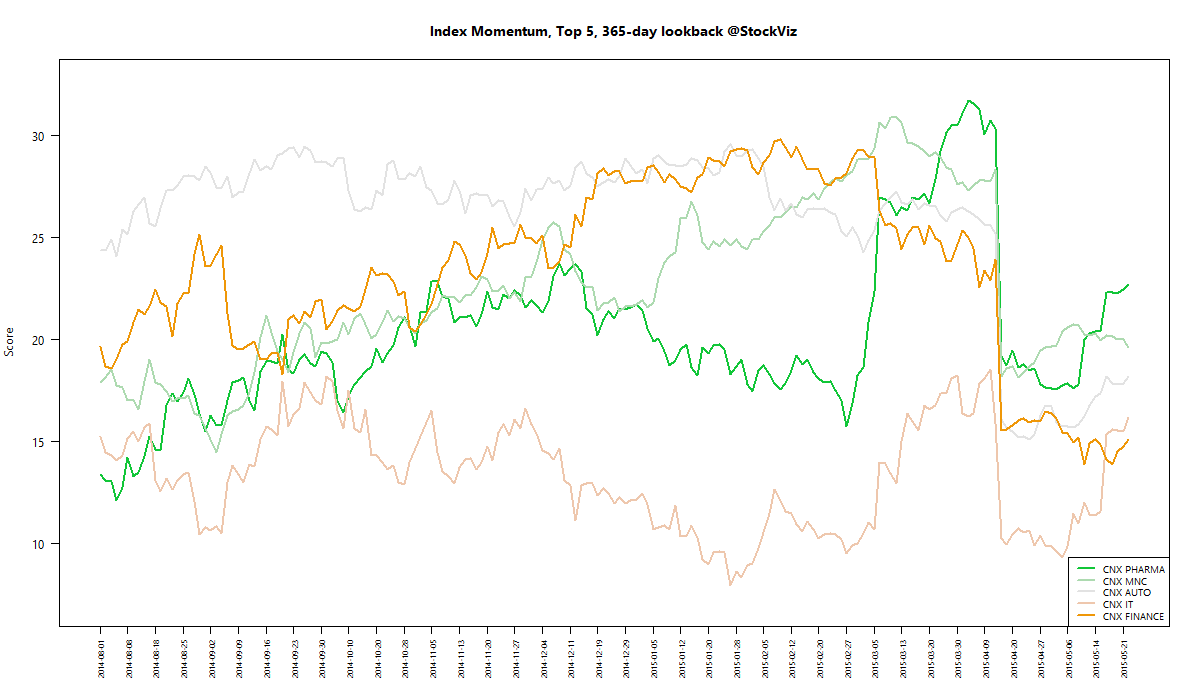
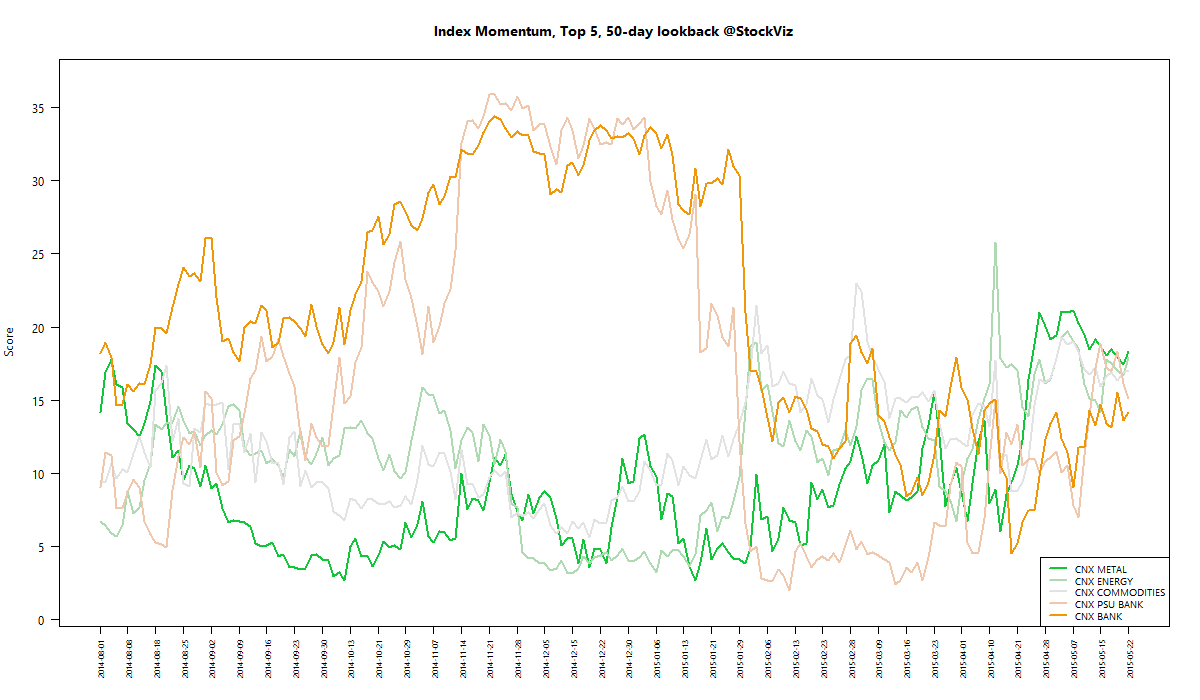
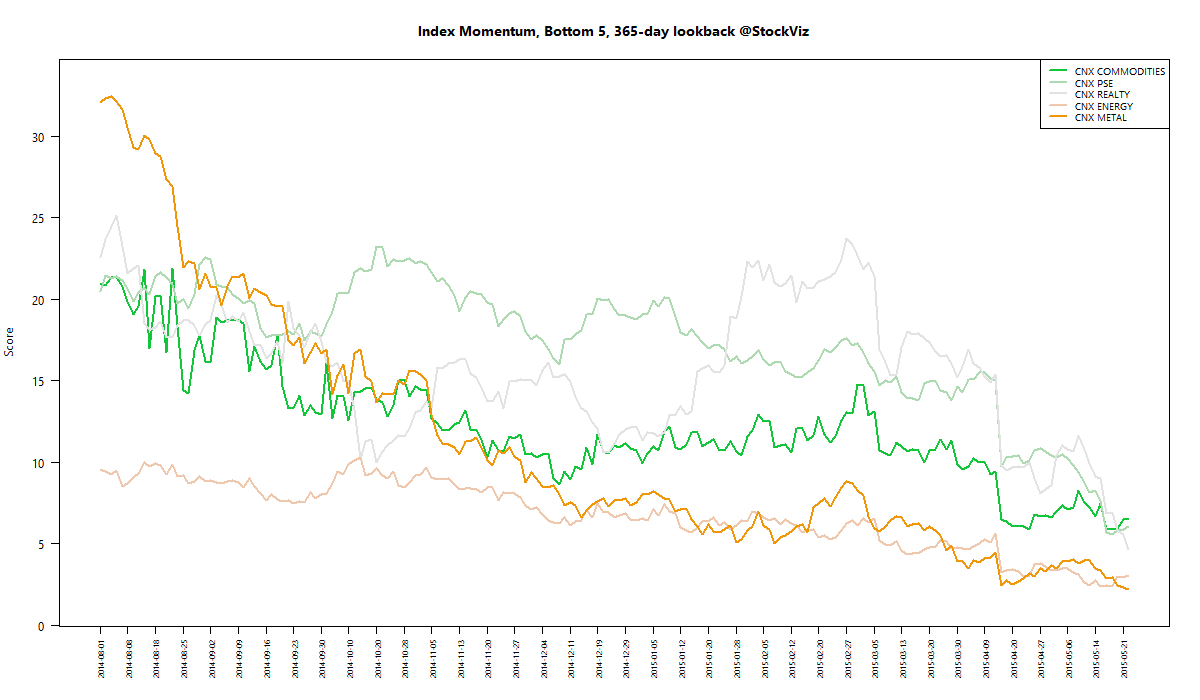
We run our proprietary momentum scoring algorithm on indices just like we do on stocks. You can use the momentum scores of sub-indices to get a sense for which sectors have the wind on their backs and those that are facing headwinds.
Traders can pick their longs in sectors with high short-term momentum and their shorts in sectors with low momentum. Investors can use the longer lookback scores to position themselves using our re-factored index Themes.
You can see how the momentum algorithm has performed on individual stocks here.
Here are the best and the worst sub-indices:
Refactored Index Performance
50-day performance, from March 10, 2015 through May 22, 2015:
Trend Model Summary
Index | Signal | % From Peak | Day of Peak |
---|---|---|---|
CNX AUTO | SHORT |
5.69
|
2015-Jan-27
|
CNX BANK | SHORT |
10.32
|
2015-Jan-27
|
CNX ENERGY | SHORT |
29.07
|
2008-Jan-14
|
CNX FMCG | SHORT |
9.54
|
2015-Feb-25
|
CNX INFRA | SHORT |
49.37
|
2008-Jan-09
|
CNX IT | SHORT |
87.72
|
2000-Feb-21
|
CNX MEDIA | SHORT |
29.01
|
2008-Jan-04
|
CNX METAL | SHORT |
56.14
|
2008-Jan-04
|
CNX MNC | SHORT |
3.97
|
2015-Mar-12
|
CNX NIFTY | SHORT |
5.97
|
2015-Mar-03
|
CNX PHARMA | SHORT |
8.25
|
2015-Apr-08
|
CNX PSE | SHORT |
26.16
|
2008-Jan-04
|
CNX REALTY | SHORT |
89.23
|
2008-Jan-14
|
And boy-oh-boy! MNCs have more or less covered their draw-down.
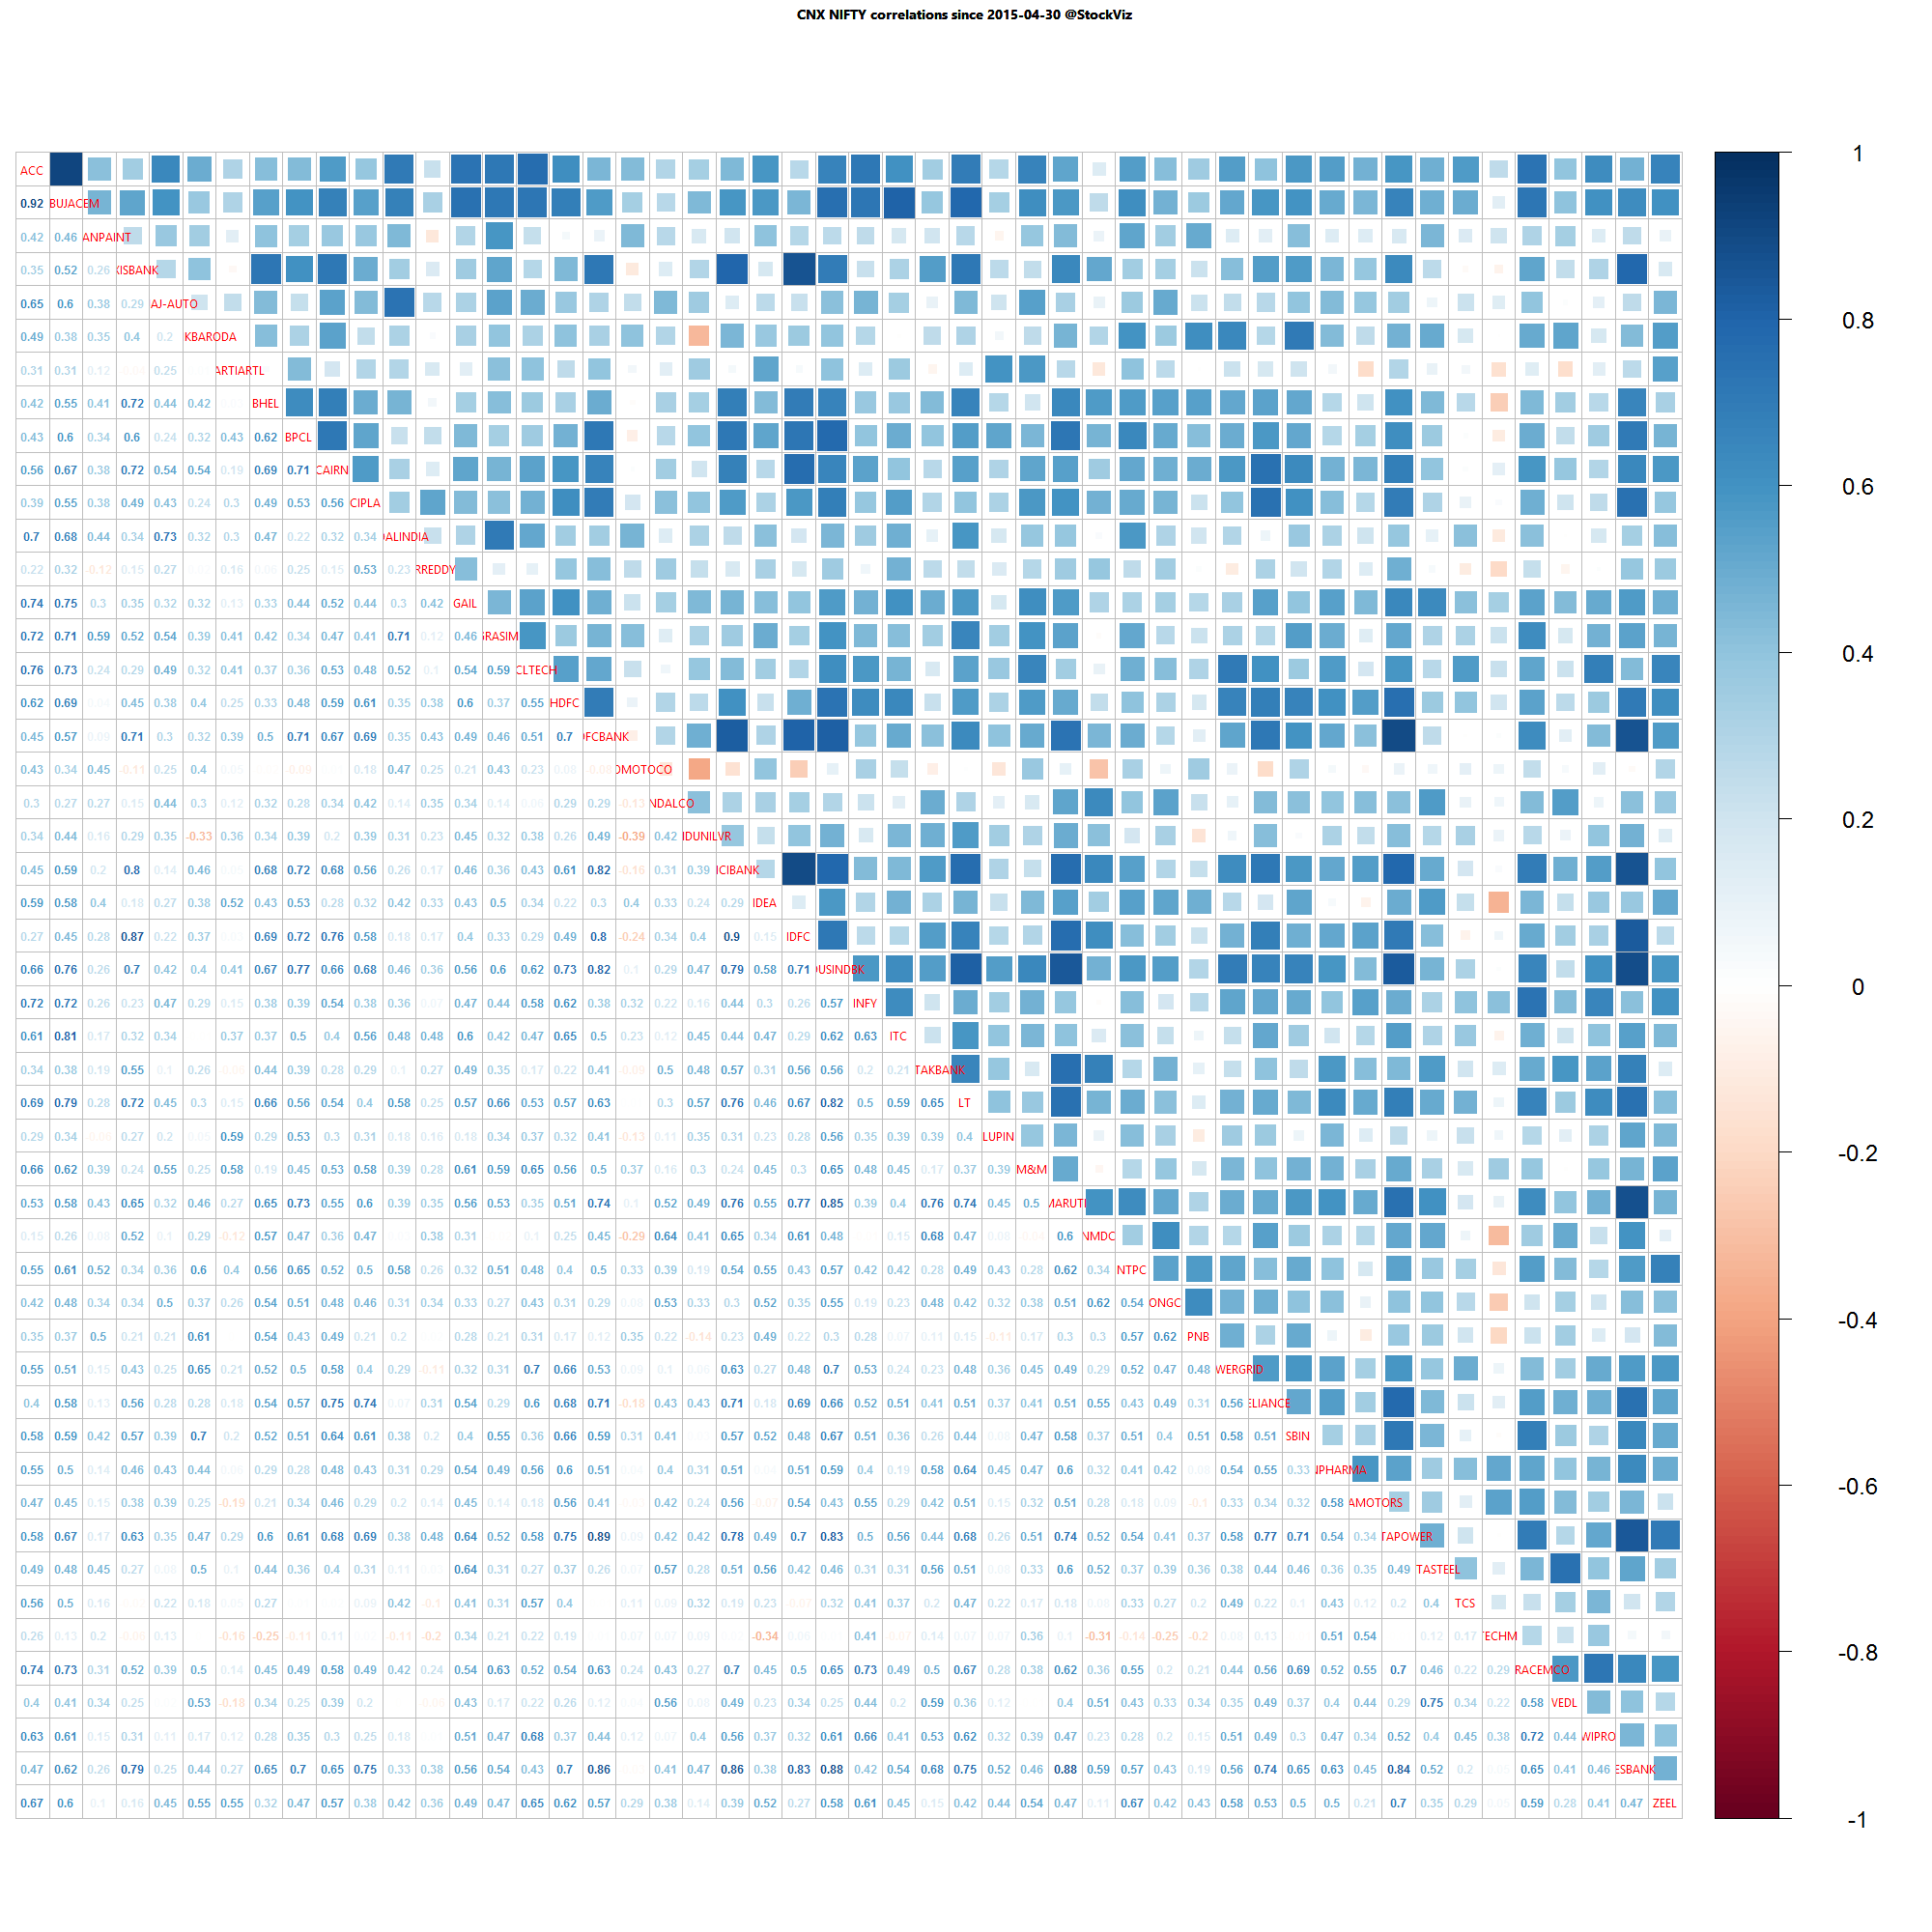
Nifty one year daily return correlations
Nifty one month daily return correlations
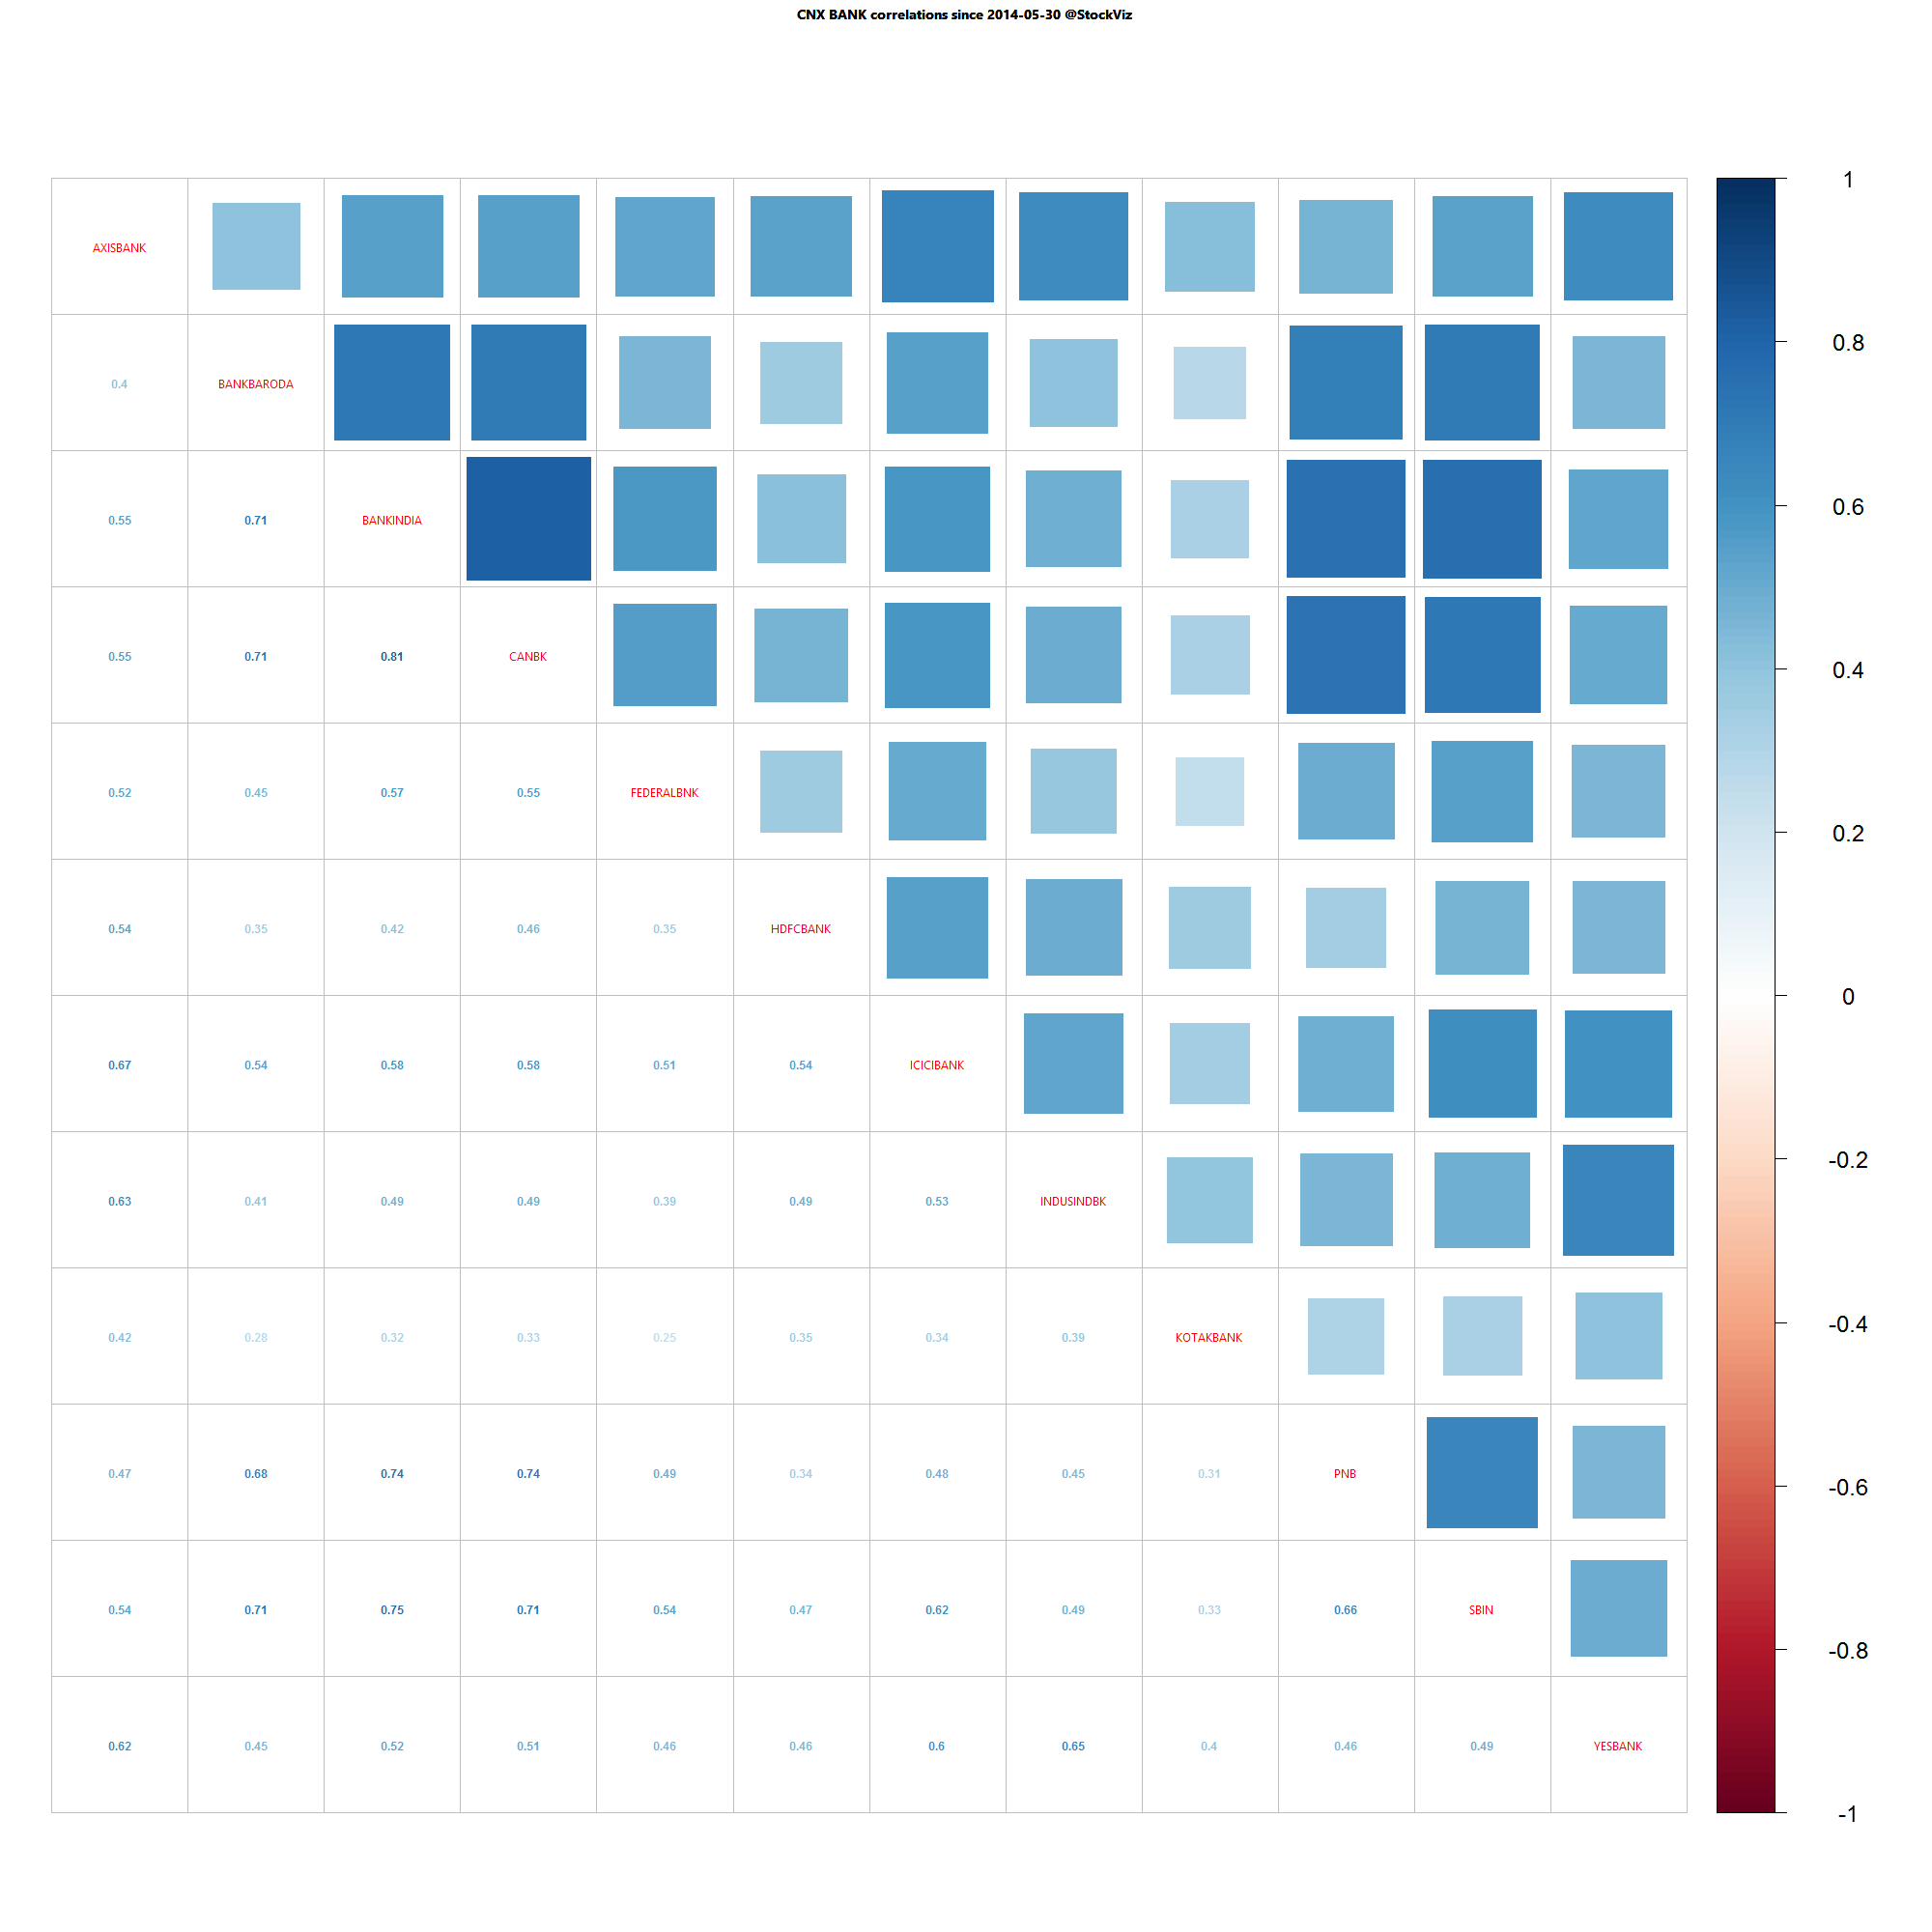
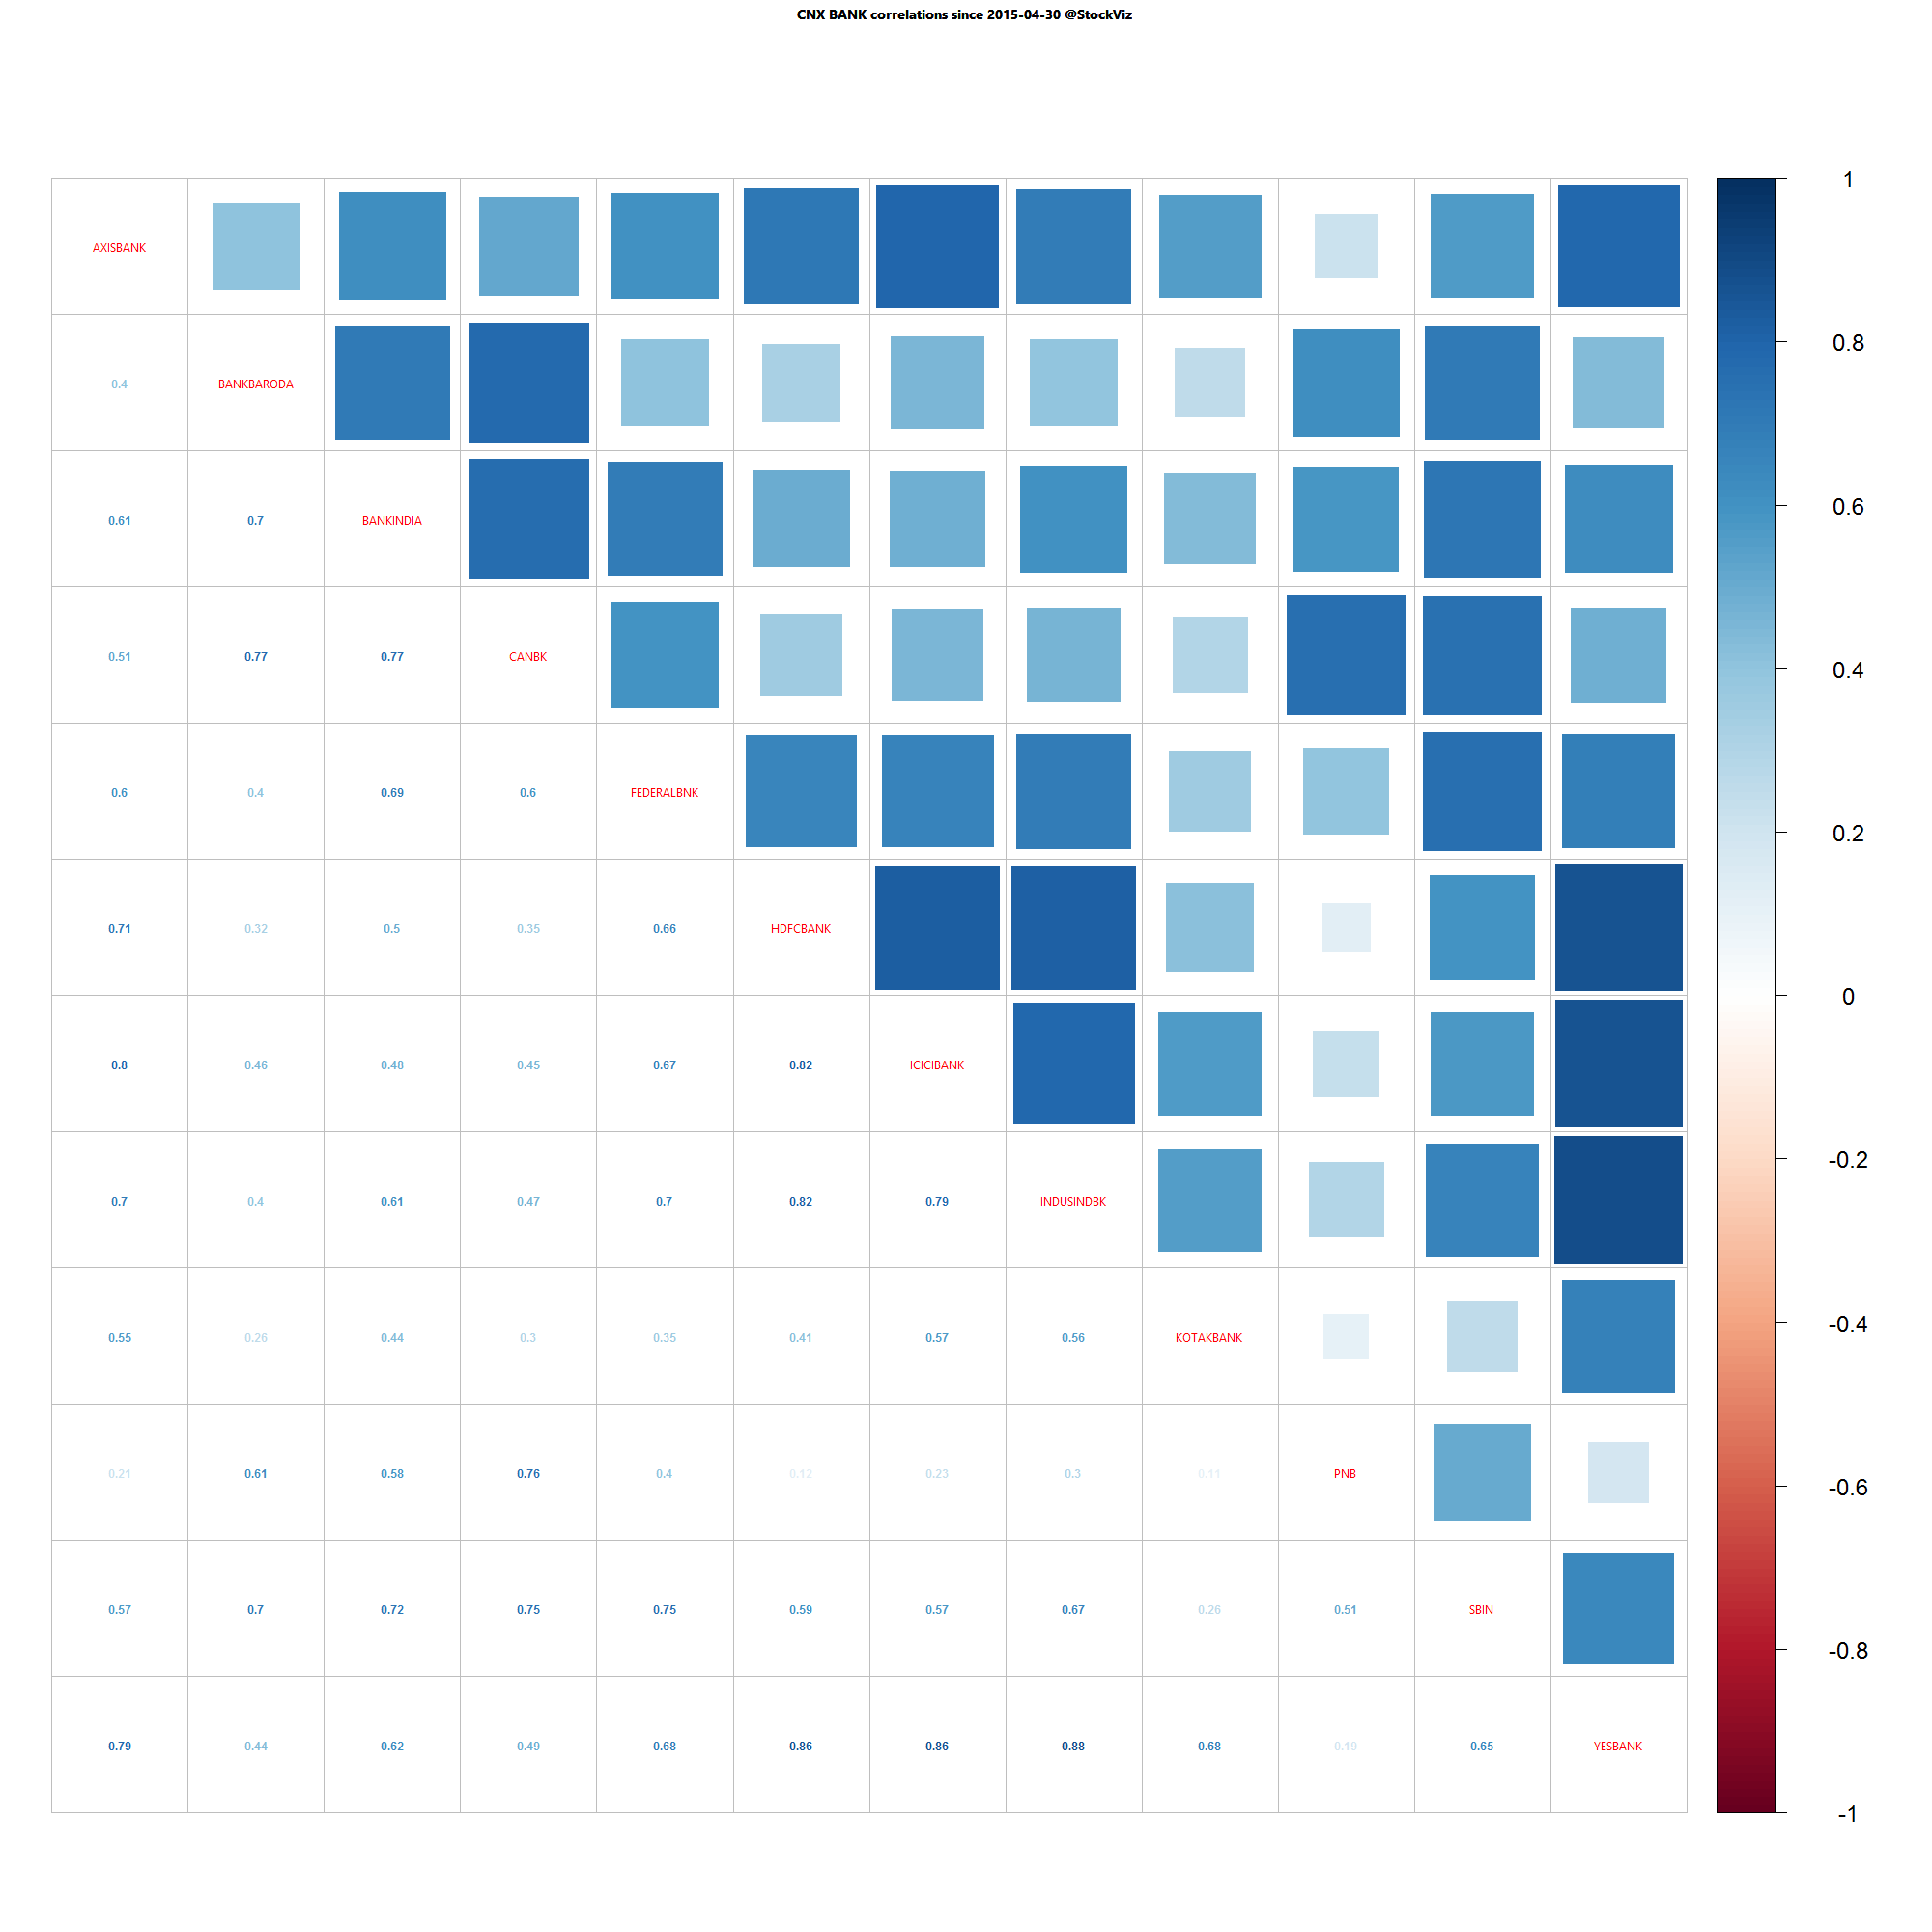
Bank Nifty one year daily return correlations
Bank Nifty one month daily return correlations
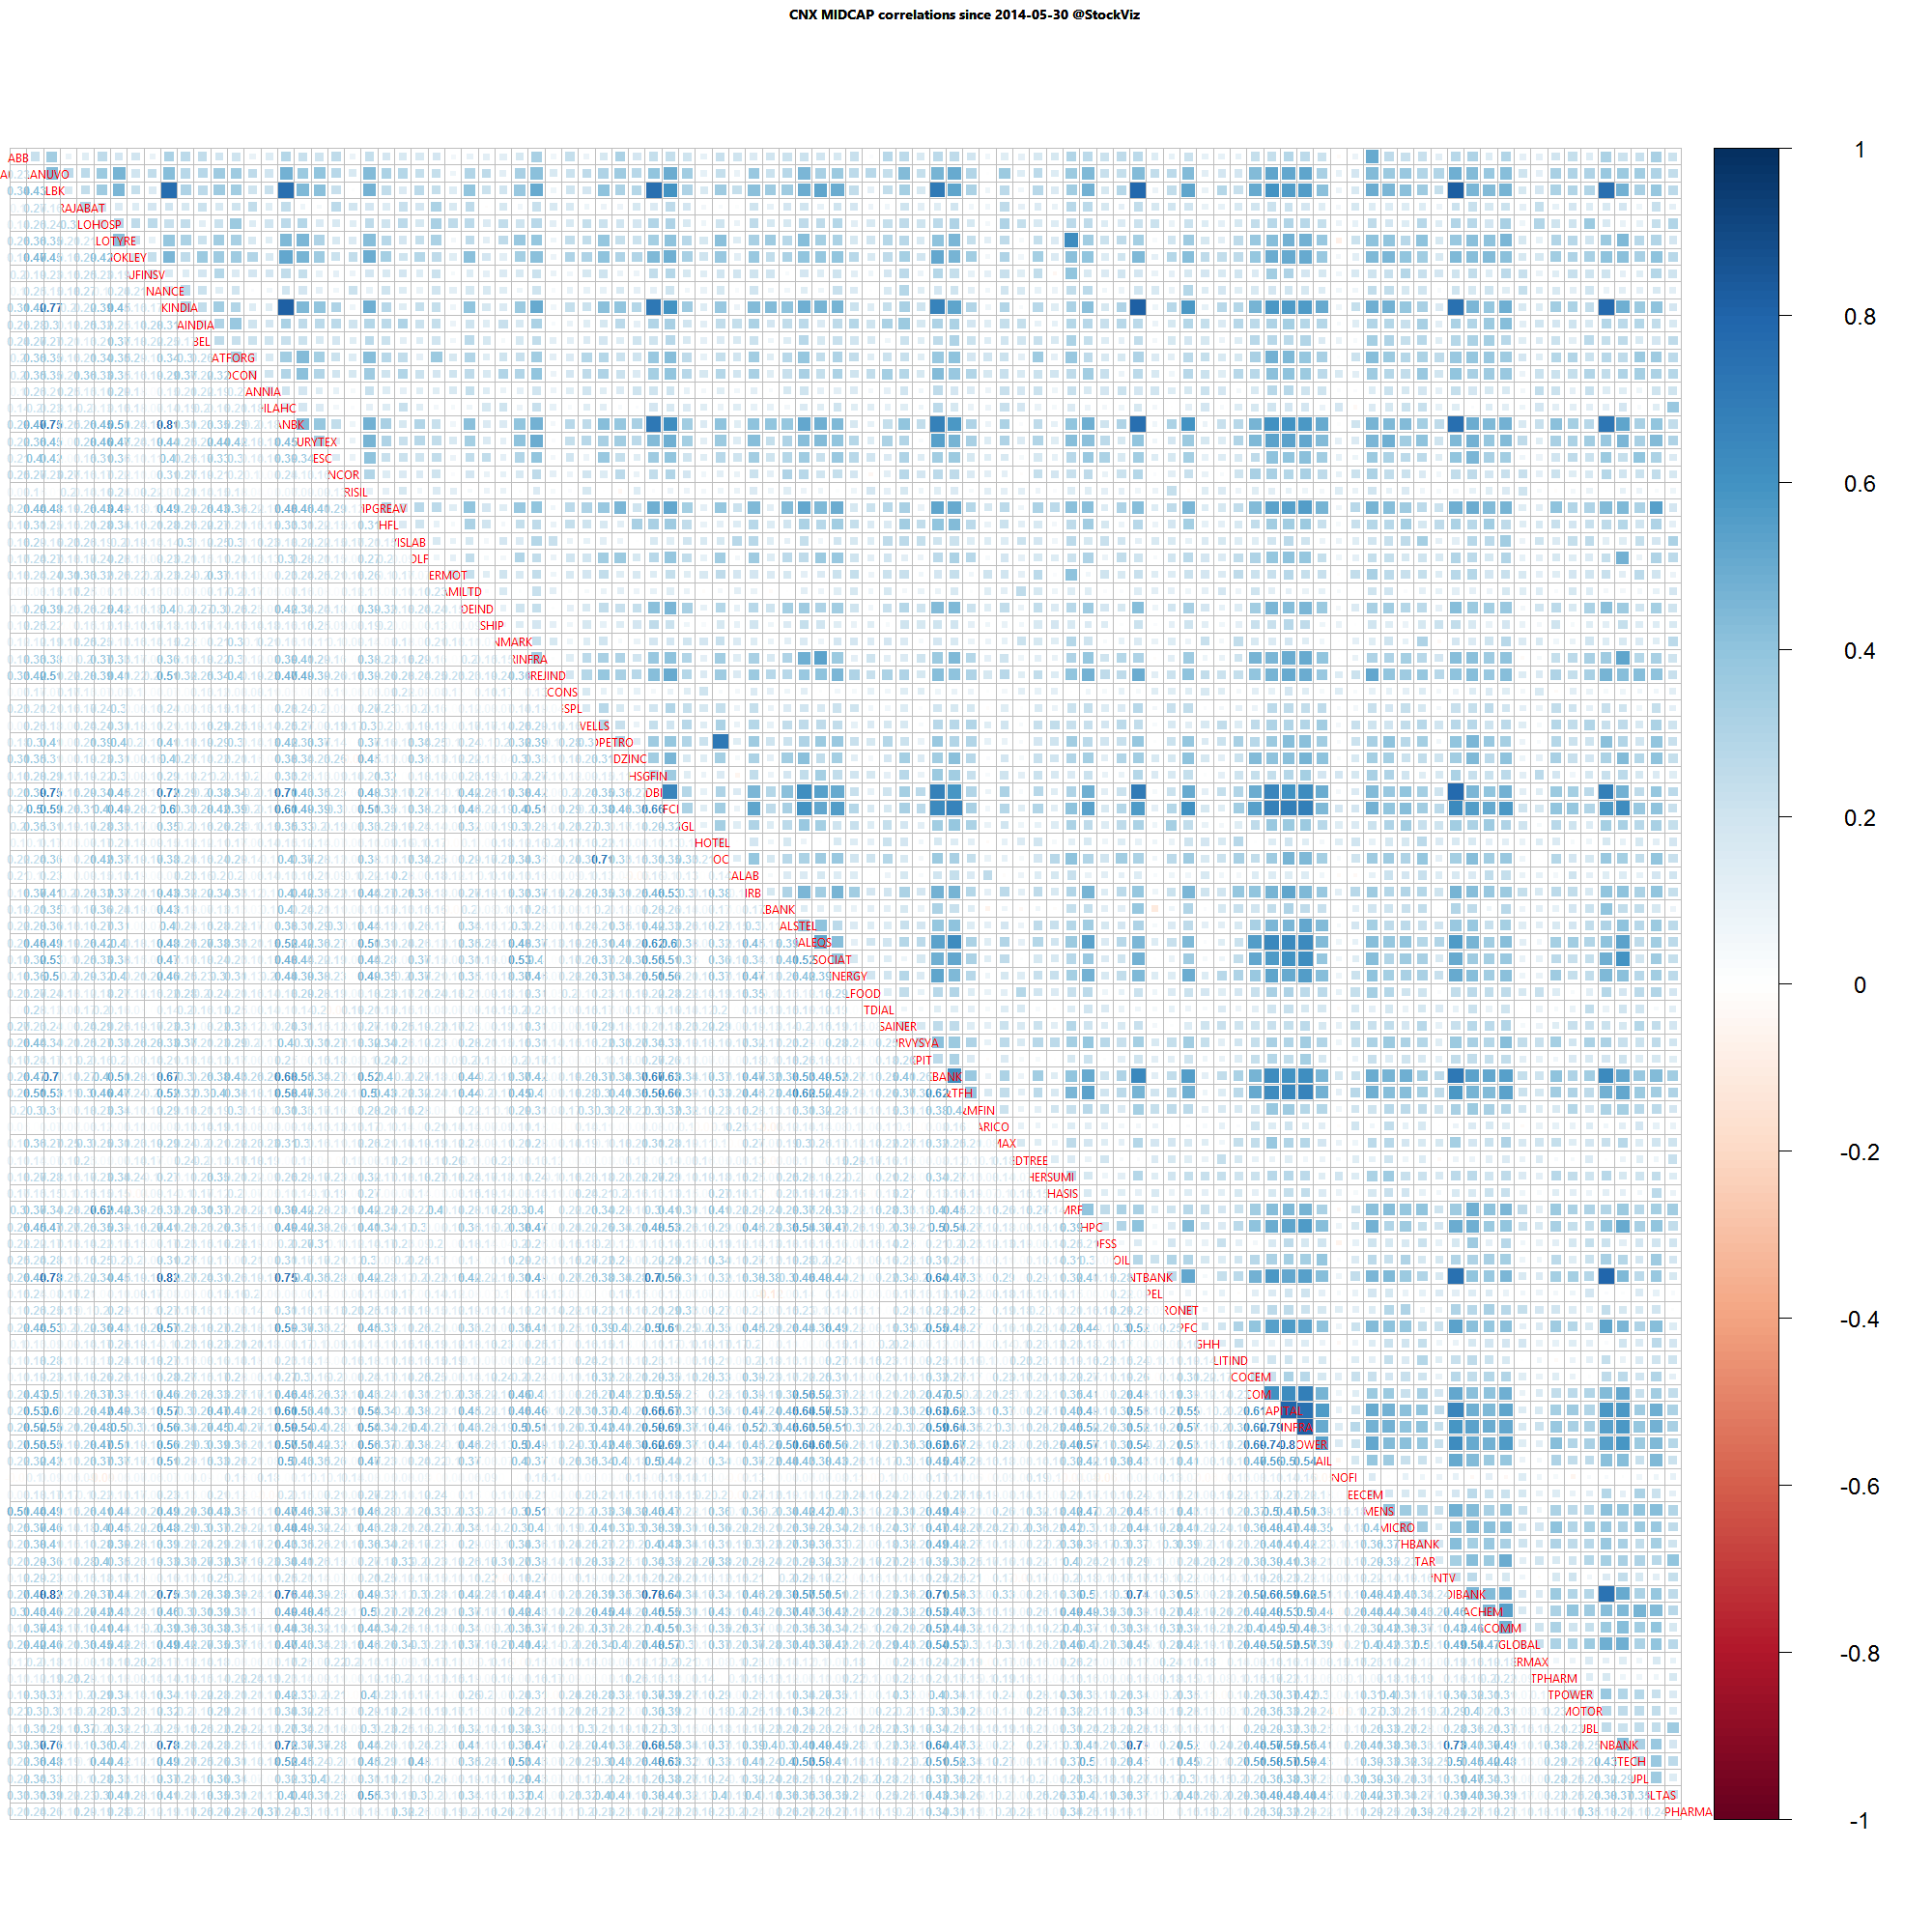
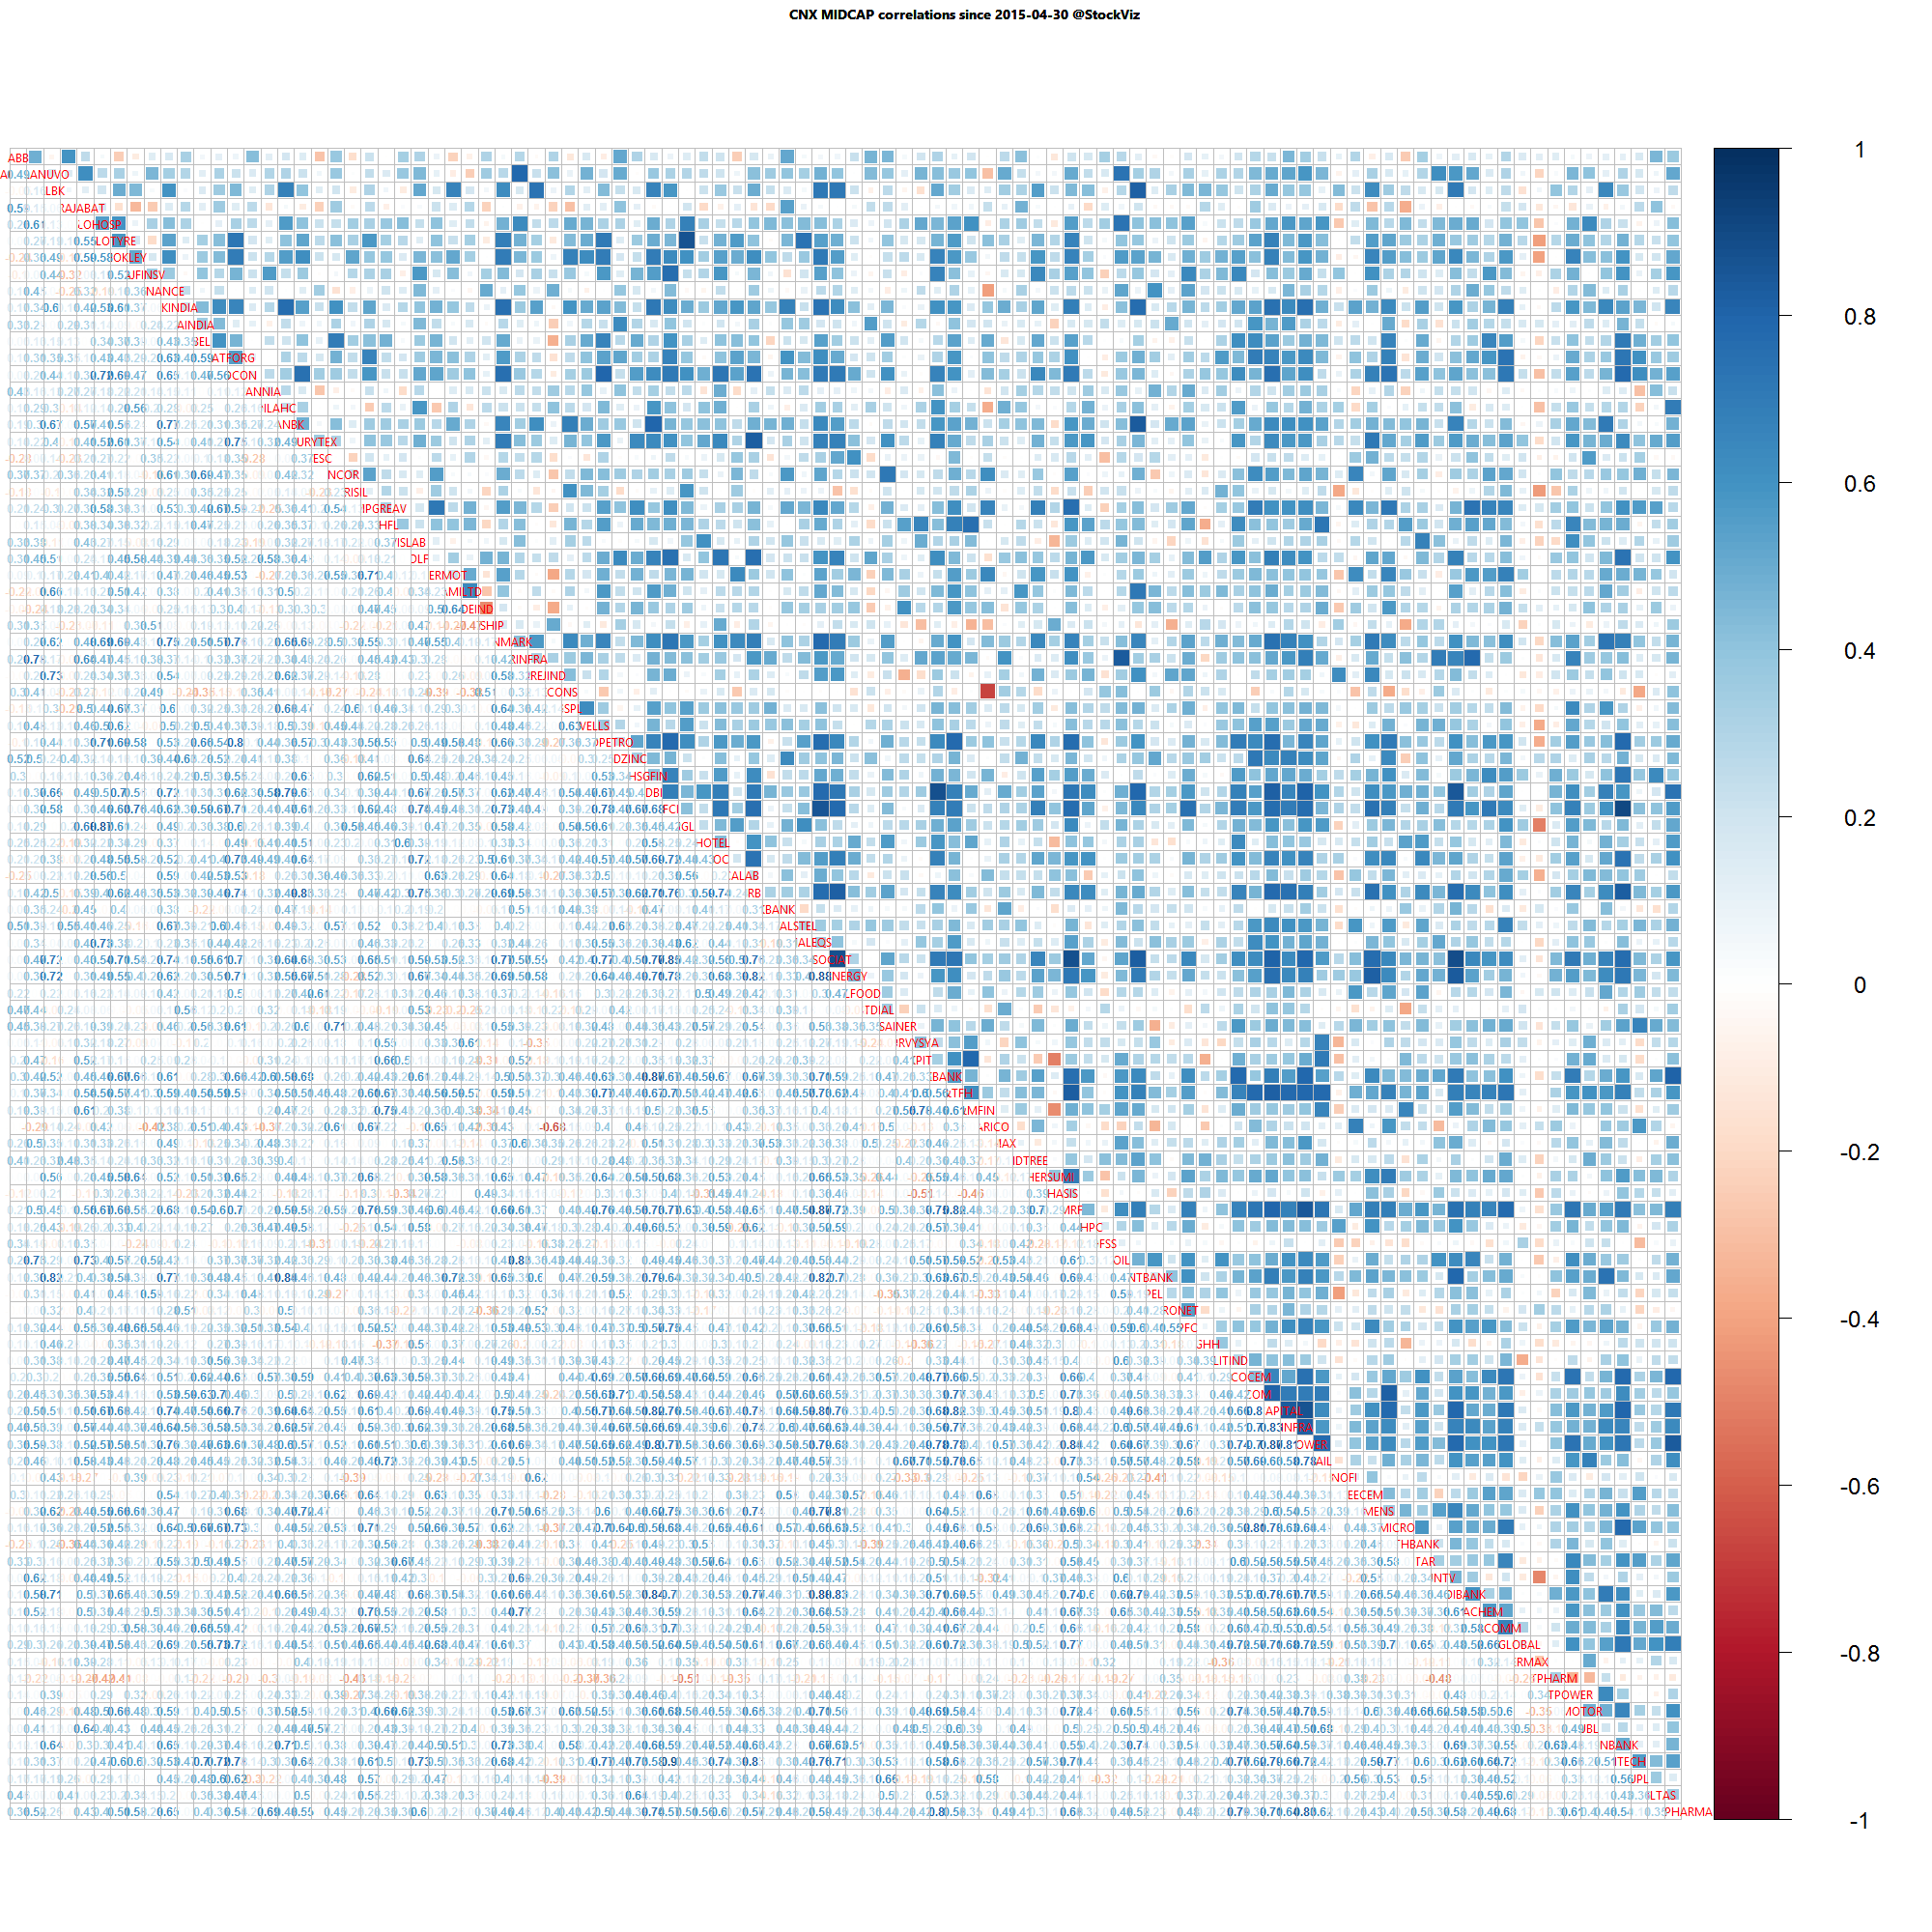
Midcap one year daily return correlations
Midcap one month daily return correlations
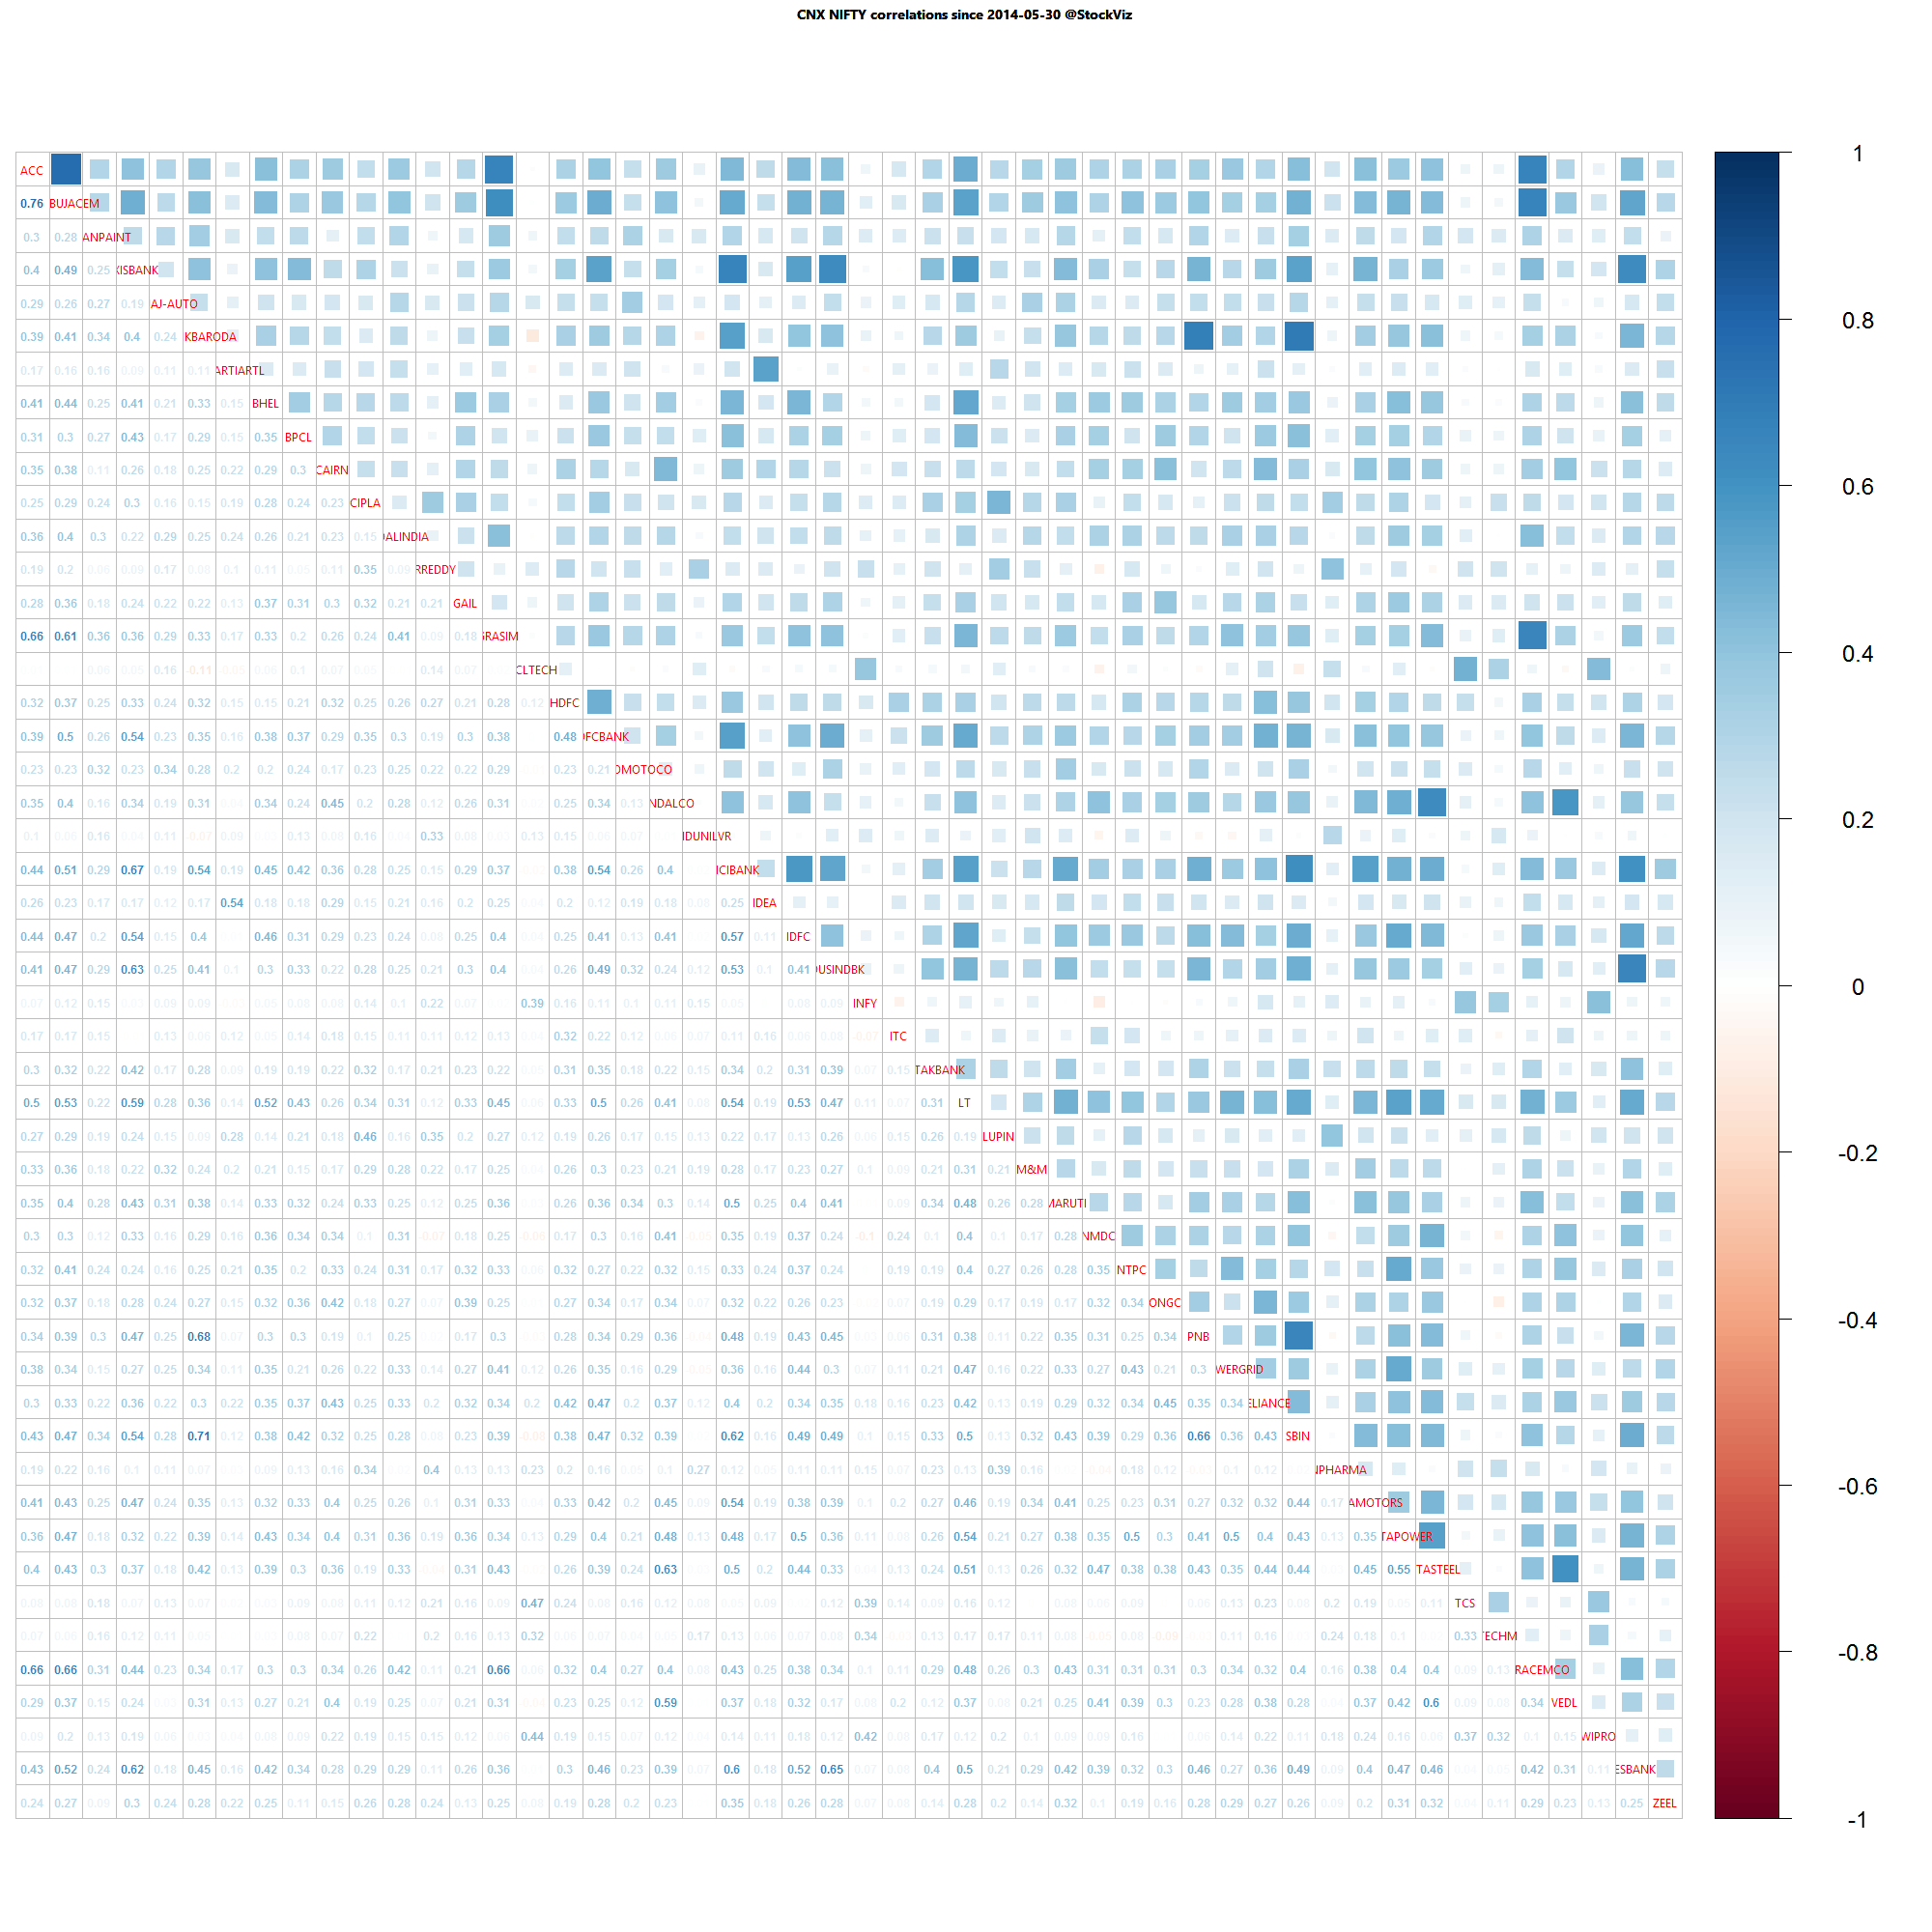
A lot of thick blue squares mean that positive correlations are high. Red squares mean negative correlations are high. Whites are the doldrums.