Category: Your Money

Weekly Recap: What is Life?

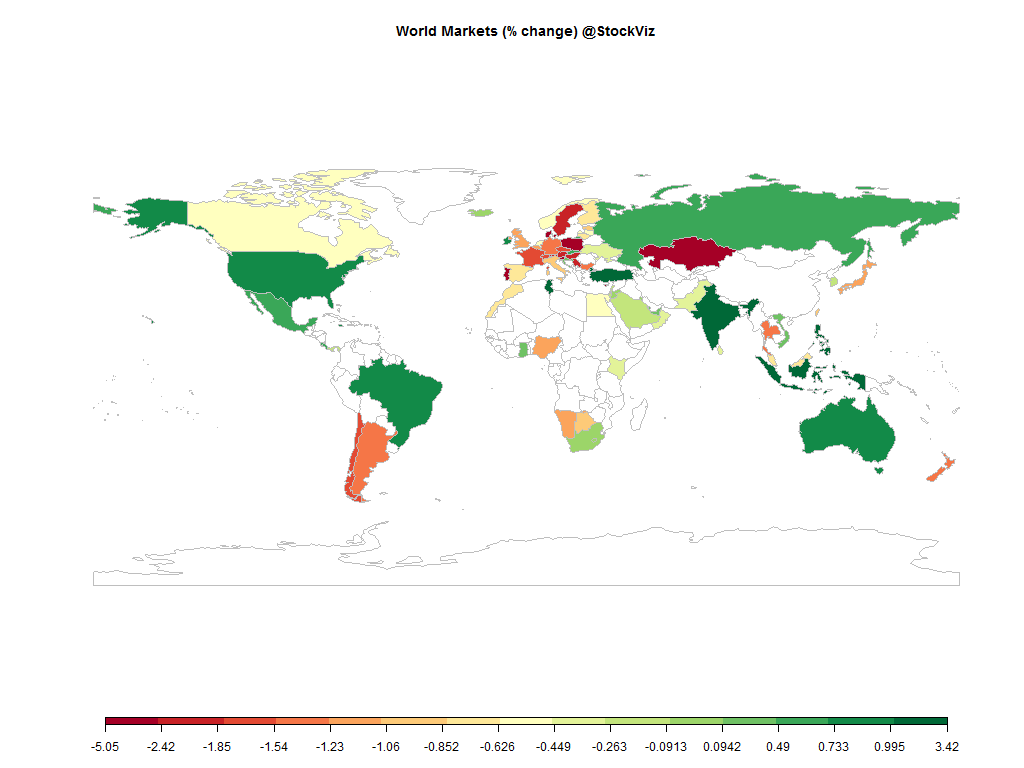
world.2015-06-12.2015-06-19

Equities

Major
DAX(DEU) -1.40%
CAC(FRA) -1.75%
UKX(GBR) -1.10%
NKY(JPN) -1.14%
SPX(USA) +0.75%
MINTs
JCI(IDN) +1.00%
INMEX(MEX) +0.60%
NGSEINDX(NGA) -1.08%
XU030(TUR) +2.55%
BRICS
IBOV(BRA) +0.89%
SHCOMP(CHN) -13.32%
NIFTY(IND) +3.03%
INDEXCF(RUS) +0.65%
TOP40(ZAF) +0.09%

Commodities

Energy
Brent Crude Oil -1.87%
Ethanol +0.88%
Heating Oil -2.07%
Natural Gas +2.32%
RBOB Gasoline -3.63%
WTI Crude Oil -1.28%
Metals
Palladium -3.98%
Silver 5000oz +1.90%
Copper -3.70%
Gold 100oz +1.74%
Platinum -0.96%

Currencies

USDEUR:-0.67% USDJPY:-0.66%

MINTs
USDIDR(IDN) -0.03%
USDMXN(MEX) -0.38%
USDNGN(NGA) +0.05%
USDTRY(TUR) -0.77%
BRICS
USDBRL(BRA) -0.53%
USDCNY(CHN) +0.02%
USDINR(IND) -0.78%
USDRUB(RUS) -2.09%
USDZAR(ZAF) -1.78%
Agricultural
Coffee (Arabica) -4.41%
Coffee (Robusta) +6.65%
Lean Hogs -6.93%
Lumber +1.63%
Orange Juice -2.23%
Corn +0.00%
Cotton -0.84%
White Sugar +0.40%
Feeder Cattle -0.04%
Cattle -0.30%
Cocoa +0.62%
Soybean Meal +1.86%
Soybeans +3.33%
Sugar #11 -5.12%
Wheat -3.07%

Credit Indices

Index Change
Markit CDX EM -0.21%
Markit CDX NA HY -0.84%
Markit CDX NA IG +4.06%
Markit iTraxx Asia ex-Japan IG +2.43%
Markit iTraxx Australia +3.39%
Markit iTraxx Europe +9.01%
Markit iTraxx Europe Crossover +36.53%
Markit iTraxx Japan +4.22%
Markit iTraxx SovX Western Europe +2.81%
Markit LCDX (Loan CDS) +0.00%
Markit MCDX (Municipal CDS) +0.97%
China is going through whatever India went through in the 90’s. Europe is going through their quarterly Greece-related gyrations. And Indian markets woke up…

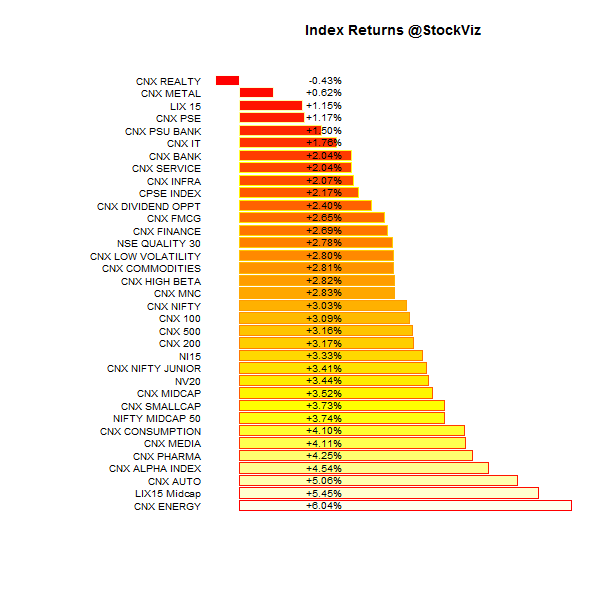
Index Returns

index.performance.2015-06-12.2015-06-19
For a deeper dive into indices, check out our weekly Index Update.

Market Cap Decile Performance

Decile Mkt. Cap. Adv/Decl
1 (micro) +1.32% 68/58
2 +2.63% 64/62
3 +2.92% 67/59
4 +4.06% 65/60
5 +3.86% 67/59
6 +3.84% 76/50
7 +2.58% 66/59
8 +2.74% 63/63
9 +2.69% 68/58
10 (mega) +2.70% 63/63
Rally across the board…

Top Winners and Losers

EICHERMOT +11.73%
RELIANCE +12.00%
GLENMARK +12.36%
MCDOWELL-N -6.31%
VEDL -4.87%
CONCOR -4.65%
This stopped making sense a long time ago…

ETF Performance

NIFTYBEES +2.96%
JUNIORBEES +2.60%
CPSEETF +2.39%
BANKBEES +2.12%
PSUBNKBEES +1.52%
GOLDBEES +0.51%
INFRABEES -1.00%
There is talk about #gold #bonds being floated around by the RBI. After the tepid reaction to inflation-linked bonds and gold-deposits, you would think they would approach this topic with a bit more humility…

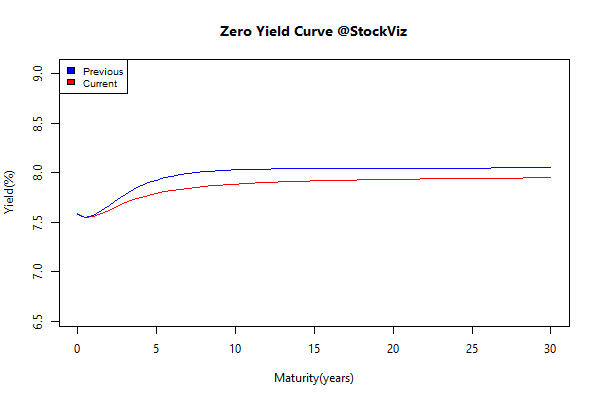
Yield Curve

yield Curve.2015-06-12.2015-06-19

Bond Indices

Sub Index Change in YTM Total Return(%)
GSEC TB +0.13 +0.11%
GSEC SUB 1-3 +0.07 +0.20%
GSEC SUB 3-8 -0.16 +0.99%
GSEC SUB 8 -0.03 +0.59%
A smart recovery at the middle…

Investment Theme Performance

Equity Mutual Funds

Bond Mutual Funds

Thought for the weekend

Index Update 20.06.2015

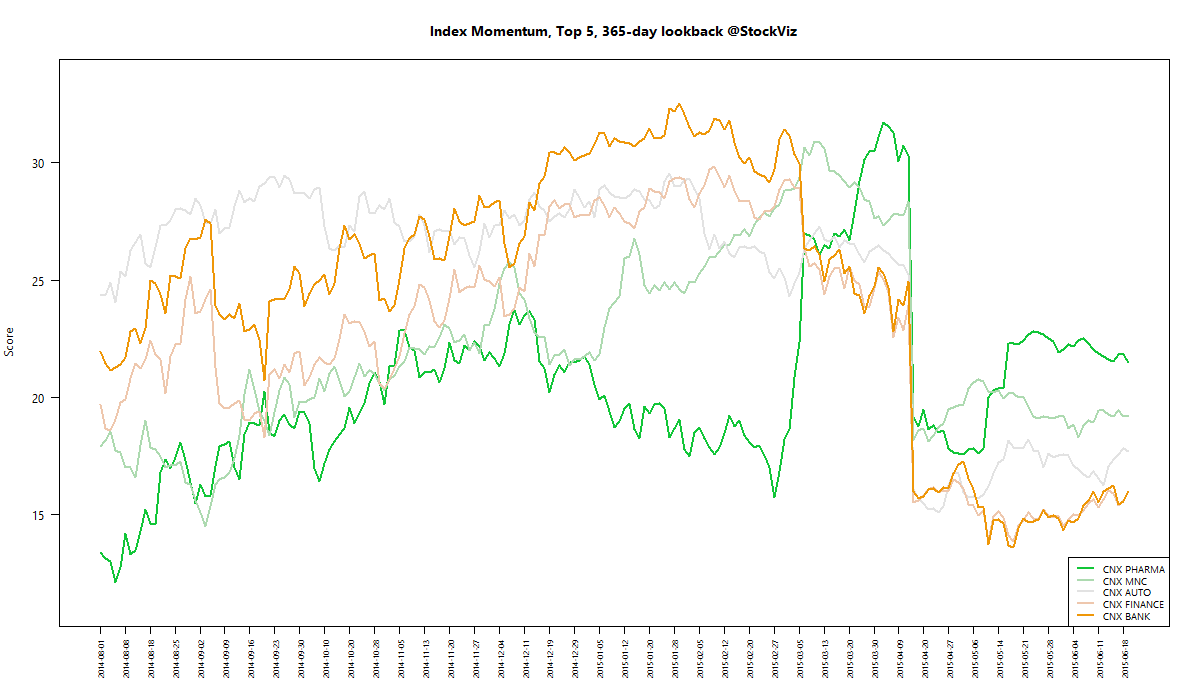
MOMENTUM

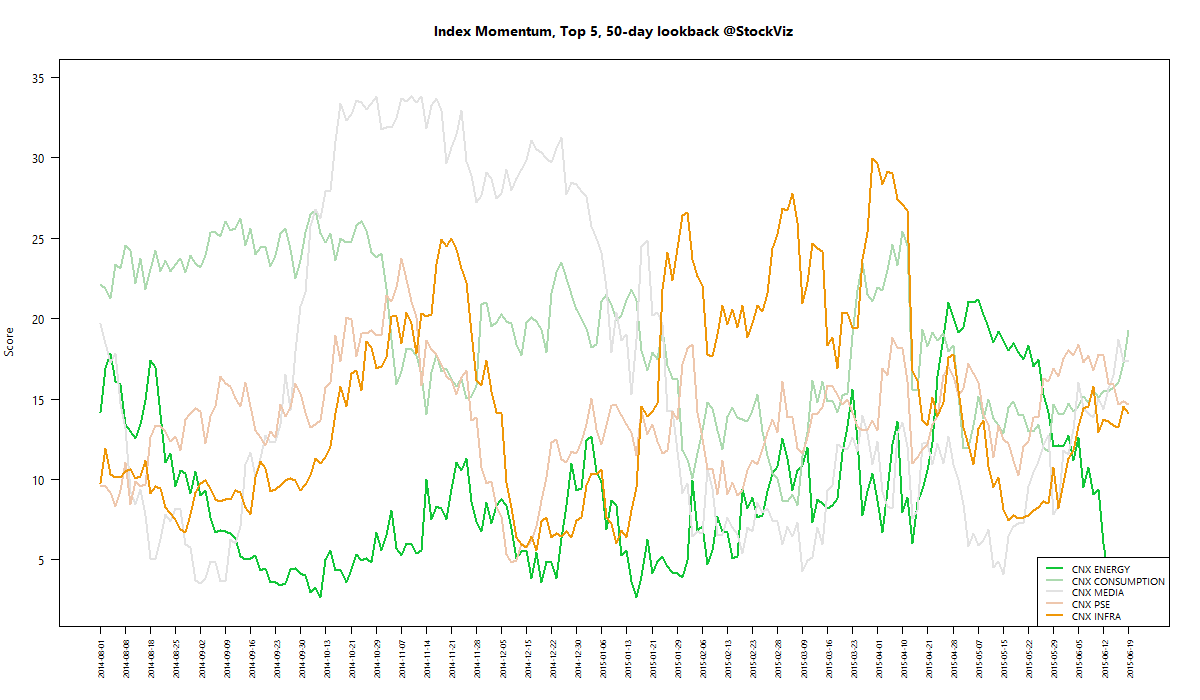
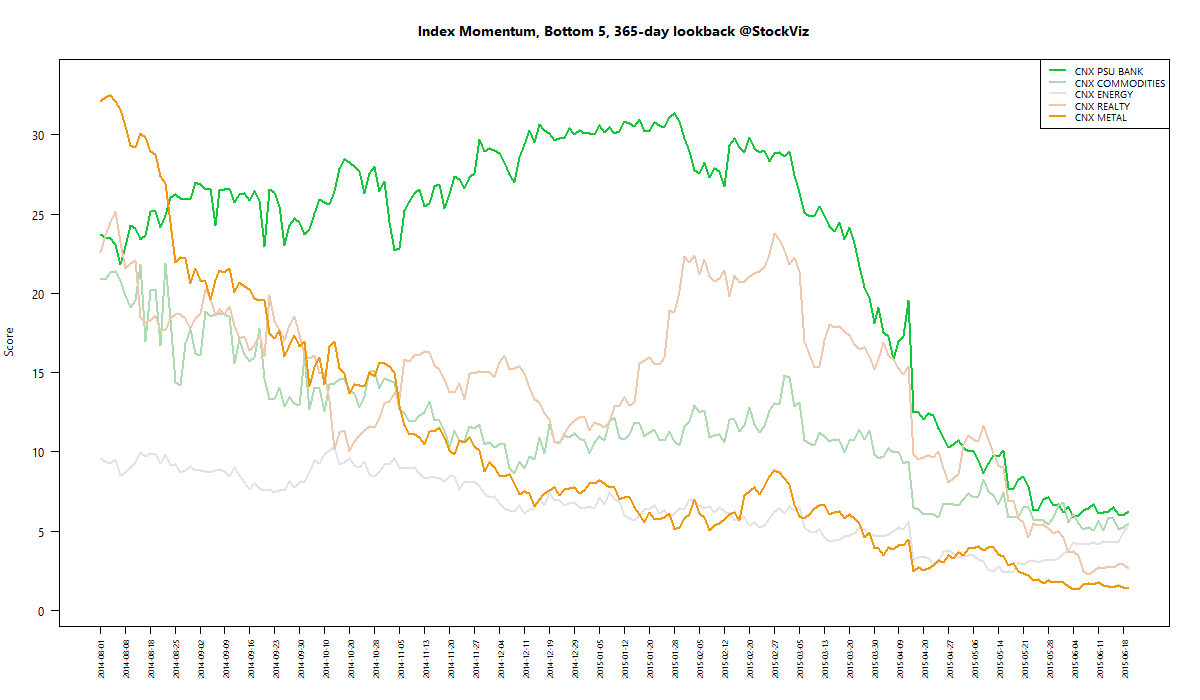
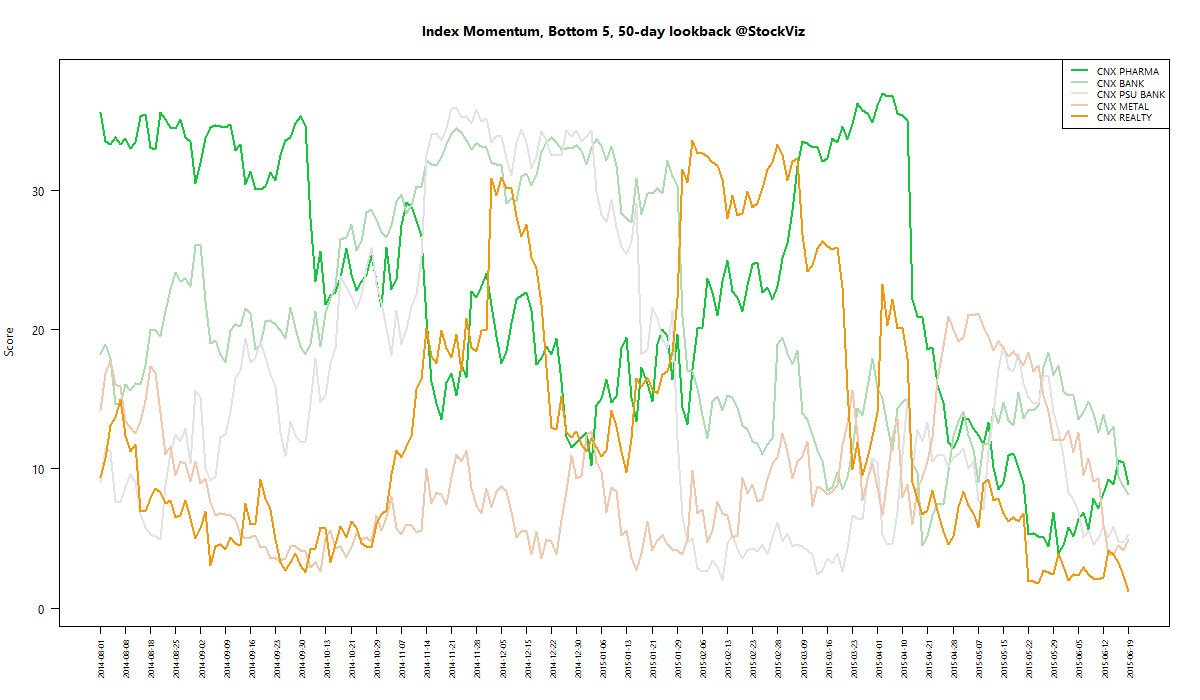
We run our proprietary momentum scoring algorithm on indices just like we do on stocks. You can use the momentum scores of sub-indices to get a sense for which sectors have the wind on their backs and those that are facing headwinds.

Traders can pick their longs in sectors with high short-term momentum and their shorts in sectors with low momentum. Investors can use the longer lookback scores to position themselves using our re-factored index Themes.

You can see how the momentum algorithm has performed on individual stocks here.

Here are the best and the worst sub-indices:

index momentum best 365 2015-06-19 png

index momentum best 50 2015-06-19 png

index momentum worst 365 2015-06-19 png

index momentum worst 50 2015-06-19 png

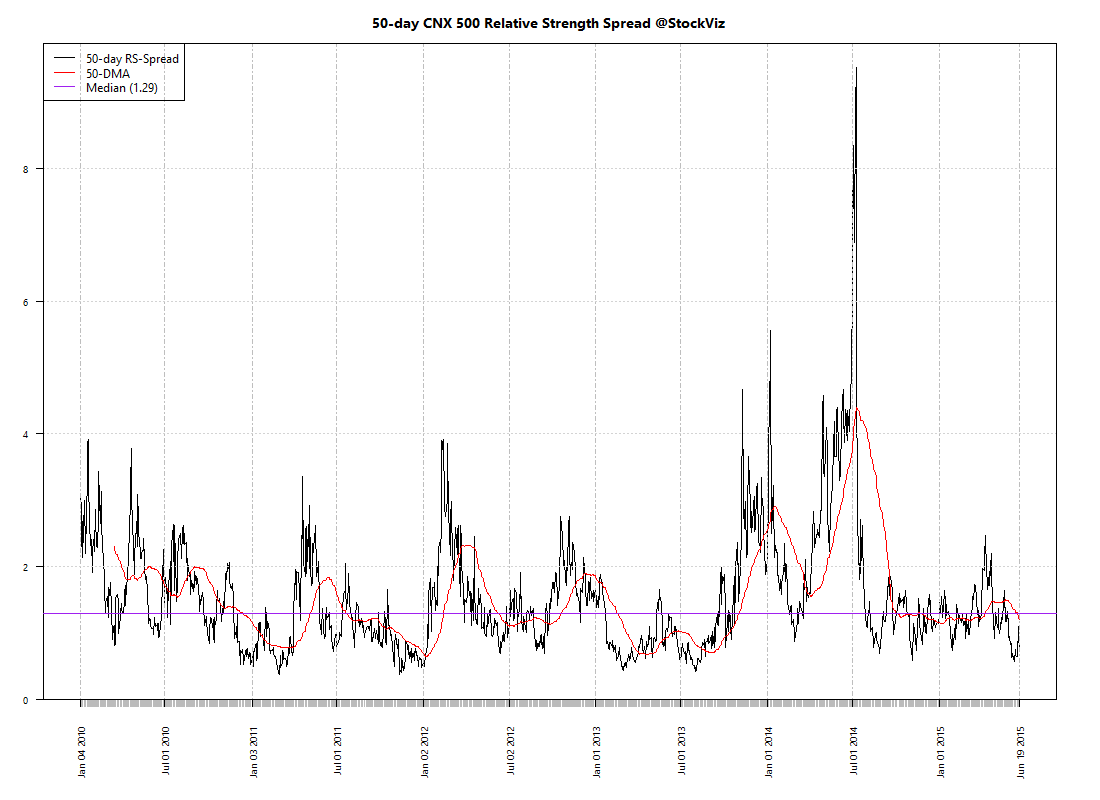
Relative Strength Spread

CNX_500 relative-spread-index 50 2015-06-19 png

Refactored Index Performance

50-day performance, from April 09, 2015 through June 19, 2015:

Trend Model Summary

Index Signal % From Peak Day of Peak
CNX AUTO LONG
8.73
2015-Jan-27
CNX BANK SHORT
13.01
2015-Jan-27
CNX ENERGY LONG
26.08
2008-Jan-14
CNX FMCG SHORT
13.23
2015-Feb-25
CNX INFRA SHORT
48.68
2008-Jan-09
CNX IT SHORT
88.23
2000-Feb-21
CNX MEDIA LONG
26.66
2008-Jan-04
CNX METAL SHORT
58.84
2008-Jan-04
CNX MNC SHORT
5.41
2015-Mar-12
CNX NIFTY SHORT
8.57
2015-Mar-03
CNX PHARMA SHORT
14.61
2015-Apr-08
CNX PSE SHORT
25.47
2008-Jan-04
CNX REALTY SHORT
90.75
2008-Jan-14
Looks like Banks, FMCG and Pharma are perking up. MNCs and Autos are recovering from their drawdowns as well…

Correlation Update 20.06.2015

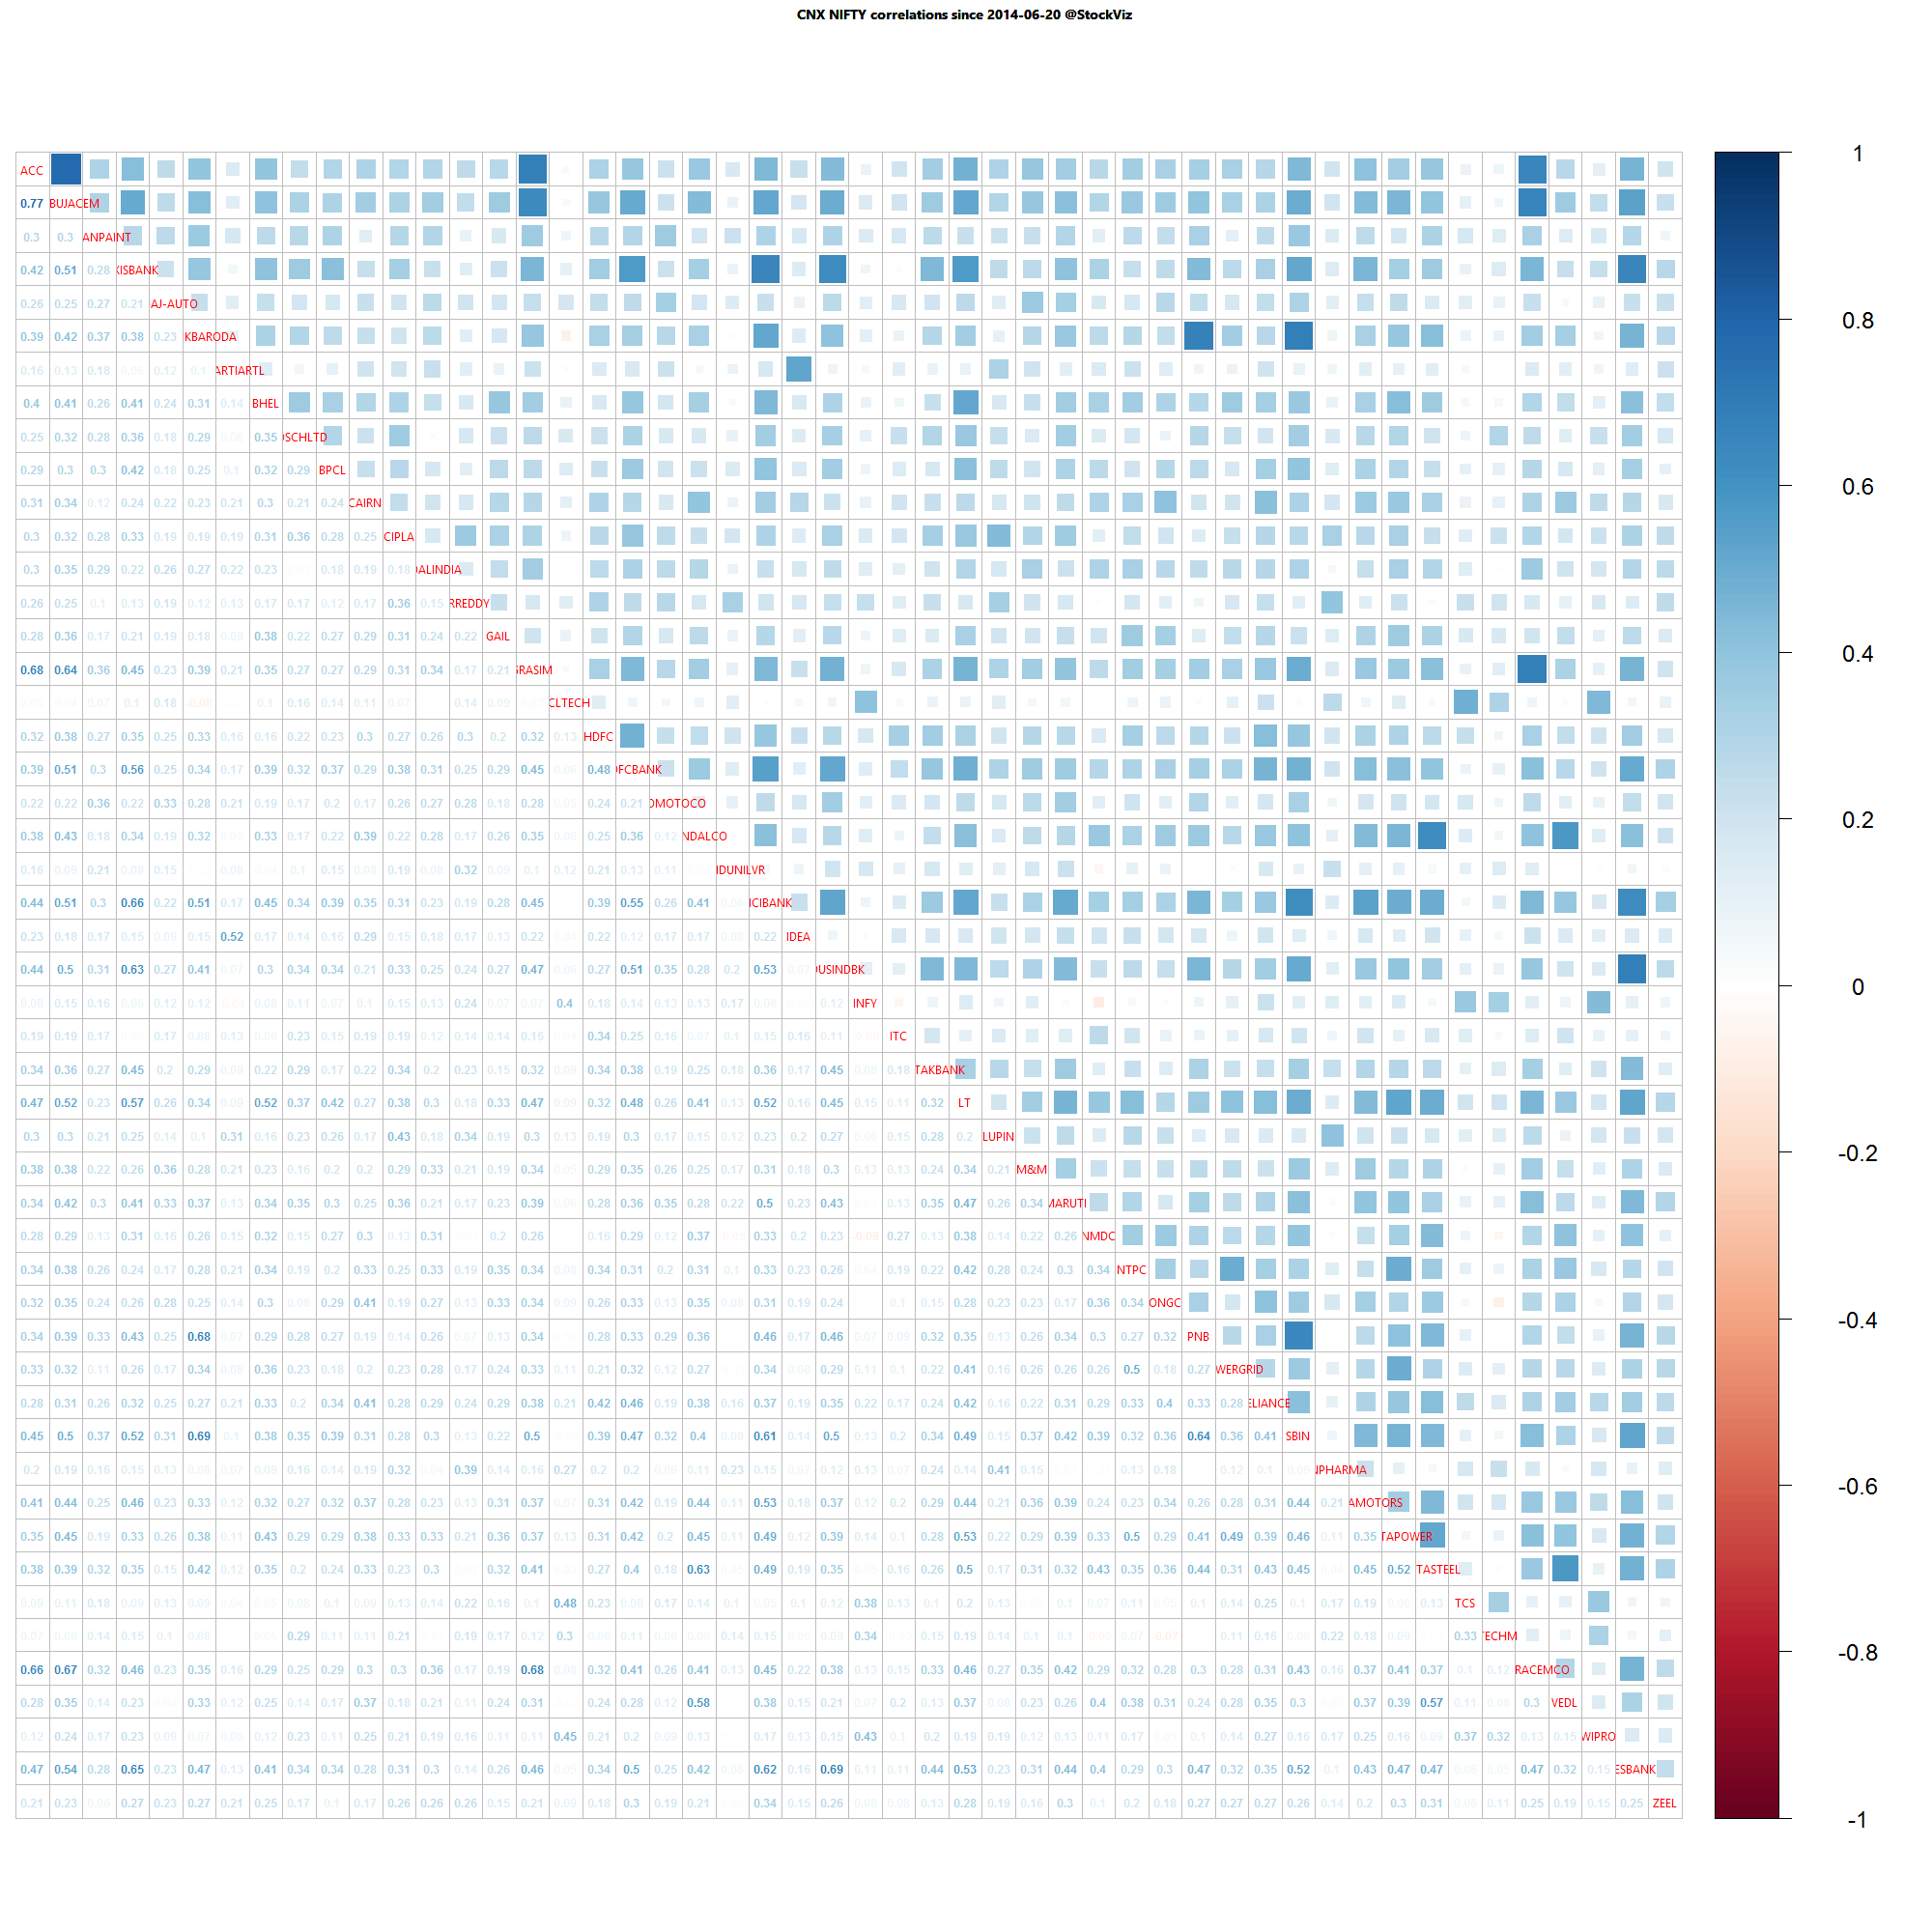
Nifty one year daily return correlations

Nifty one year daily return correlations

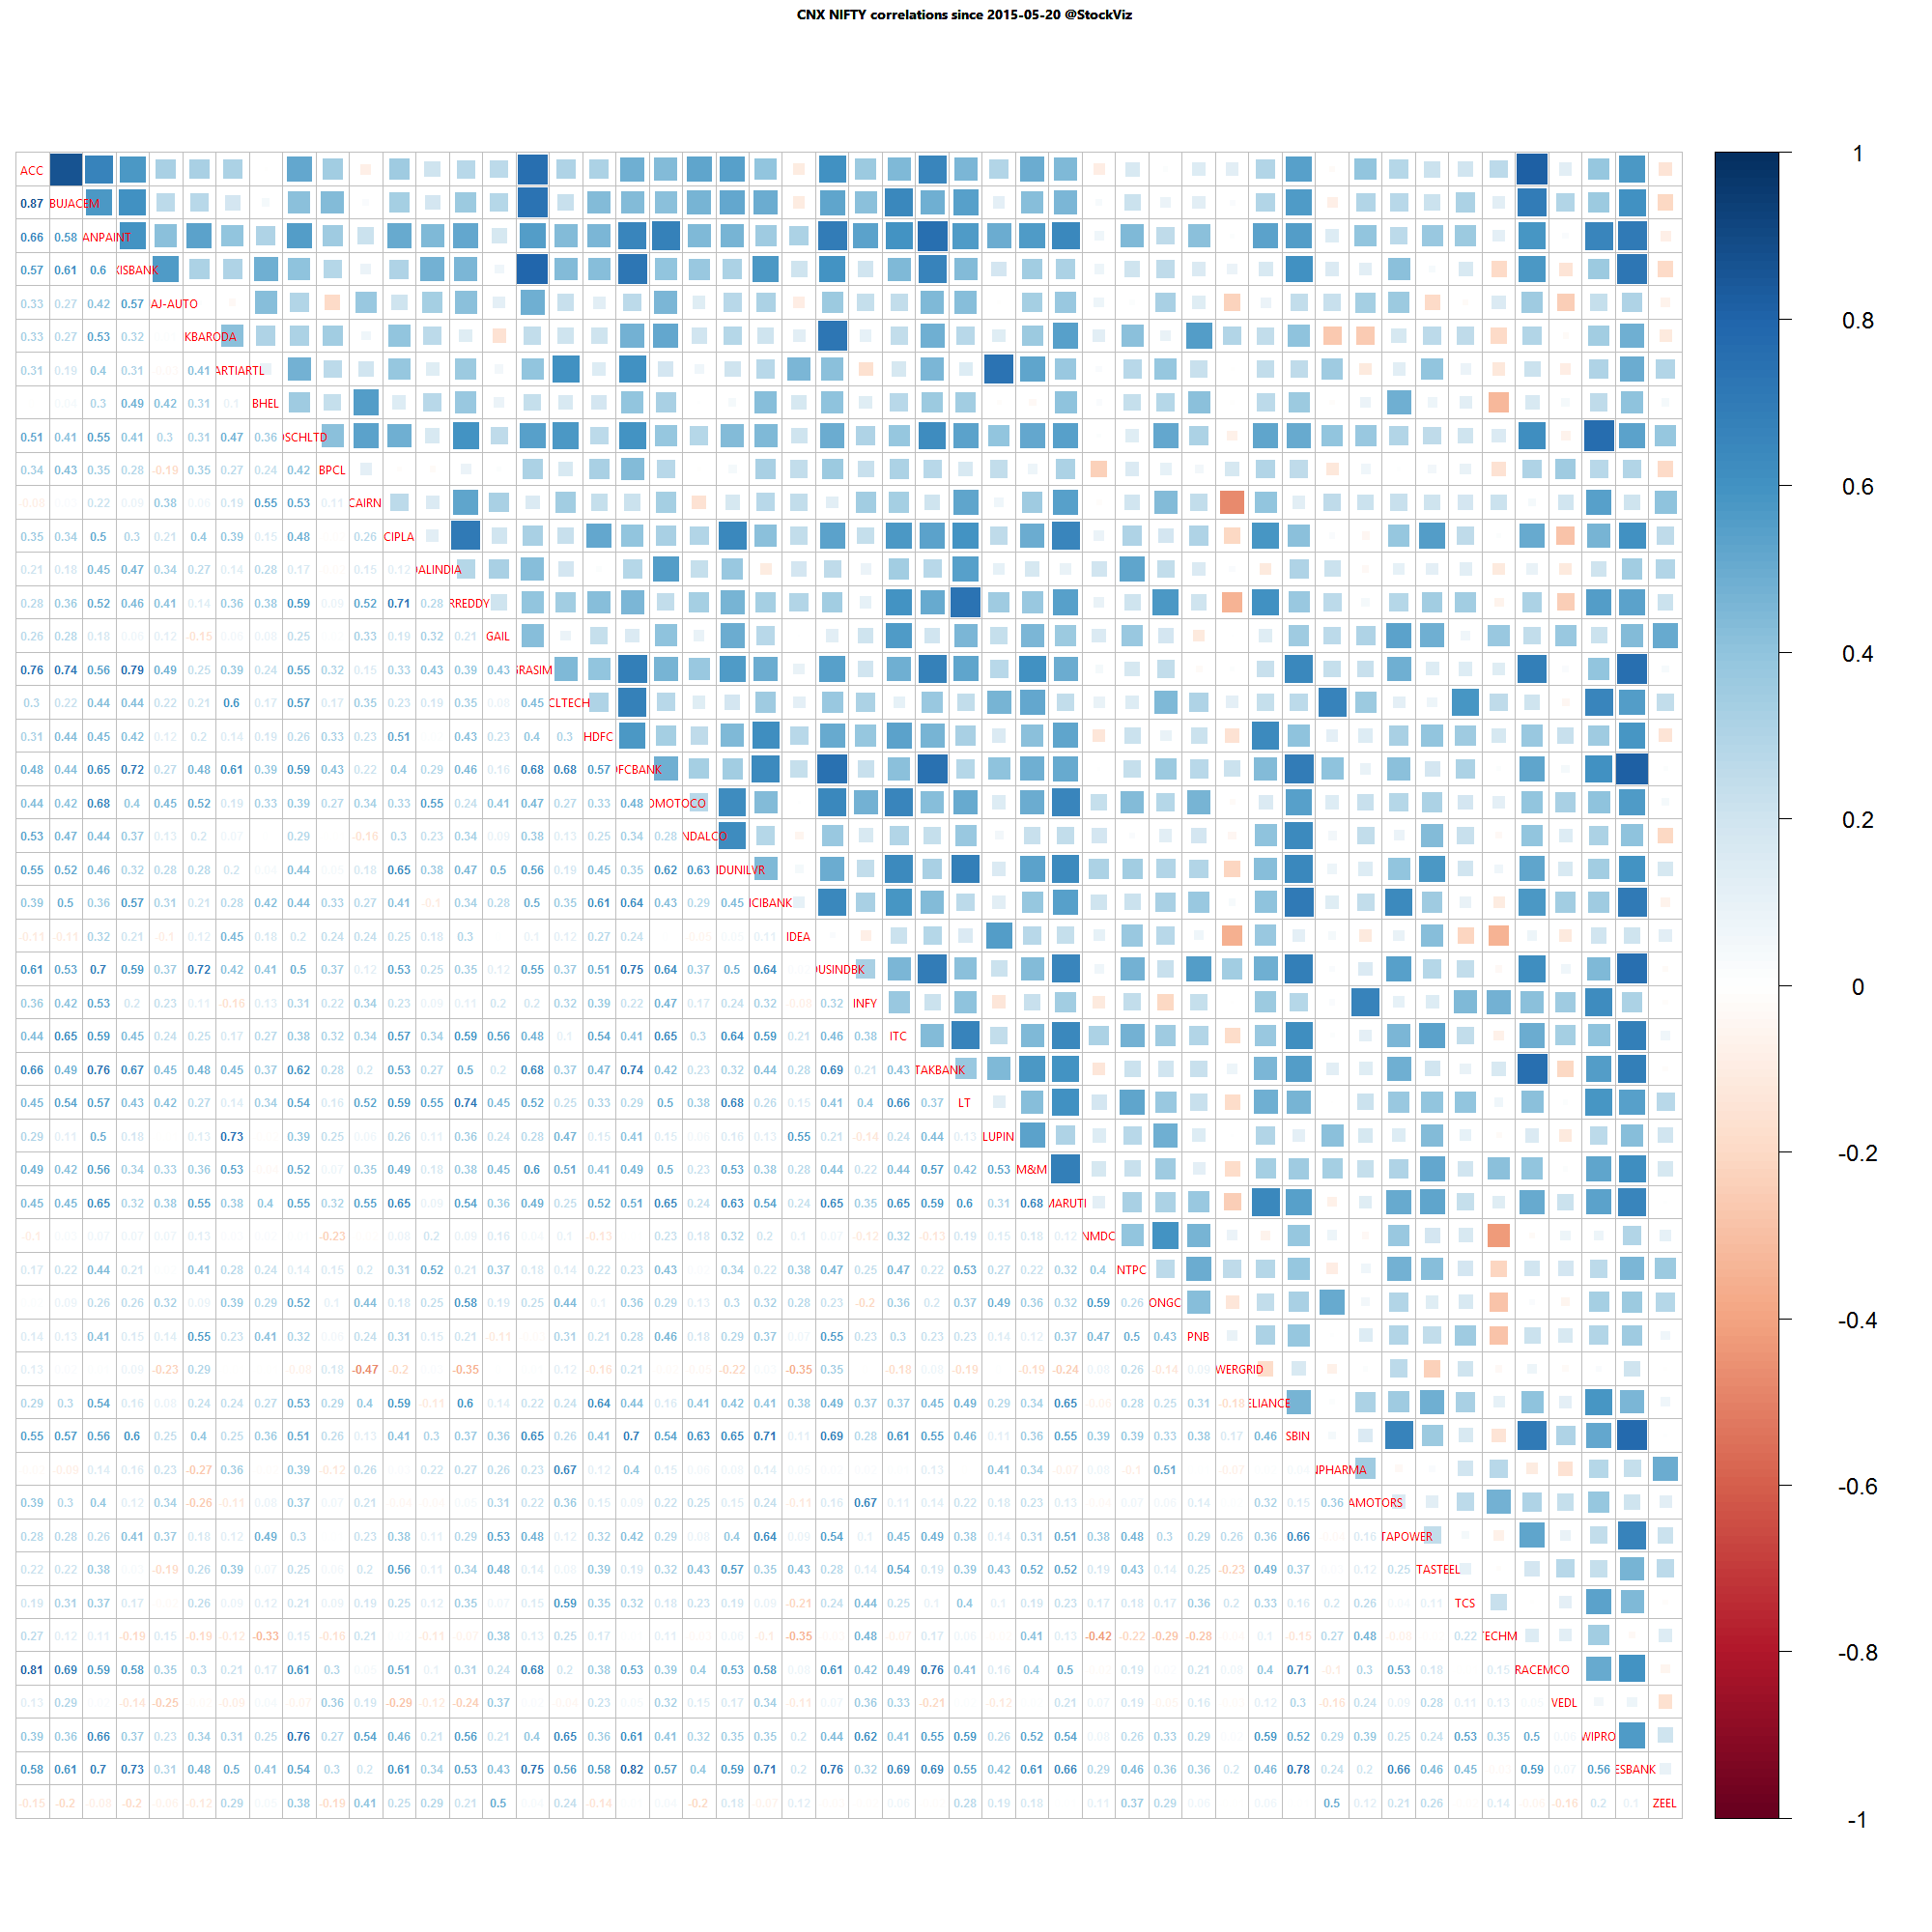
Nifty one month daily return correlations

Nifty one month daily return correlations

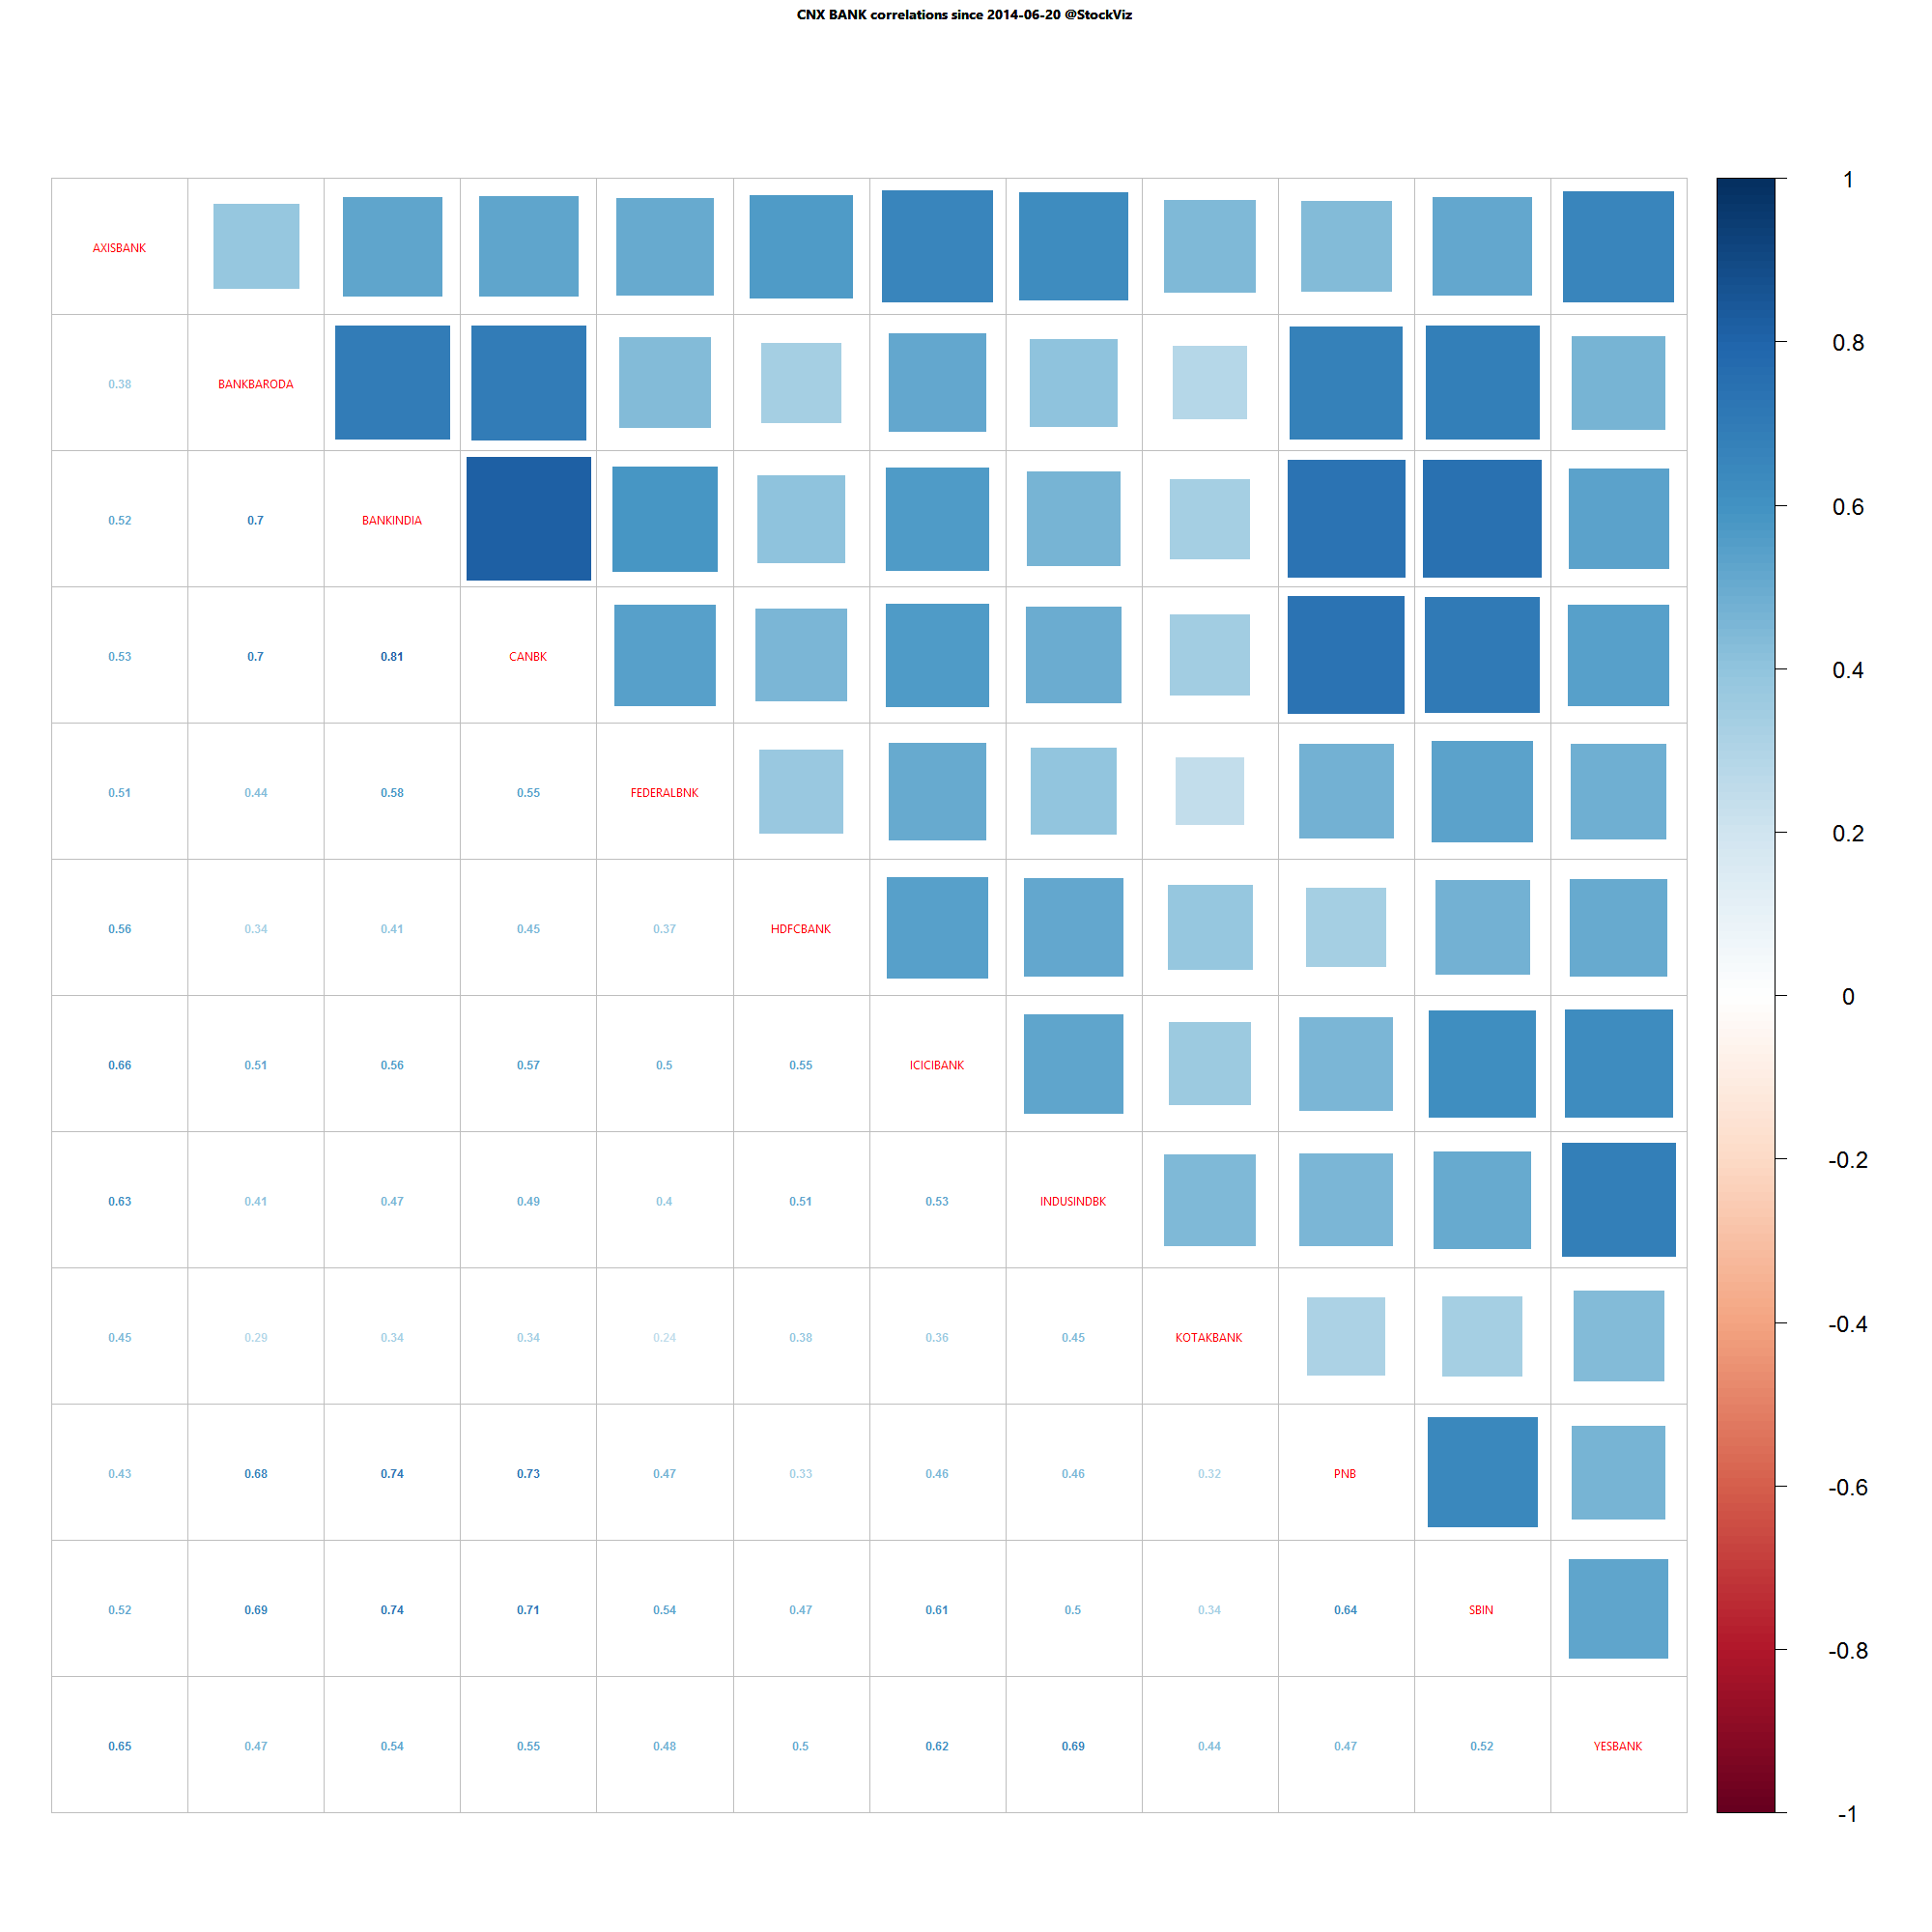
Bank Nifty one year daily return correlations

Bank Nifty one year daily return correlations

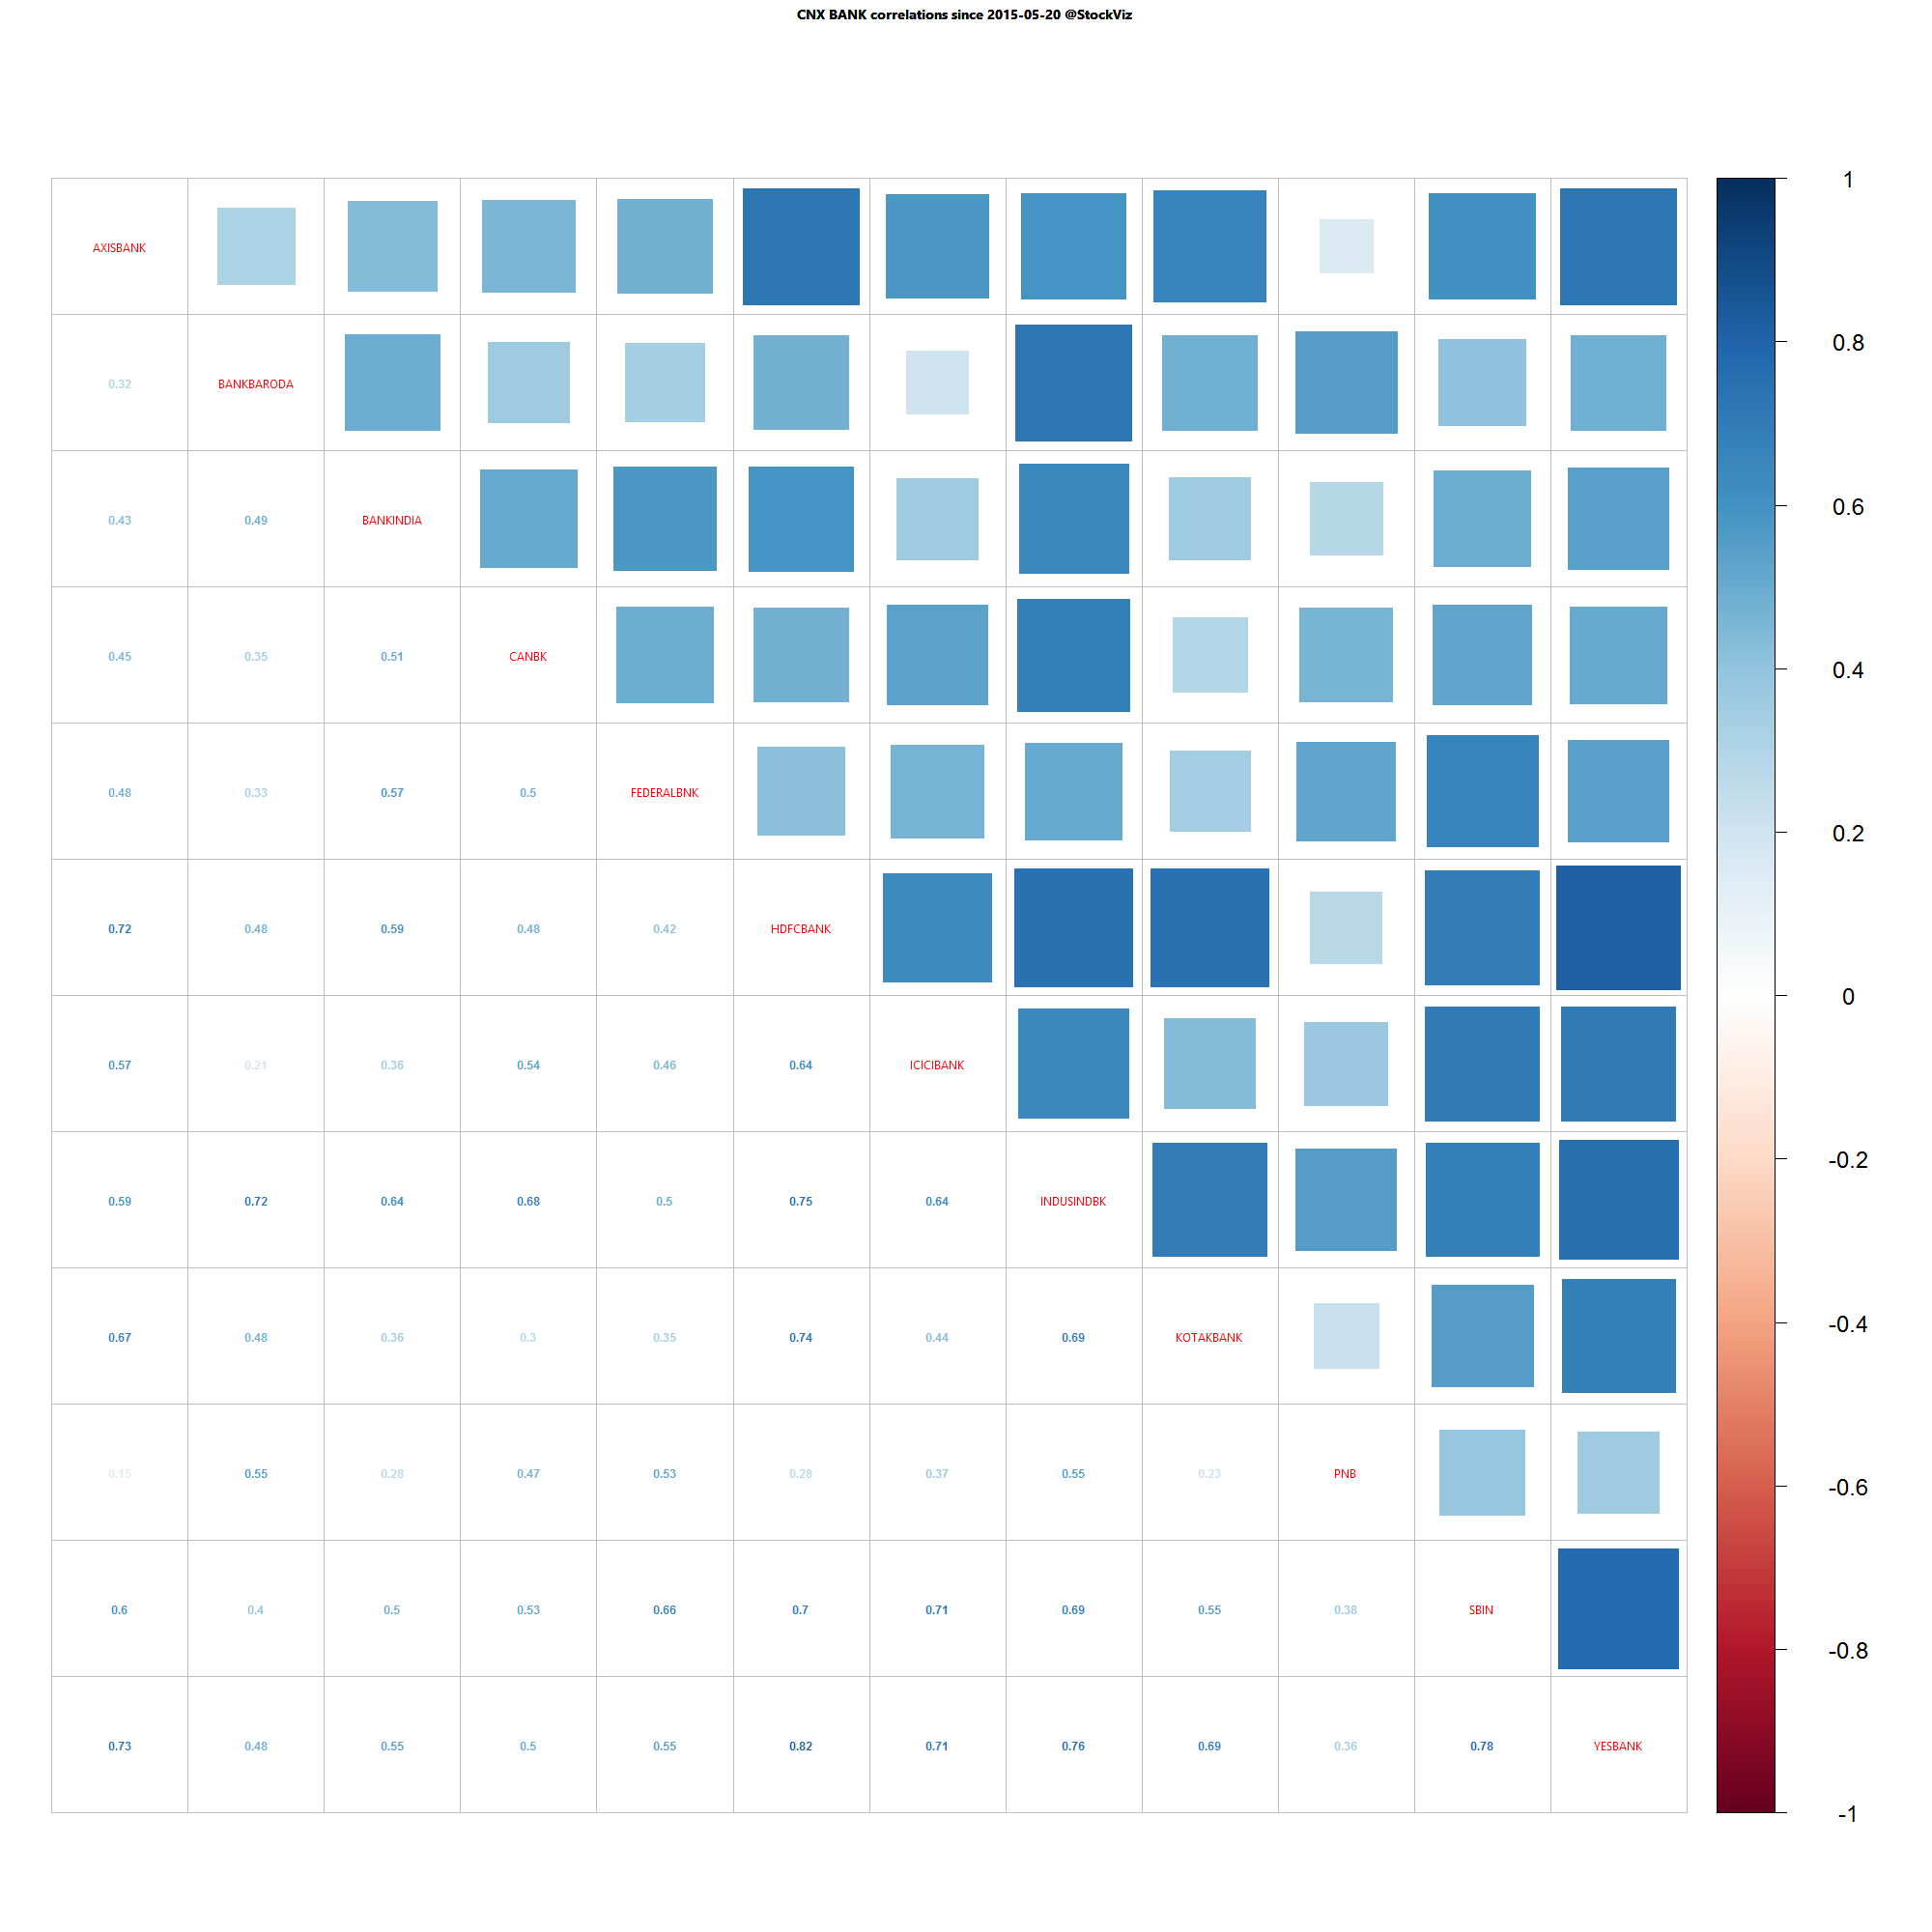
Bank Nifty one month daily return correlations

Bank Nifty one month daily return correlations

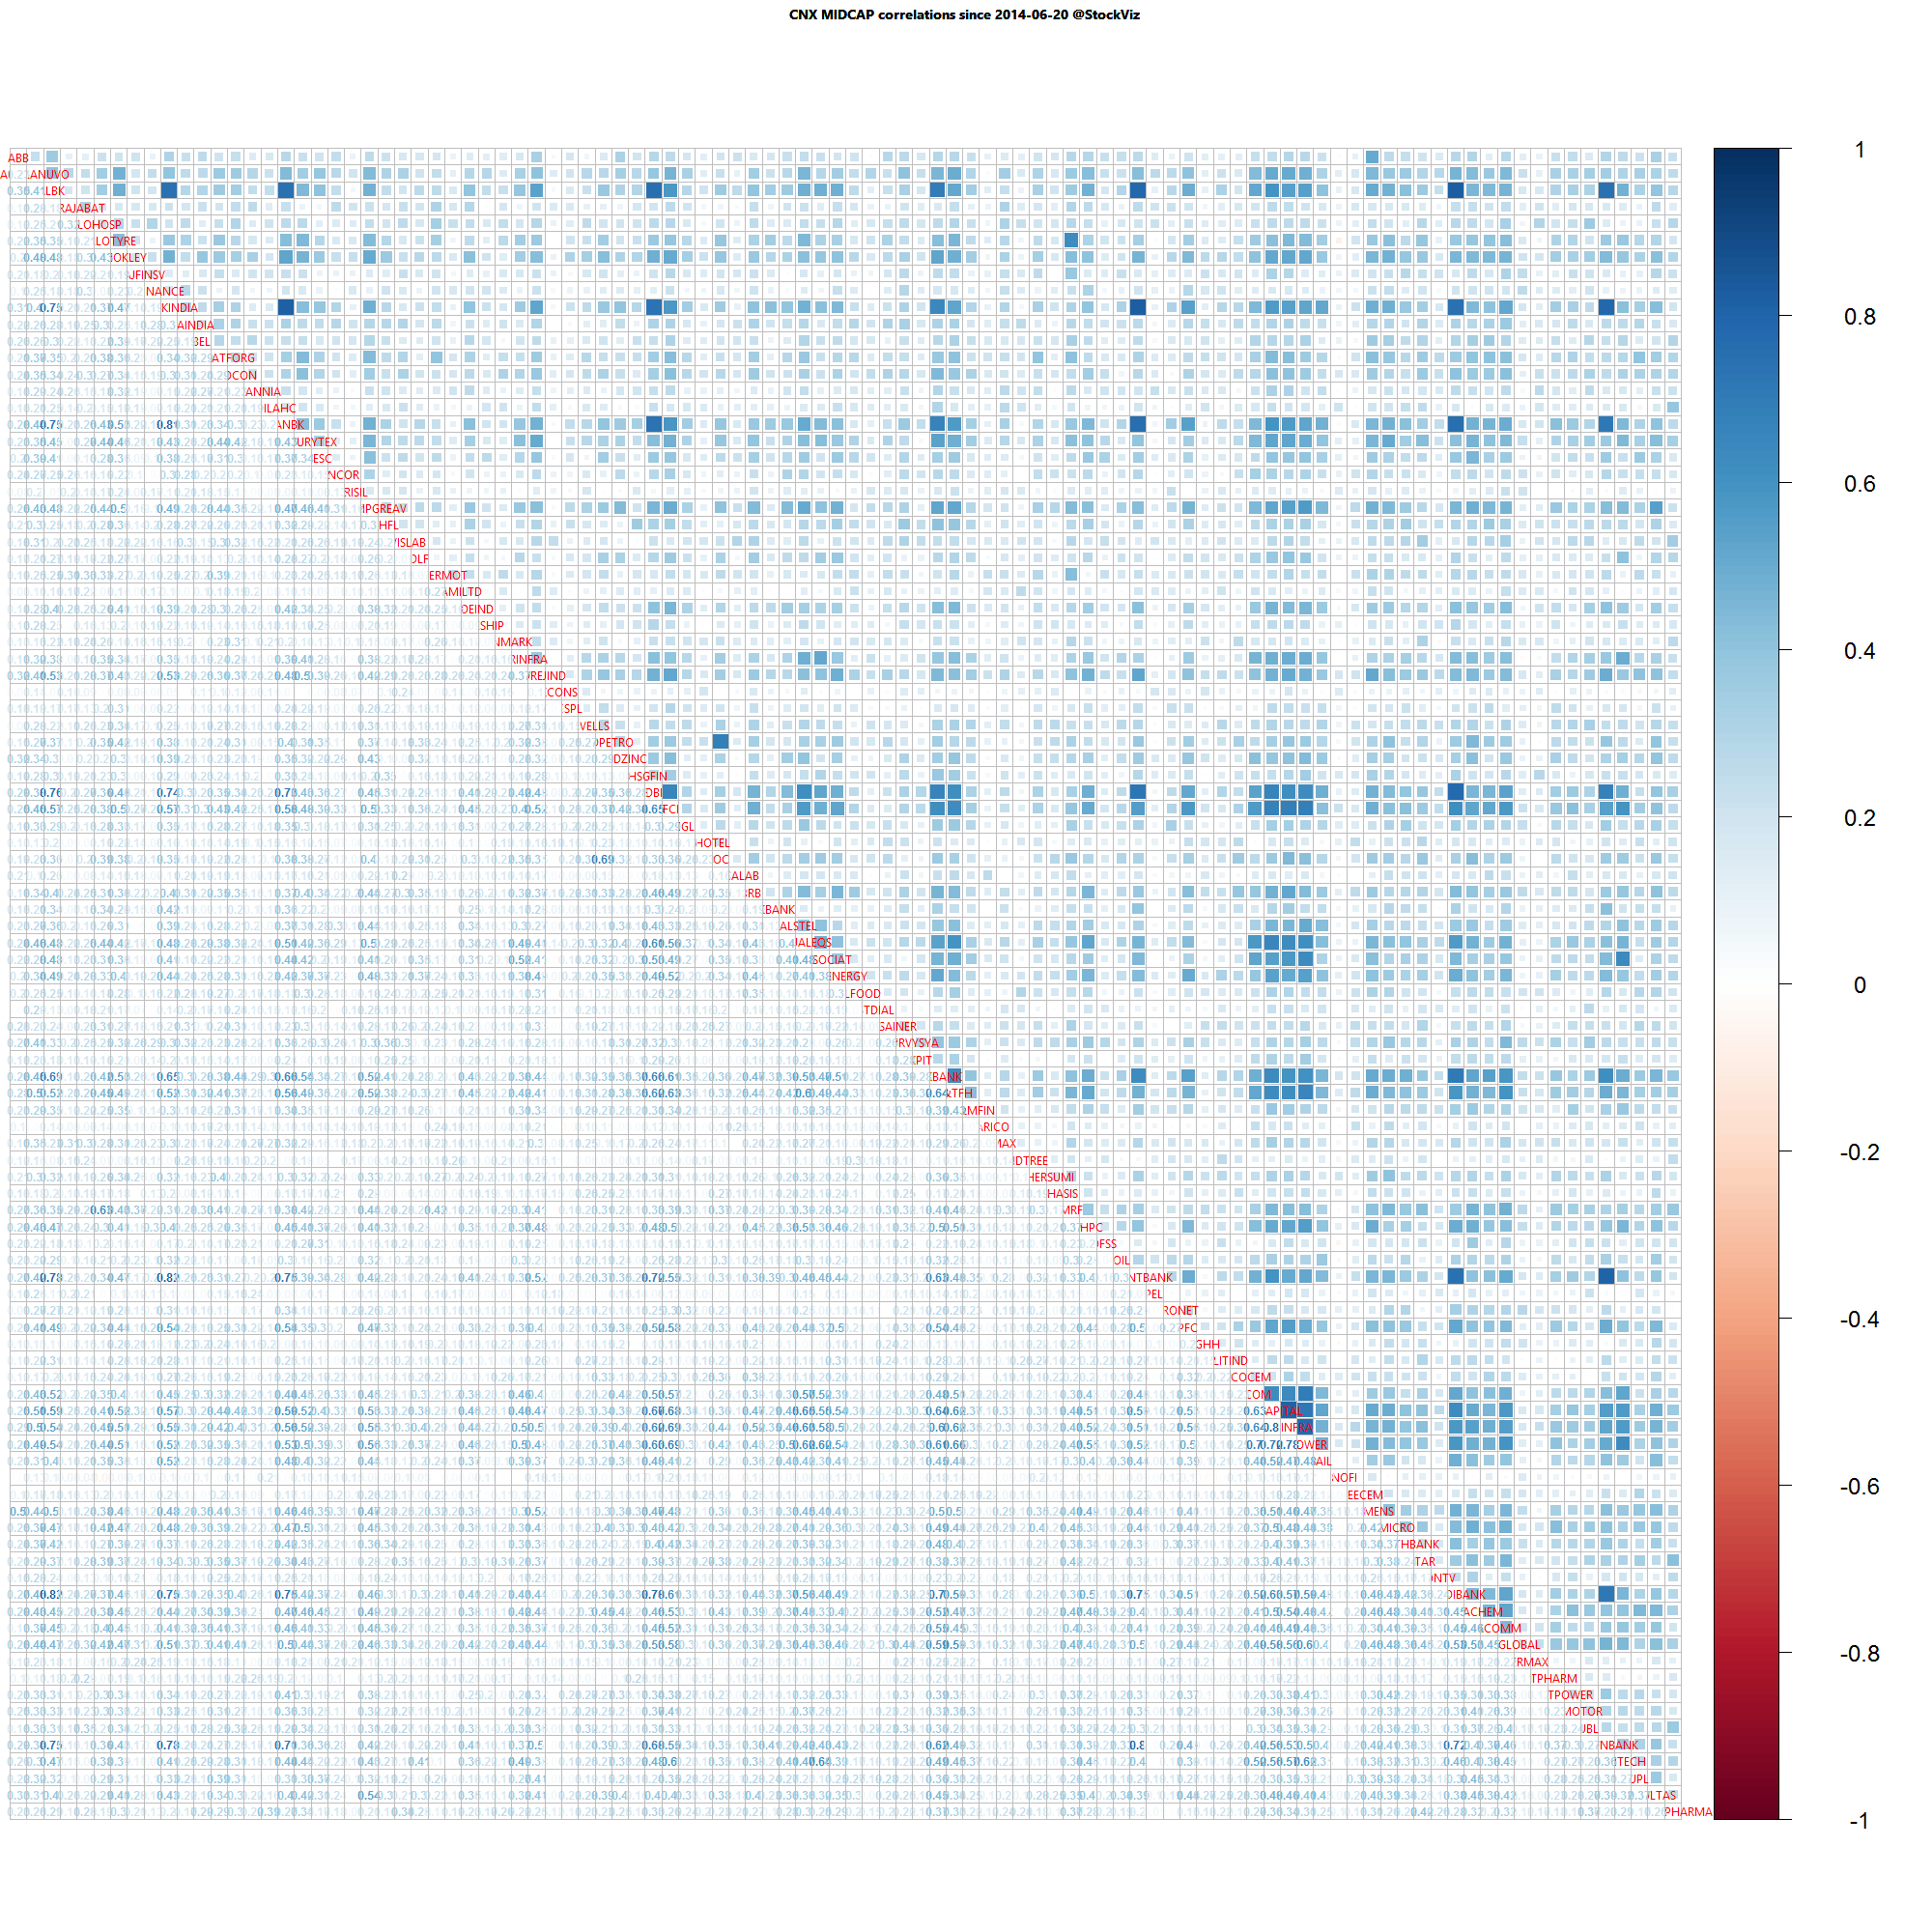
Midcap one year daily return correlations

Midcap one year daily return correlations

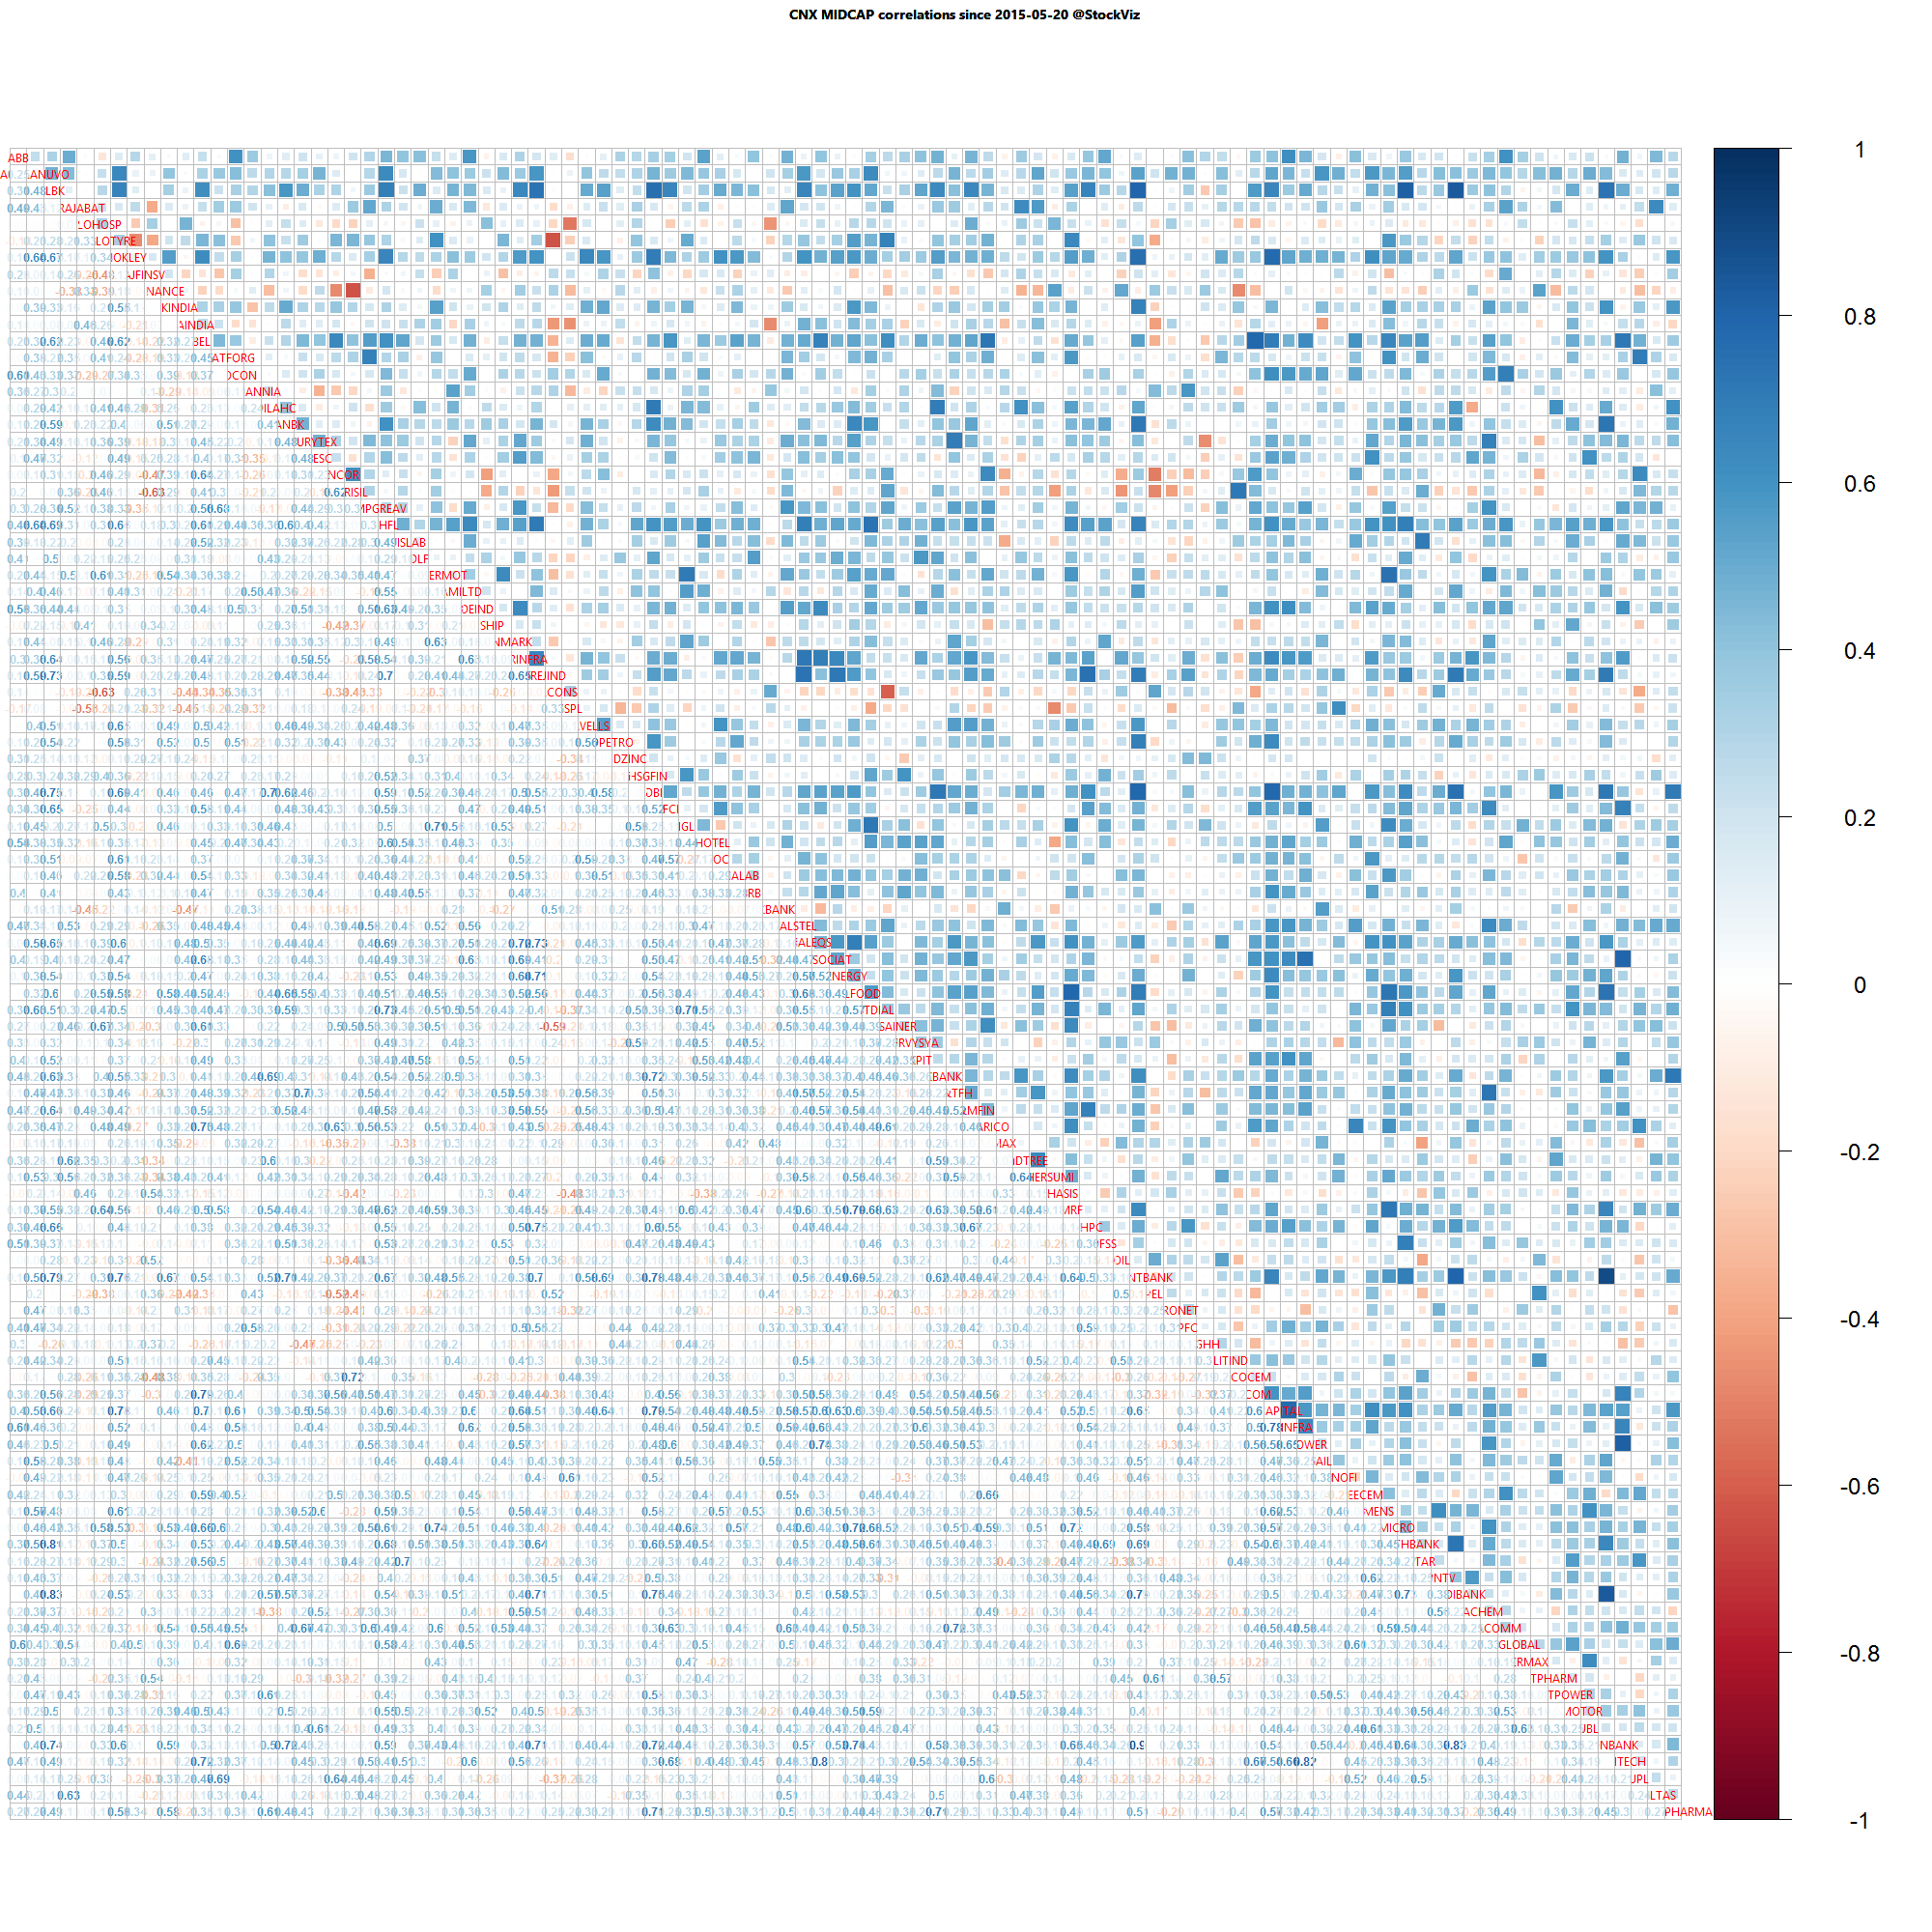
Midcap one month daily return correlations

Midcap one month daily return correlations

A lot of thick blue squares mean that positive correlations are high. Red squares mean negative correlations are high. Whites are the doldrums.

Mutual Fund Performance Chasing

Introduction

Mutual fund sales brochures and distributors often highlight past performance. Why? Because performance sells. The disclaimer that “past performance is not an indicator of future returns” is buried in small-print at the back of the book.

To see how bad a predictor past performance is of future returns, we came up with a novel idea. We used the Relative Strength Spread that we wrote about recently and applied it to mutual fund returns. This gave us three things:

  1. Normalized returns with respect to CNX 500 irrespective of the fund’s benchmark.
  2. A visualization of the performance gap between the best and the worst funds. And,
  3. A parade of top-10 and bottom-10 funds across different periods of time.

Relative Performance

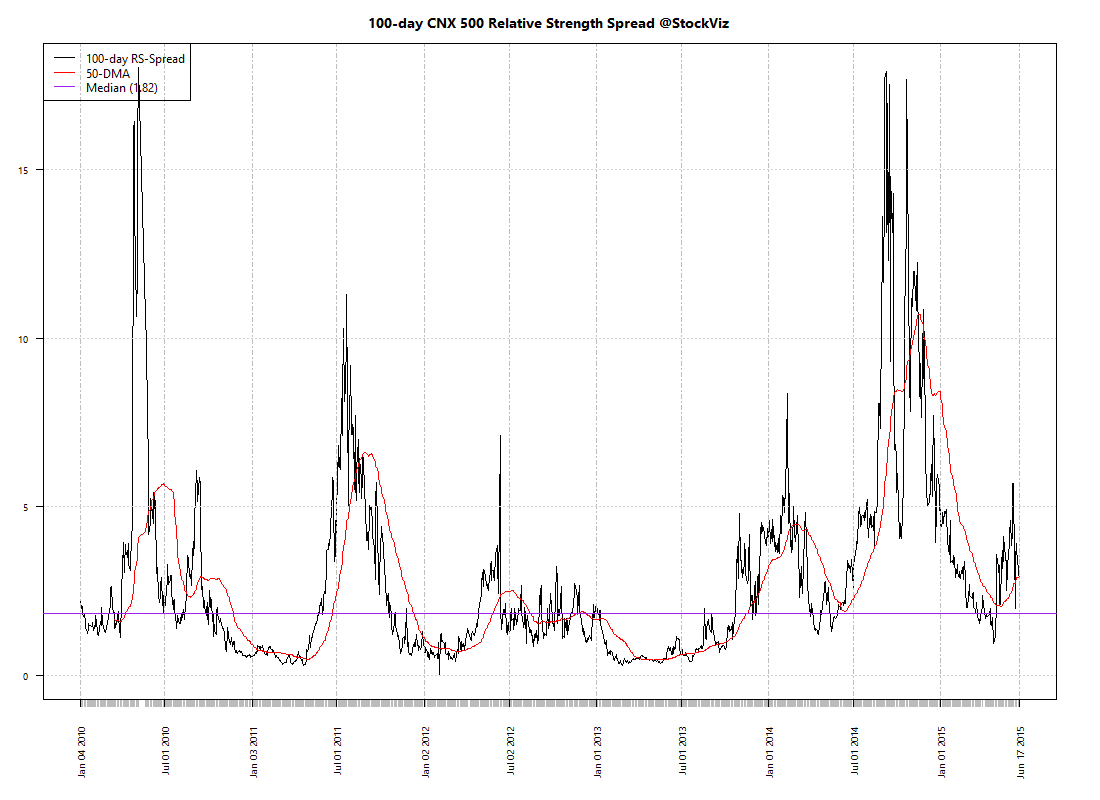
Here’s how the spread between the top and bottom-decile looks like with a 100-day lookback:
CNX 500.mf.relative-spread-index.100

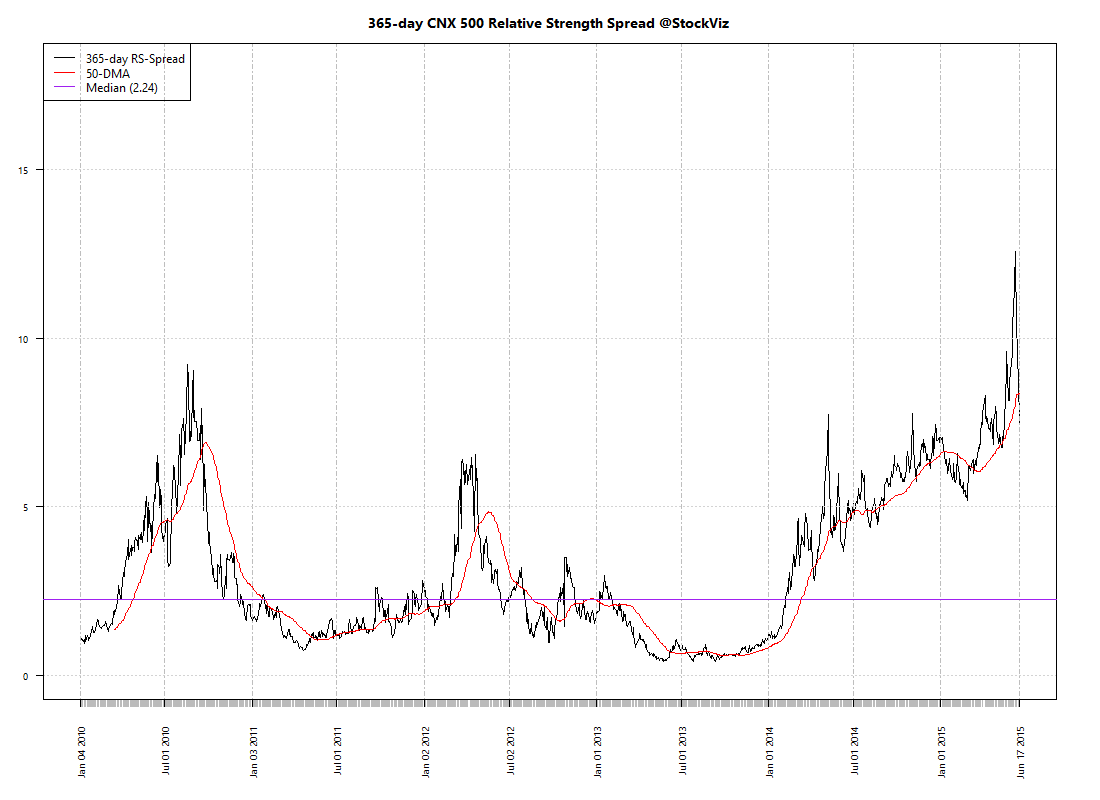
And with a 365-day lookback:
CNX 500.mf.relative-spread-index.365

When the broad markets go up, the performance gap between the best and the worst funds widen. Some managers wring more out the markets than the others. However, during the bear phase, the relative performance between different funds compress. If the market is bad, they all look beige.

Longevity of returns

Is the out-performance sustainable? If you picked the best performing fund this year, will it retain its position the next? Click to embiggen:

mutual fund relative performance decile

None of the top performers in 2010 retained their spot in 2011; same as in 2013 vs. 2014. There were a few cases where funds in the top-decile slipped to the bottom decile the next year. It is a total crap-shoot.

Conclusion

There is absolutely no connection between past performance and future returns. If fund managers require a broad-based rally in the markets to out-perform, then they are in effect, chasing momentum.

Investing in Non-Rupee Assets

Introduction

Indian investors have a significant home bias – we tend to hold a high proportion of our portfolio, sometimes 100%, in Indian assets. However, if you look at how the rupee has behaved vis-a-vis the US Dollar, the advantage of international diversification becomes obvious.

USDINR has been a one-way trade

Historically, the rupee has only depreciated against the dollar. It is the price we pay for being a socialist democracy with poor fiscal responsibility and an unaccountable central bank.

Depreciation quantified

Nifty investors have seen an IRR of 821% since 1991 and today. However, in dollar terms, the IRR is 286%. The difference of 535% is because of rupee depreciation – even if you had held on to a non-productive dollar asset, you would have made that much in rupee terms.

nifty.vs.defty.1991

Diversification benefit

By being long only Indian assets, your fate is tied to the vagaries of the local market participants, regulators and politicians. In a country where most people have dual-SIM phones, it is surprising that most investors are willing to hitch their ride to that pony.

One of the oldest international funds is from Birla Sun Life, let us see how that fared since the financial crisis:

Between 2008-01-01 and 2015-06-15, Birla Sun Life International Equity Fund Plan A- Growth has returned a cumulative 69.99% with an IRR of 7.37% vs. CNX Midcap’s cumulative return of 32.36% and an IRR of 3.83%. It has a beta of only 0.12825 vs. the Midcap index. (MorningStar)

Caveats

The biggest problem with investing in international funds is manager competence. All the reasons we highlighted in our post, Funds that (also) invest in foreign markets, apply. At the end of the day, you are still investing in equities and equity markets are (loosely) correlated. However, investors are better off choosing a pure international equity fund rather than one where the “international” part is a hobby.

The second problem is that there are some funds that invest in emerging Asia or frontier markets. These funds are not really long the dollar. Investors should pay attention to this detail.

Conclusion

Investing in international funds makes sense from a depreciation and diversification point of view. In our Aggressive Fund portfolio, we assign 30% of investor allocation to international funds.