Category: Your Money

Implied Volatility around Earnings Announcements

Introduction

There is a common belief that option implied volatility, which is high before earnings announcements, quickly dissipates after the event. So sell options before the event to profit from the fall in IV. We decided to put this theory to test by observing at-the-money IVs 5-days before earnings announcements and their subsequent behavior.

It is not what you expect.

ATM IVs

Here are the at-the-money implied vols 5-days before and the day after announcements:

atm iv announcement

In our study, IV falls only 44% of the time. So the blanket statement fails. IV dissipation is not guaranteed. There are a lot of other things that affect IV and earnings alone is not sufficient to predict the outcome.

However, if the IV was more the 50, then IV dissipates 70% of the time. However, these odds could be similar to those without earnings announcements as well (all things equal.) So further research is required.

Conclusion

Don’t go around selling options thinking that IV will dissipate after earnings announcements. Know your odds.

Macro Update June 2015

US TREASURIES VS. GILT SPREAD

The spread between 10yr US Treasuries and Indian Gilts remained within a tight range this month.
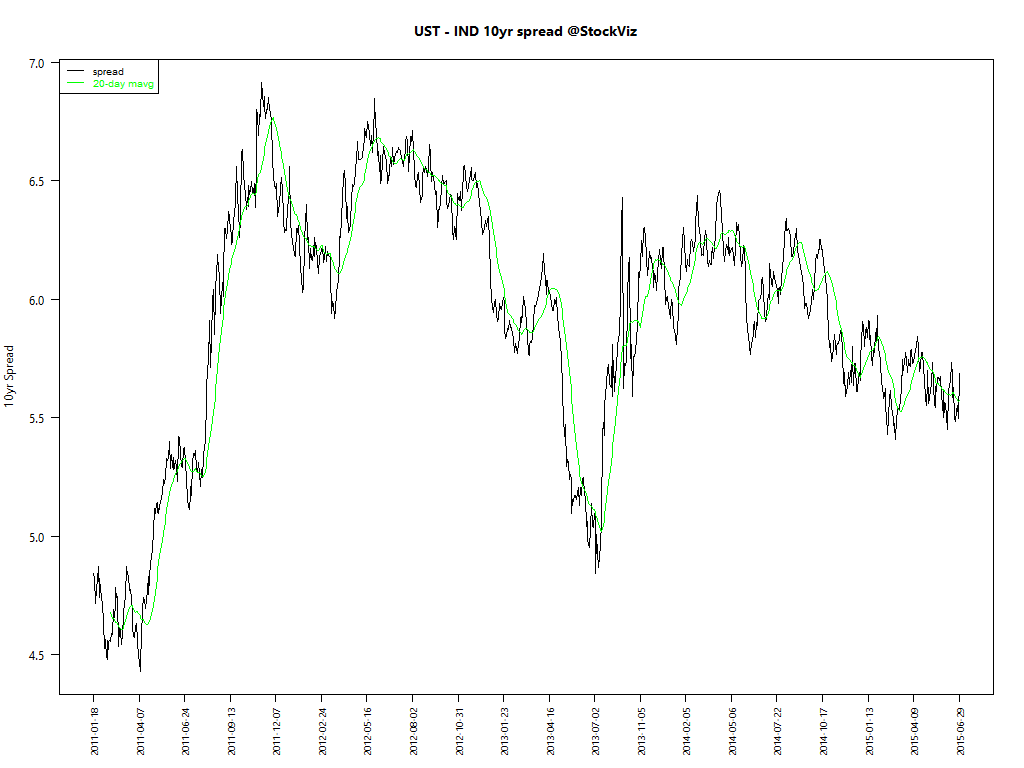
ust-ind-10yr-spread.2011-01-18

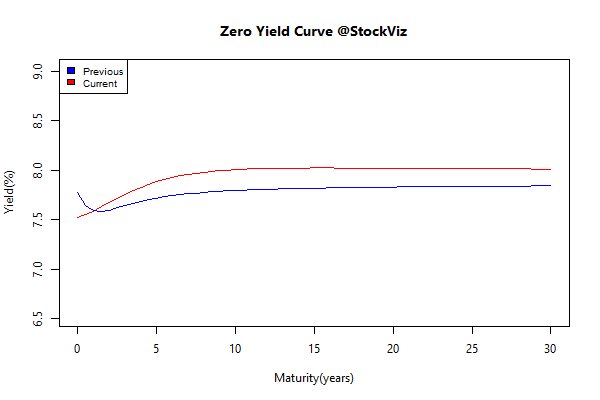
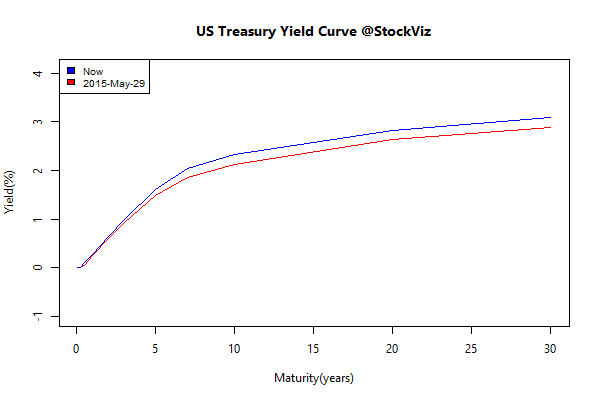
Long-term bond yields continued their ascent:
ust-yield-curve.2015-06-01

INSTITUTIONAL INVESTMENTS

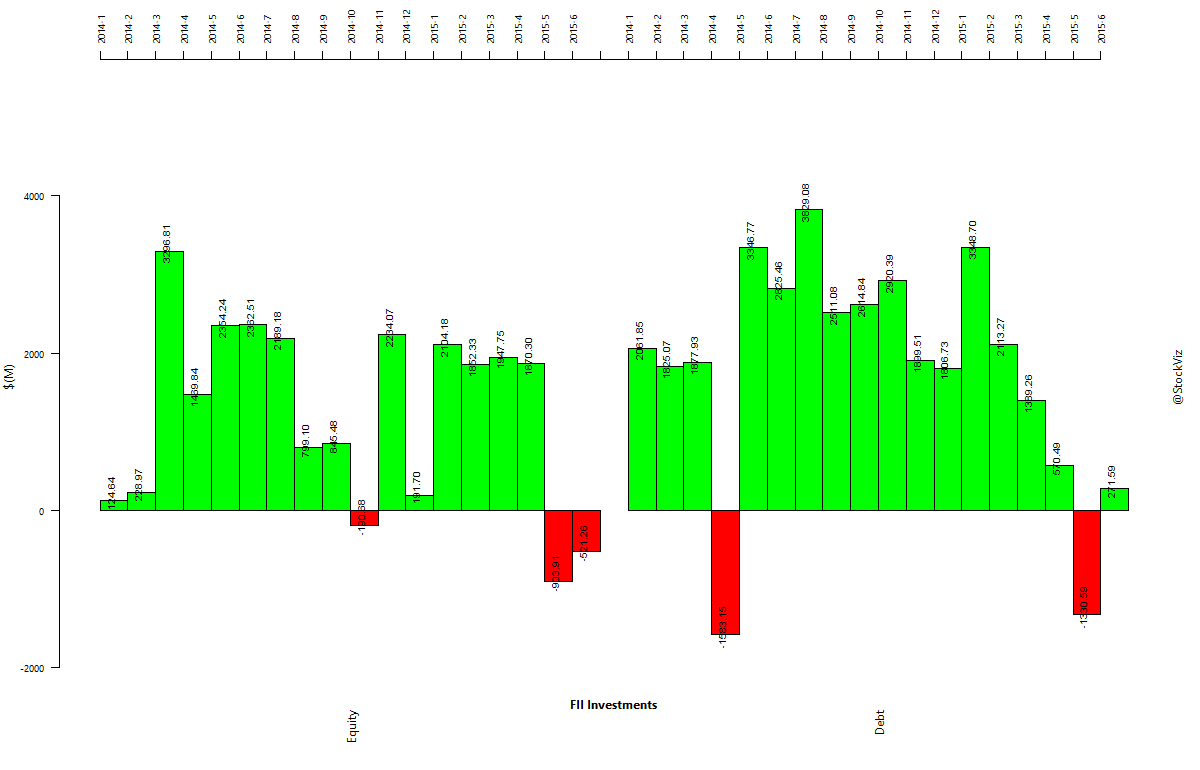
FIIs came back to the debt market but took money out of equities…
fii-investments.2014-01-01.2015-06-30

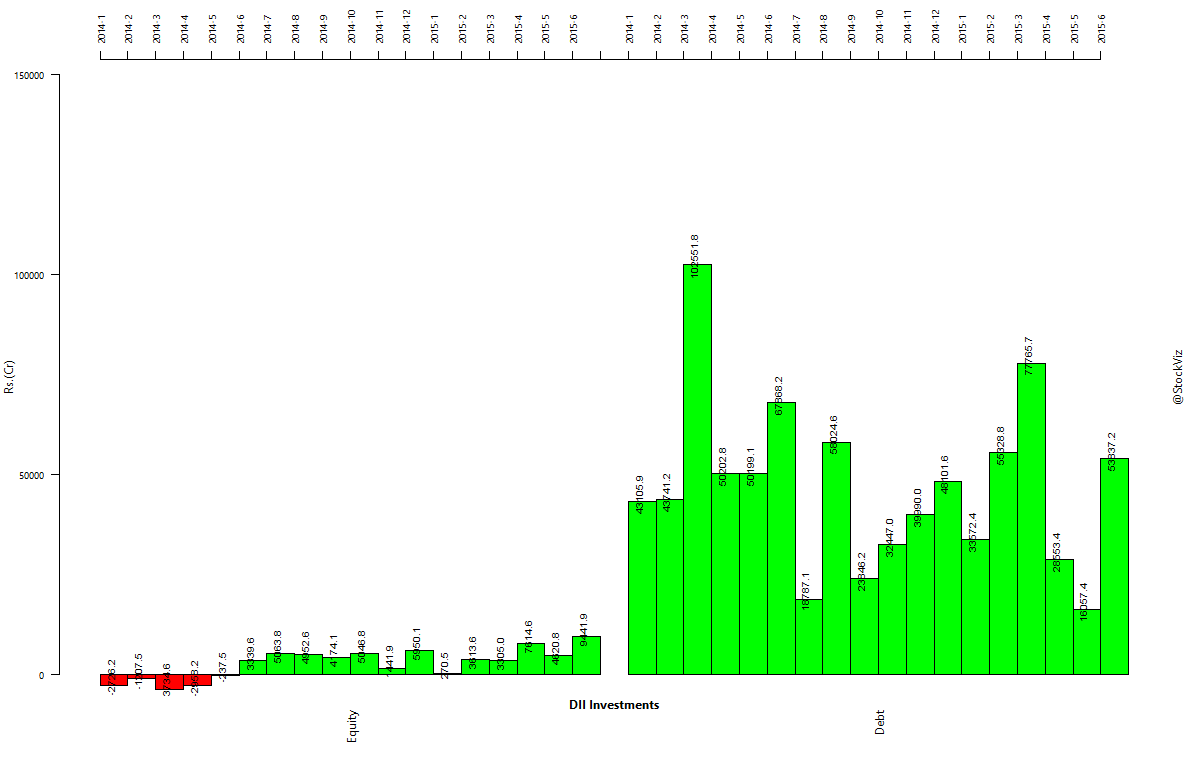
… while DIIs gulped down debt as well.
dii-investments.2014-01-01.2015-06-30

Oil

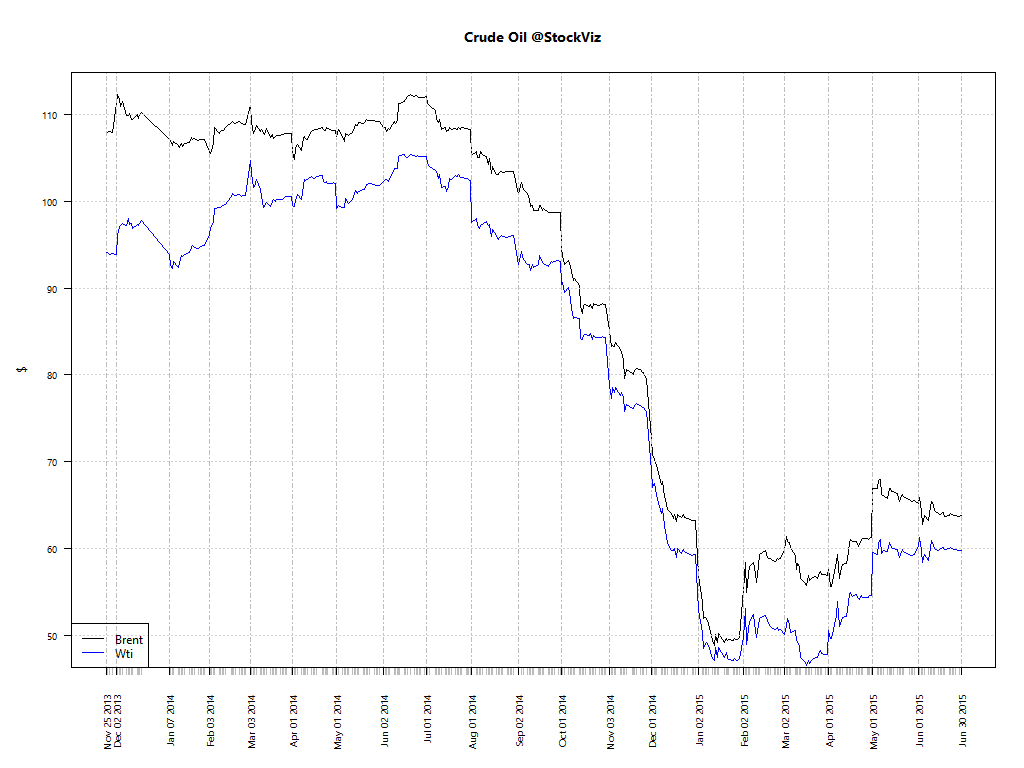
Oil futures remained flat.

wti-brent.2011-01-18

Gold

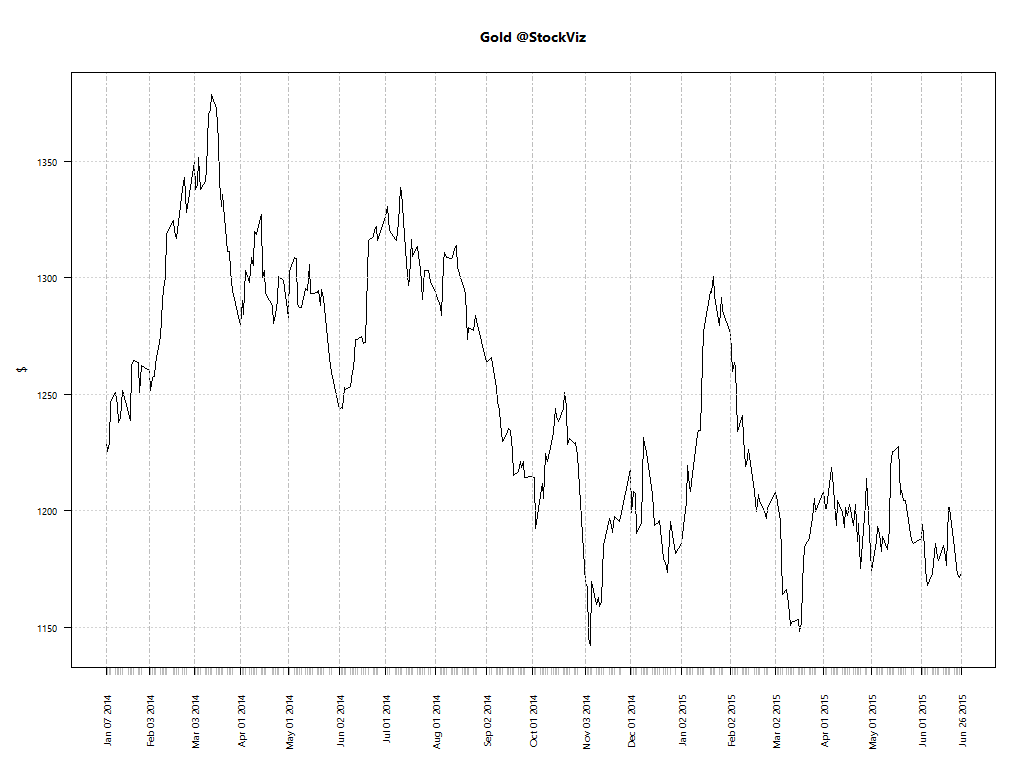
If all the uncertainties cannot move gold up, I am not sure what will.
gold.usd

Copper

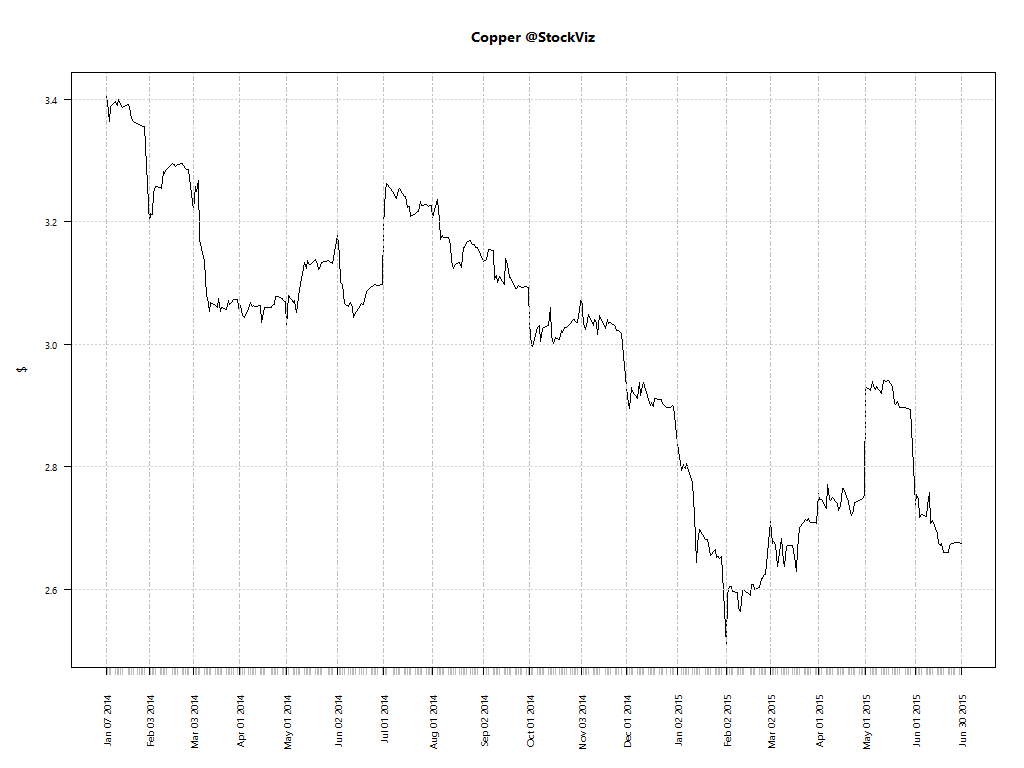
After a brief period of enthusiasm, it looks like copper has given up on industrial growth again.
copper.usd

Dollar Index

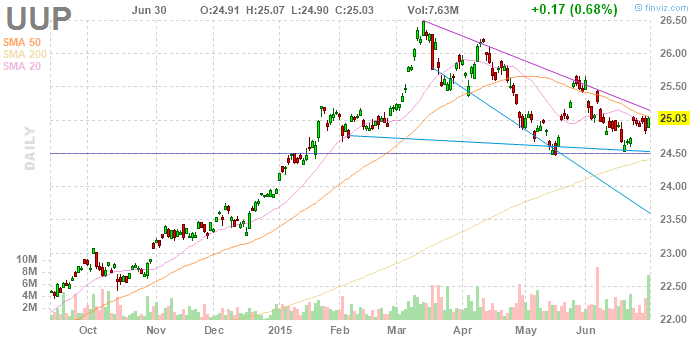
Looks like the dollar index (DXY) has found a range.
Outlook

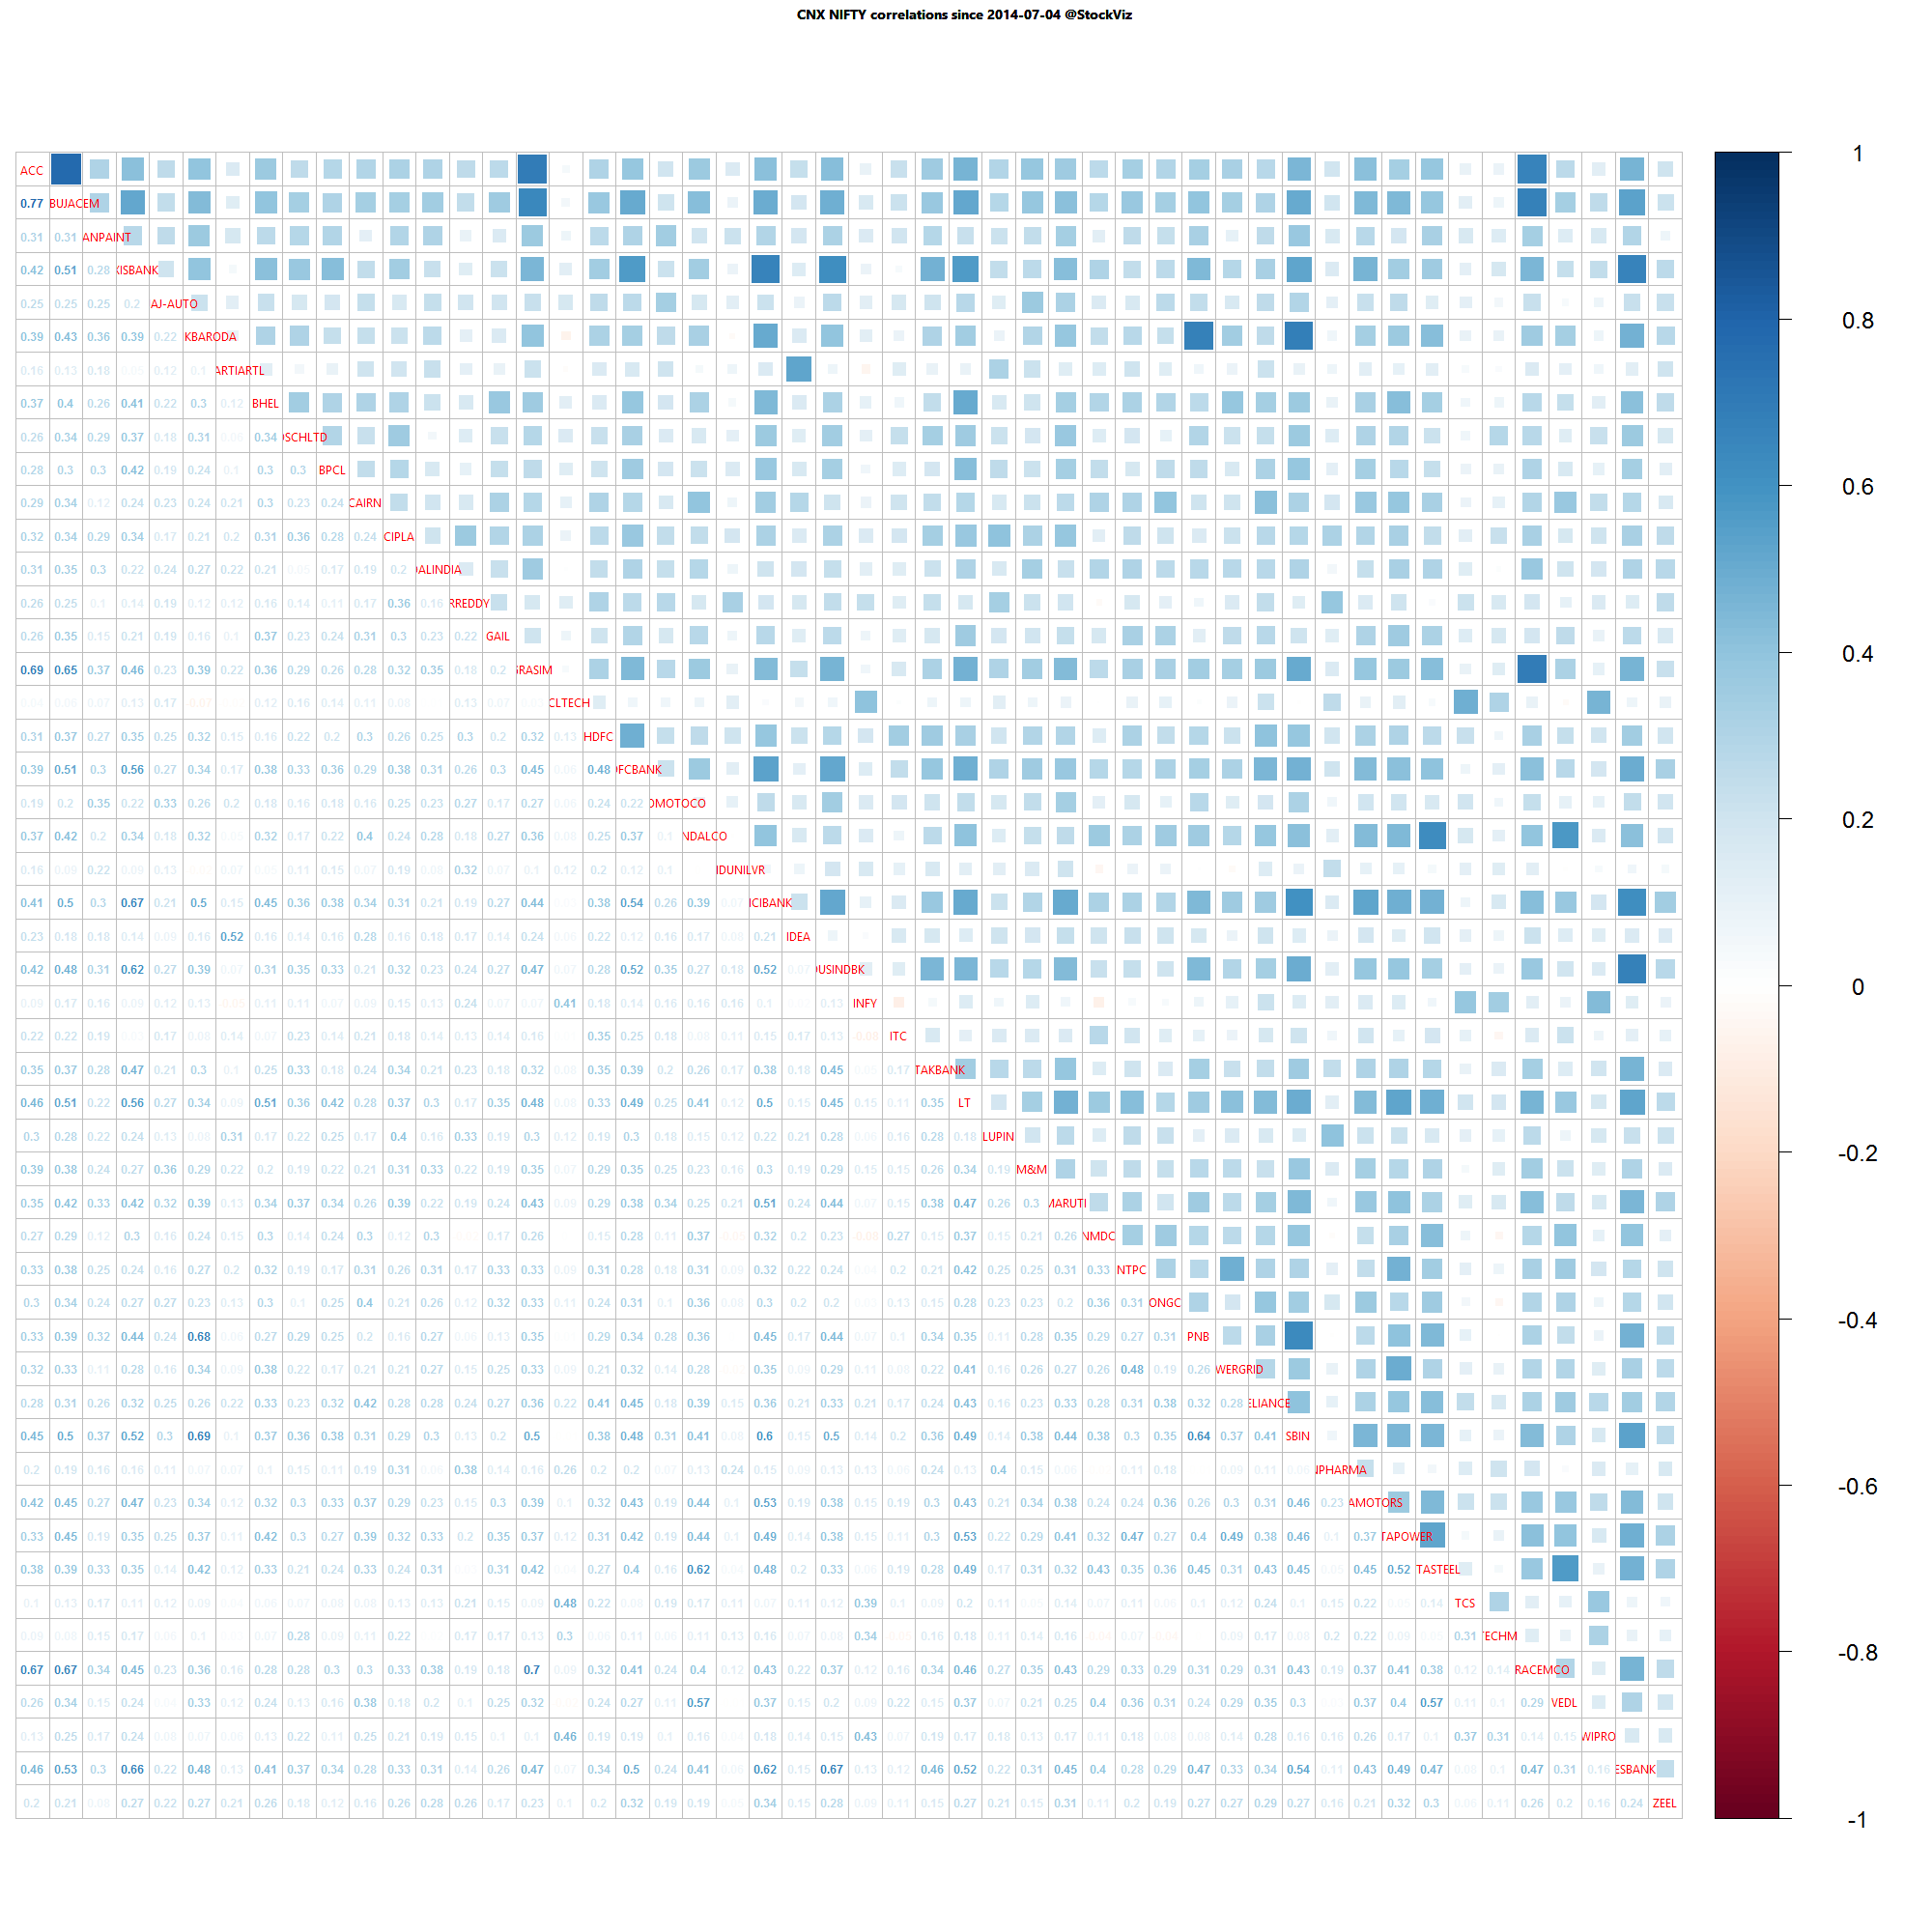
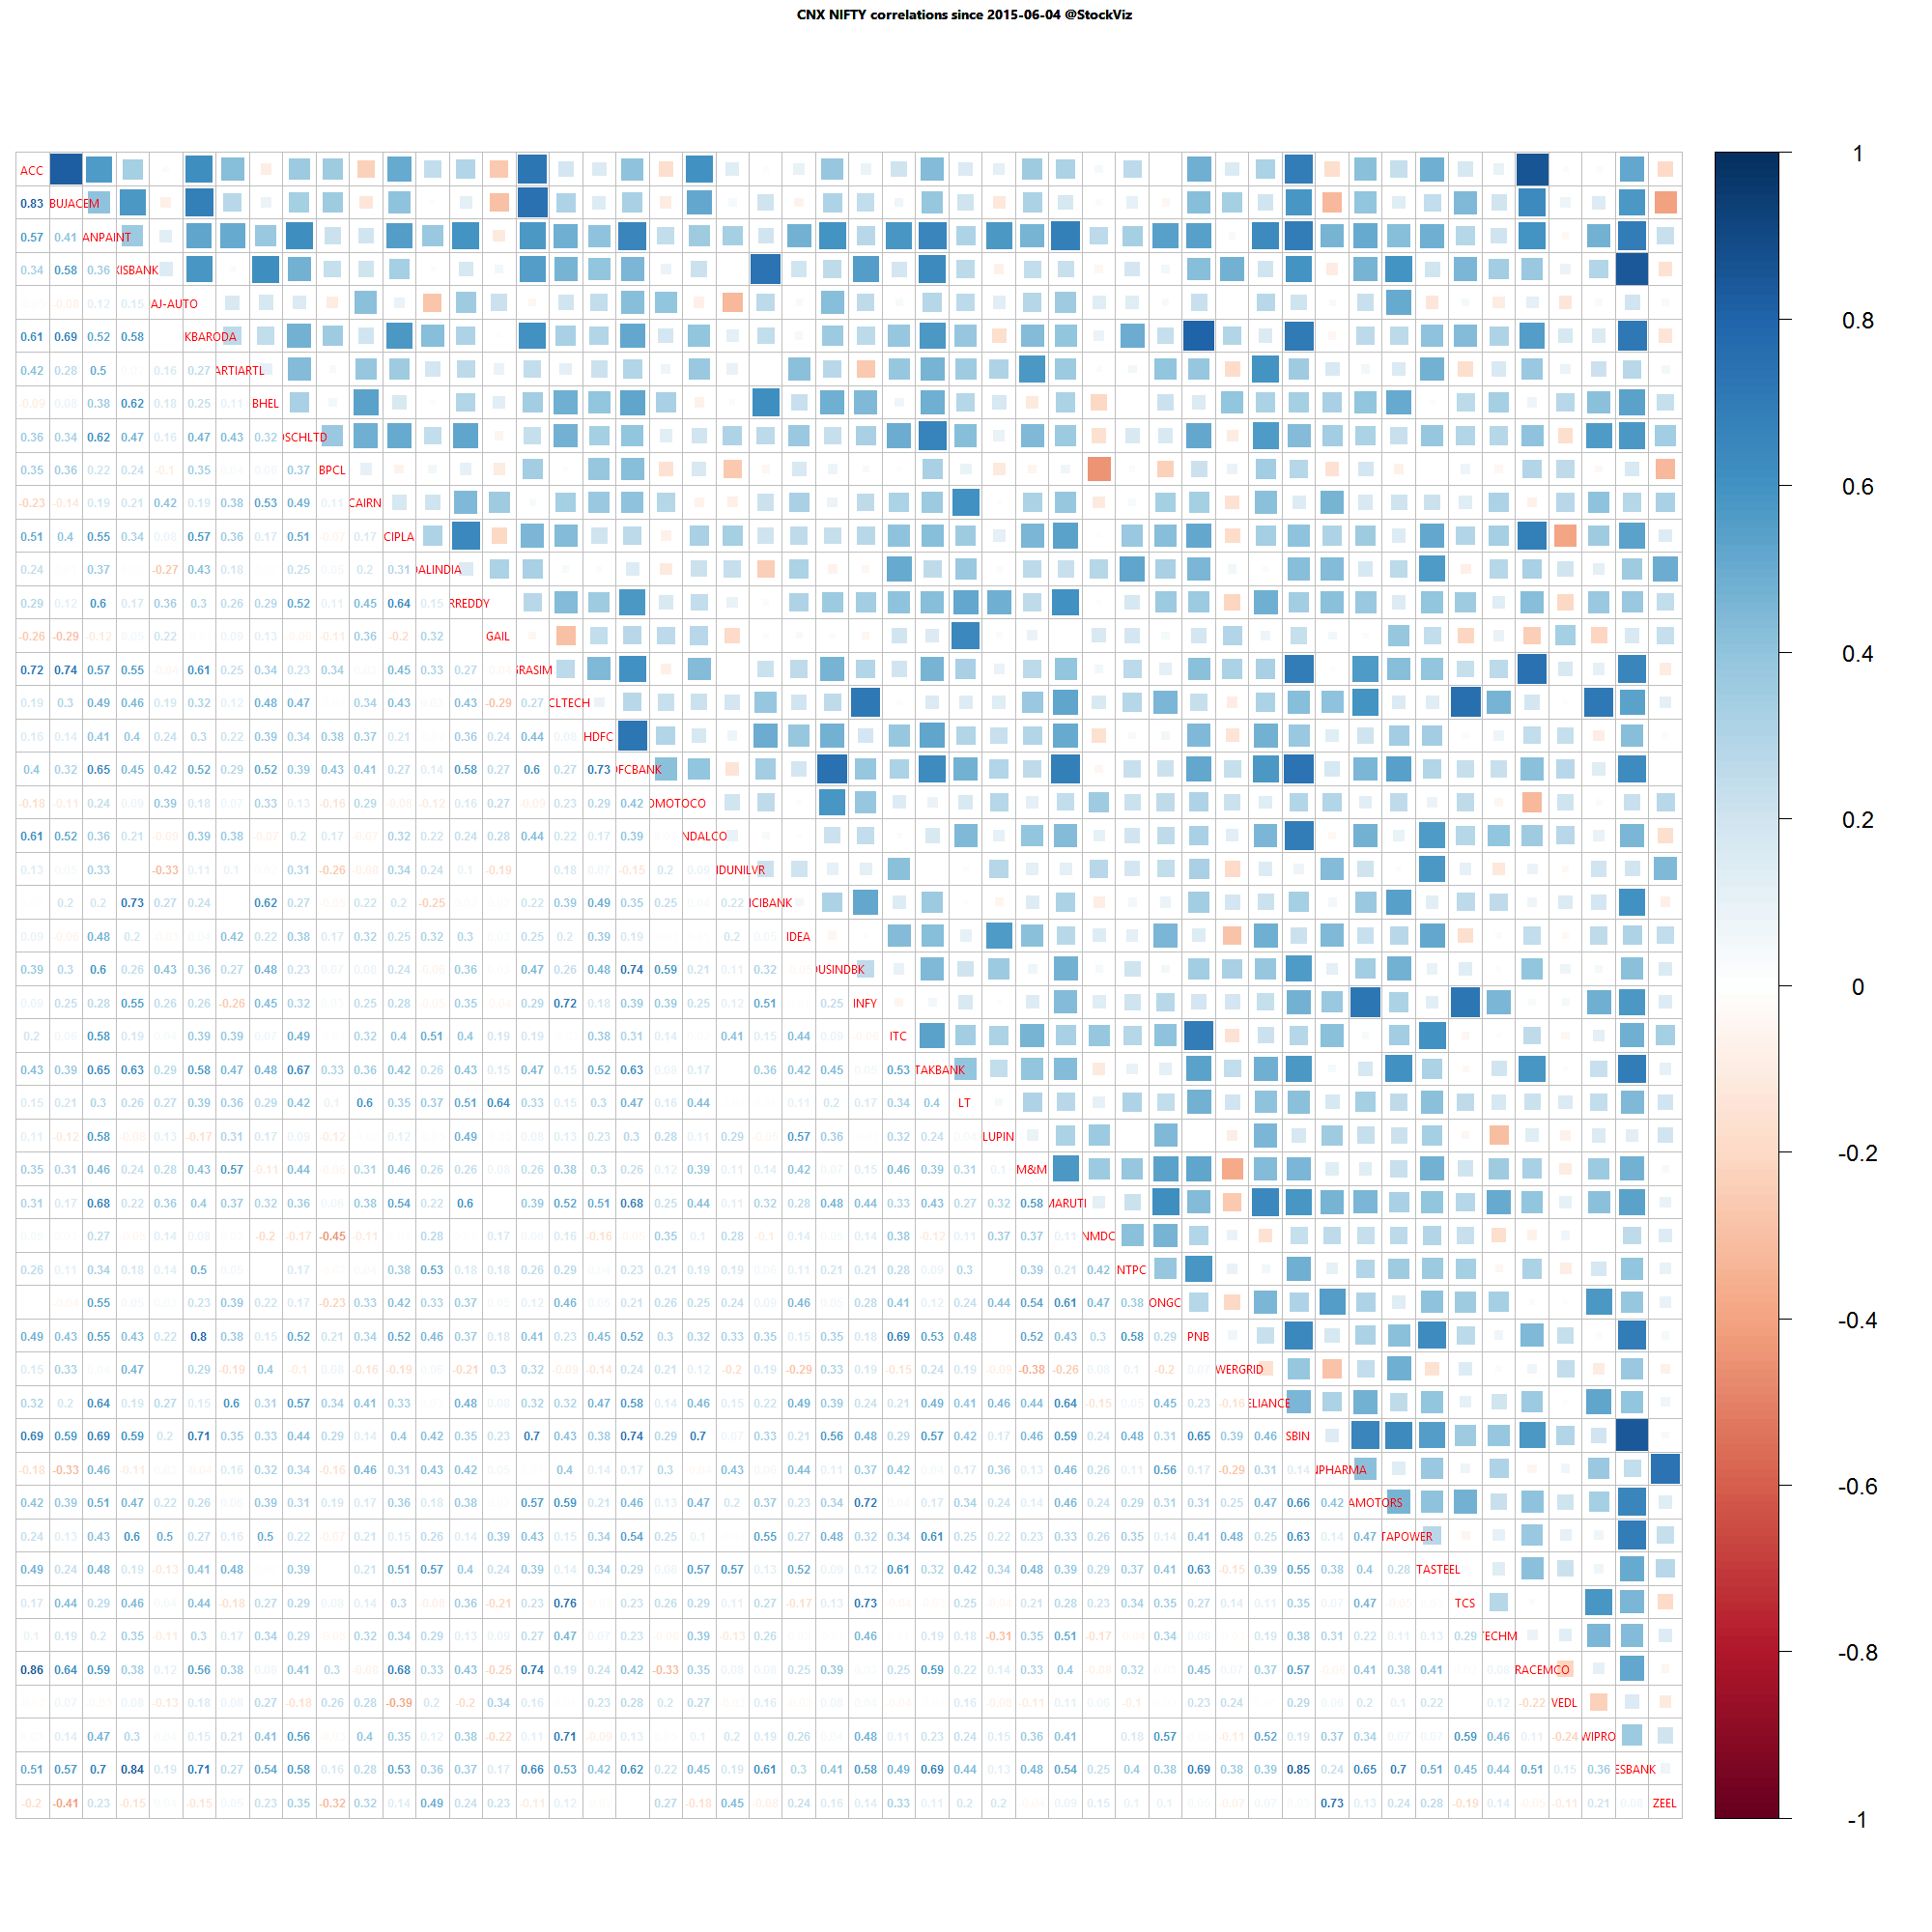
Although the Indian markets have shrugged off Grexit for now, nobody really knows the extent to which the contagion can spread. It’s basically a known unknown at this point.

With the monsoon expected to be normal and earnings to begin in earnest only by the end of July, the first couple of weeks of July is going to be driven by optimism.
Quarterly Recap: April-June 2015

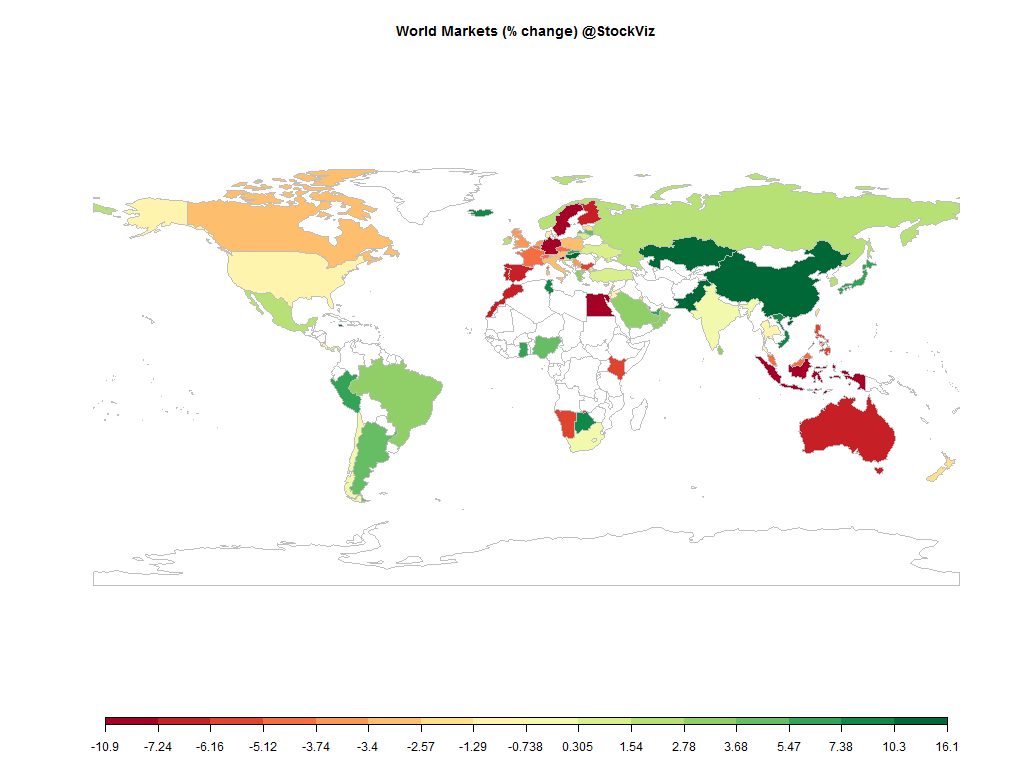
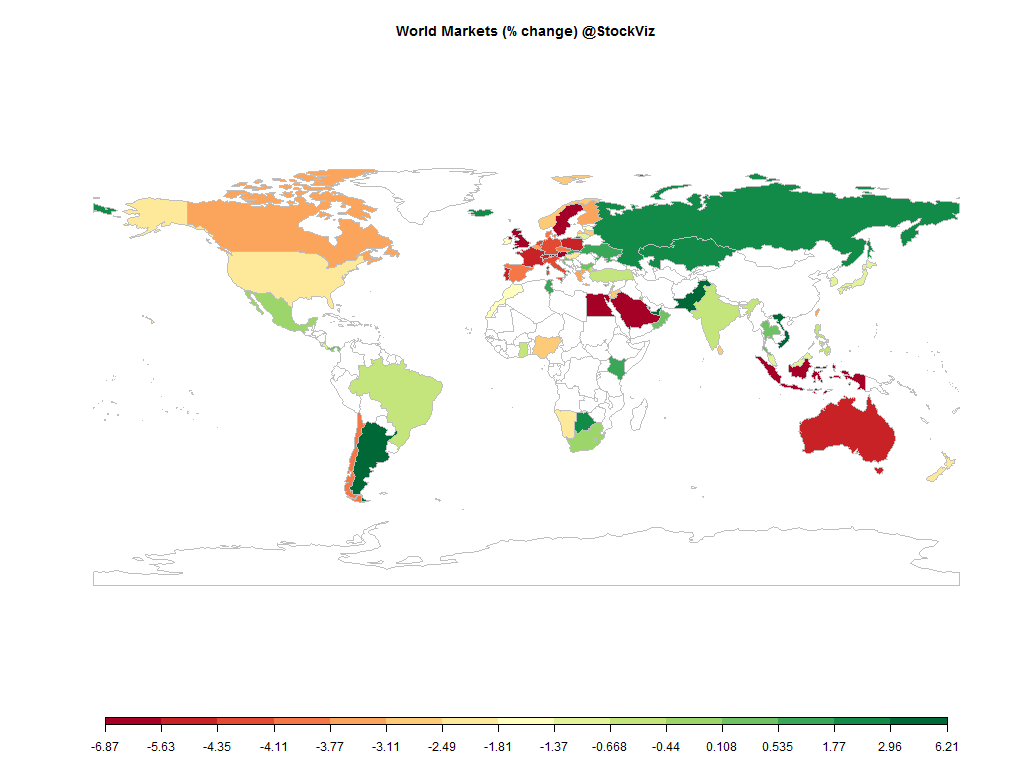
world.2015-03-31.2015-06-30

Equities

Major
DAX(DEU) -8.53%
CAC(FRA) -4.84%
UKX(GBR) -3.72%
NKY(JPN) +5.69%
SPX(USA) -0.77%
MINTs
JCI(IDN) -10.94%
INMEX(MEX) +2.75%
NGSEINDX(NGA) +5.37%
XU030(TUR) +1.37%
BRICS
IBOV(BRA) +3.41%
SHCOMP(CHN) +13.26%
NIFTY(IND) -0.71%
INDEXCF(RUS) +1.74%
TOP40(ZAF) +0.27%

Commodities

Energy
Heating Oil +9.46%
Natural Gas +6.38%
Ethanol +8.99%
WTI Crude Oil +22.10%
Brent Crude Oil +13.69%
RBOB Gasoline +14.29%
Metals
Copper -4.73%
Gold 100oz -0.74%
Platinum -4.72%
Palladium -6.21%
Silver 5000oz -6.02%

Currencies

USDEUR:-3.59% USDJPY:+2.18%

MINTs
USDIDR(IDN) +1.84%
USDMXN(MEX) +3.22%
USDNGN(NGA) -0.14%
USDTRY(TUR) +3.21%
BRICS
USDBRL(BRA) -3.60%
USDCNY(CHN) +0.03%
USDINR(IND) +1.85%
USDRUB(RUS) -4.47%
USDZAR(ZAF) +0.08%
Agricultural
Coffee (Robusta) +11.08%
Soybeans +7.68%
Cattle -8.30%
Cocoa +12.52%
Coffee (Arabica) -1.39%
Corn +9.44%
Feeder Cattle -1.47%
Lean Hogs +22.31%
Lumber +3.67%
White Sugar +3.99%
Cotton +6.00%
Soybean Meal +9.66%
Sugar #11 +4.00%
Wheat +17.70%
Orange Juice -7.16%

Credit Indices

Index Change
Markit CDX EM +3.41%
Markit CDX NA HY -1.55%
Markit CDX NA IG +3.77%
Markit iTraxx Asia ex-Japan IG +9.21%
Markit iTraxx Australia +11.15%
Markit iTraxx Europe +16.41%
Markit iTraxx Europe Crossover +27.41%
Markit iTraxx Japan +4.29%
Markit iTraxx SovX Western Europe +0.46%
Markit LCDX (Loan CDS) -0.19%
Markit MCDX (Municipal CDS) +5.20%
European markets got shellacked and global markets went from obsessing over Fed rate hikes to Grexit. We had our own monsoon scare and bond market turmoil even though the RBI is on an easing path…

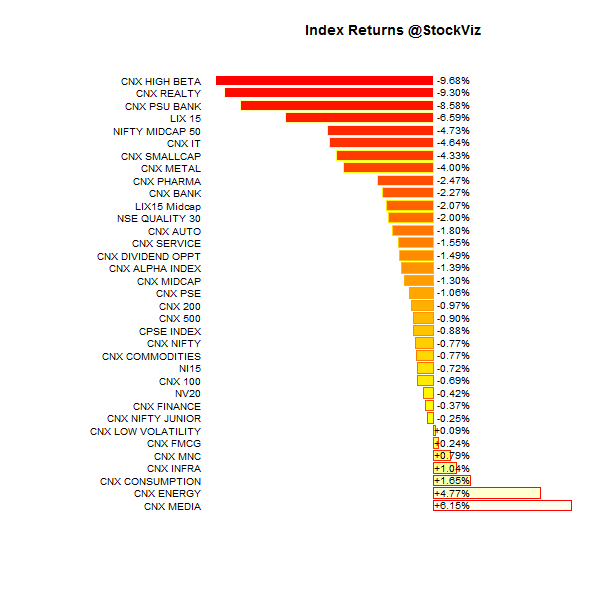
Index Returns

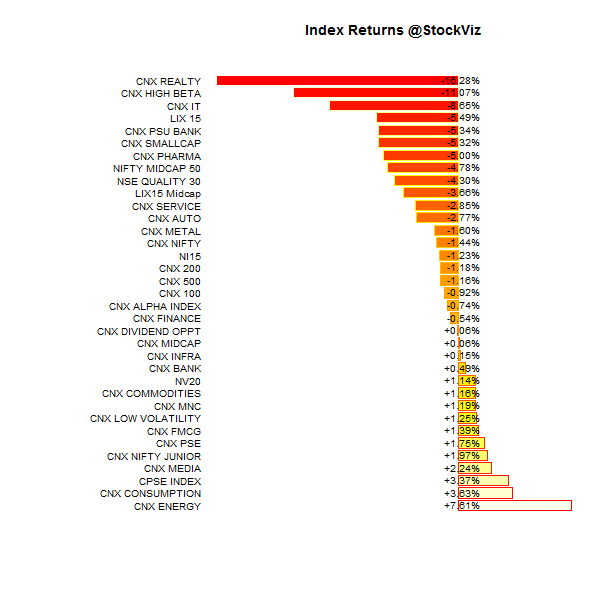
index.performance.2015-03-31.2015-06-30

Market Cap Decile Performance

Decile Mkt. Cap. Adv/Decl
1 (micro) +4.17% 68/64
2 +9.23% 69/62
3 +6.79% 73/58
4 +5.28% 71/61
5 +2.42% 62/69
6 +0.91% 61/70
7 -1.04% 57/75
8 -1.14% 60/71
9 -5.65% 59/72
10 (mega) -0.60% 58/74
Large-caps held steady…

Top Winners and Losers

BAJAJ-AUTO +26.05%
GLENMARK +26.46%
BRITANNIA +28.00%
CANBK -24.46%
TECHM -24.12%
SRTRANSFIN -23.41%
Looks like Bajaj Auto finally turned the corner…

ETF Performance

CPSEETF +3.18%
BANKBEES +1.65%
JUNIORBEES +1.51%
GOLDBEES +0.87%
NIFTYBEES -0.83%
INFRABEES -2.69%
PSUBNKBEES -4.35%
PSU Banks were the most despised asset class…

Yield Curve

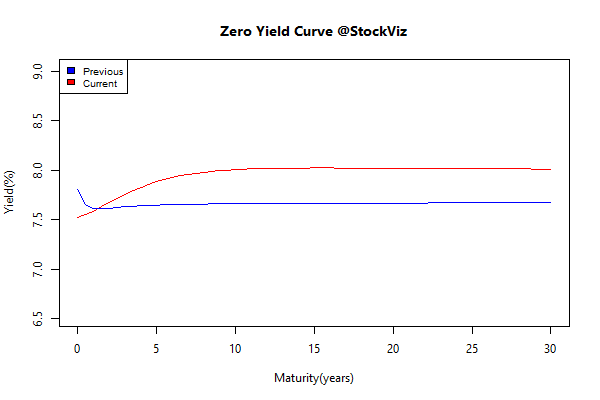
yieldCurve.2015-03-31.2015-06-30

Bond Indices

Sub Index Change in YTM Total Return(%)
GSEC TB -0.36 +2.06%
GSEC SUB 1-3 +0.07 +1.73%
GSEC SUB 3-8 +0.07 +0.10%
GSEC SUB 8 +0.39 -1.09%
Yields went up…

Interbank lending rates

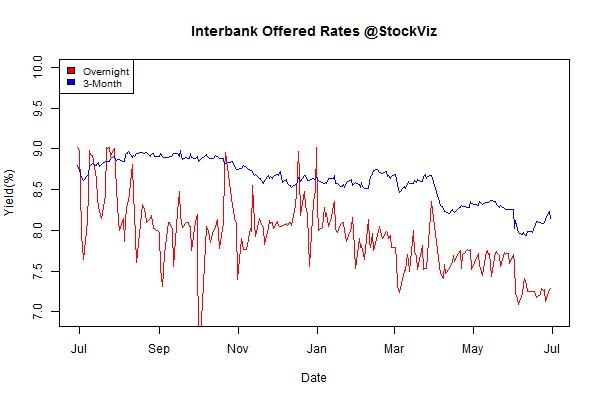
mibor.30days.2015-06-30

Investment Theme Performance

Equity Mutual Funds

Bond Mutual Funds

Monthly Recap: Letting Go of the Why

world.2015-05-29.2015-06-30

Equities

Major
DAX(DEU) -4.11%
CAC(FRA) -4.35%
UKX(GBR) -6.64%
NKY(JPN) -1.35%
SPX(USA) -2.33%
MINTs
JCI(IDN) -5.63%
INMEX(MEX) +0.08%
NGSEINDX(NGA) -2.49%
XU030(TUR) -0.56%
BRICS
IBOV(BRA) -0.64%
SHCOMP(CHN) -7.62%
NIFTY(IND) -0.57%
INDEXCF(RUS) +2.82%
TOP40(ZAF) -0.31%

Commodities

Energy
Brent Crude Oil -4.12%
WTI Crude Oil -2.96%
Heating Oil -3.91%
Ethanol +4.61%
Natural Gas +7.28%
RBOB Gasoline -2.67%
Metals
Palladium -12.83%
Platinum -2.52%
Copper -5.07%
Gold 100oz -1.45%
Silver 5000oz -6.59%

Currencies

USDEUR:-1.33% USDJPY:-1.15%

MINTs
USDIDR(IDN) +0.69%
USDMXN(MEX) +2.29%
USDNGN(NGA) +0.15%
USDTRY(TUR) +0.73%
BRICS
USDBRL(BRA) -2.61%
USDCNY(CHN) +0.06%
USDINR(IND) -0.25%
USDRUB(RUS) +6.14%
USDZAR(ZAF) +0.09%
Agricultural
Corn +17.28%
Soybeans +12.15%
White Sugar +5.92%
Cattle -2.87%
Cocoa +1.42%
Coffee (Arabica) +3.44%
Feeder Cattle -3.67%
Lumber +5.57%
Soybean Meal +16.68%
Sugar #11 +4.00%
Wheat +27.02%
Coffee (Robusta) +15.36%
Cotton +4.09%
Lean Hogs -9.18%
Orange Juice +0.57%

Credit Indices

Index Change
Markit CDX EM -0.46%
Markit CDX NA HY -0.63%
Markit CDX NA IG +3.48%
Markit iTraxx Asia ex-Japan IG +1.61%
Markit iTraxx Australia +1.97%
Markit iTraxx Europe +3.03%
Markit iTraxx Europe Crossover +10.35%
Markit iTraxx Japan +4.34%
Markit iTraxx SovX Western Europe -0.80%
Markit LCDX (Loan CDS) -0.04%
Markit MCDX (Municipal CDS) -1.32%
An eventful month comes to an end. The Chinese bubble popped, the Greek drama is playing out, people stopped obsessing about the Fed raising rates and monsoons went from being a headwind to a tailwind.

Index Returns

index.performance.2015-05-29.2015-06-30

Market Cap Decile Performance

Decile Mkt. Cap. Adv/Decl
1 (micro) -5.56% 59/70
2 -2.35% 56/73
3 -2.72% 58/71
4 -2.32% 58/71
5 -0.54% 62/67
6 -4.34% 59/70
7 -1.46% 64/65
8 -2.39% 53/76
9 -2.65% 57/72
10 (mega) -0.34% 64/65
Midcaps got totally hammered with the Midcap Index down 4.73%.

Top Winners and Losers

ZEEL +13.64%
RELIANCE +14.04%
GODREJCP +17.82%
CANBK -19.08%
RPOWER -15.14%
UNIONBANK -14.85%
Media companies as a whole did well. The CNX Media Index was the best performing index in June…

ETF Performance

INFRABEES +1.52%
NIFTYBEES -0.32%
JUNIORBEES -0.69%
CPSEETF -0.99%
BANKBEES -1.52%
GOLDBEES -1.63%
PSUBNKBEES -8.23%
Most PSU banks are just zombies at this point – the walking dead…

Yield Curve

yield Curve.2015-05-29.2015-06-30

Bond Indices

Sub Index Change in YTM Total Return(%)
GSEC TB -0.51 +0.82%
GSEC SUB 1-3 +0.15 +1.17%
GSEC SUB 3-8 +0.08 +0.17%
GSEC SUB 8 +0.14 -0.97%
Bonds were buffeted by gyrations in international bond markets and currency volatility…

Investment Theme Performance

Equity Mutual Funds

Bond Mutual Funds

Thought to sum up the month

When you’re constantly looking for a catalyst to explain every single move in the markets you start to see signals and correlations that just don’t exist. Most of the time we won’t know exactly why the markets moved a certain way until much later. Sometimes even with the benefit of perfect hindsight, investors still can’t agree on the specifics of the cause and effect. But to some the ‘why’ in the markets will always seem easy after the fact, so they keep searching for the answers.

Source: Letting Go of the Why

Stop-loss and Re-entry

Introduction

A trailing stop is a percentage below the most recent high at which you exit a trade. It allows you to lock-in gains while avoiding catastrophic loss. There are lot of opinions about where these should be set. And more importantly, when to re-enter. What follows is a discussion on how different stops and re-entry rules affect trading frequency and returns.

We will consider time-series from 2010 through now on the NIFTY, BANK NIFTY and CNX MIDCAP indices. During this time, the cumulative buy-and-hold returns were 61.47%, 104.81% and 75.61% respectively.

A simple 5-3 Rule

“A good plan violently executed now is better than a perfect plan executed next week.”
– George S. Patton

To get us started, we propose a trailing-stop loss at 5% and a re-entry rule that triggers when the index covers 3% from the lowest level since exiting the trade. This rule significantly increases returns and reduces draw-downs across all indices.

nifty.stop-loss.2010.5.3

bank-nifty.stop-loss.2010.5.3

mid-cap.stop-loss.2010.5.3

Index #trades cum. returns
Nifty 139 366%
Bank Nifty 209 2291%
Midcap 159 382%
The boost in returns come at additional trading costs. And even though the average number of trades work out to less than one a week, there maybe periods where it might trigger every day.

The 5-3 Trading frequency

Let’s plot the days on which this rule triggers (both buys and sells.)

nifty.stop-loss.trades

bank-nifty.stop-loss.trades

mid-cap.stop-loss.trades

By the looks of it, the stop-loss and re-entry bands are too narrow.

The 10-5 Rule

Suppose we set the trailing-stop loss at 10% and re-enter when the index covers 5%, we end up with a strategy with lower number of trades and yet, better returns and buy-and-hold.

Index #trades cum. returns
Nifty 50 100%
Bank Nifty 103 536%
Midcap 66 162%
Lower trading but lower returns as well.

Returns:
nifty.stop-loss.2010.10.5

bank-nifty.stop-loss.2010.10.5

mid-cap.stop-loss.2010.10.5

Trading Events:

nifty.stop-loss.trades.10-5

bank-nifty.stop-loss.trades.10-5

cnx-midcap.stop-loss.trades.10-5

Trailing stop-loss and re-entry scenarios

The master list of different strategies, their trading frequencies and cumulative returns.

trailing stop-loss and re-entry scenarios

Conclusion

Having a trailing stop-loss and re-entry strategy enhances returns but at the price of increased trading frequency. No combination of strategies can escape the doldrums – where the index is basically flat and you are getting whipsawed.

With a 15% tax on short-term gains, over the 5-year period, you should handicap strategy returns by 75% to do an apples-to-apples comparison on the tax-free buy-and-hold returns. If you use the 10-5 rule, it means you will only come-out ahead trading the Bank Nifty. So you are better off with the 5-3 rule given where trading costs stand.