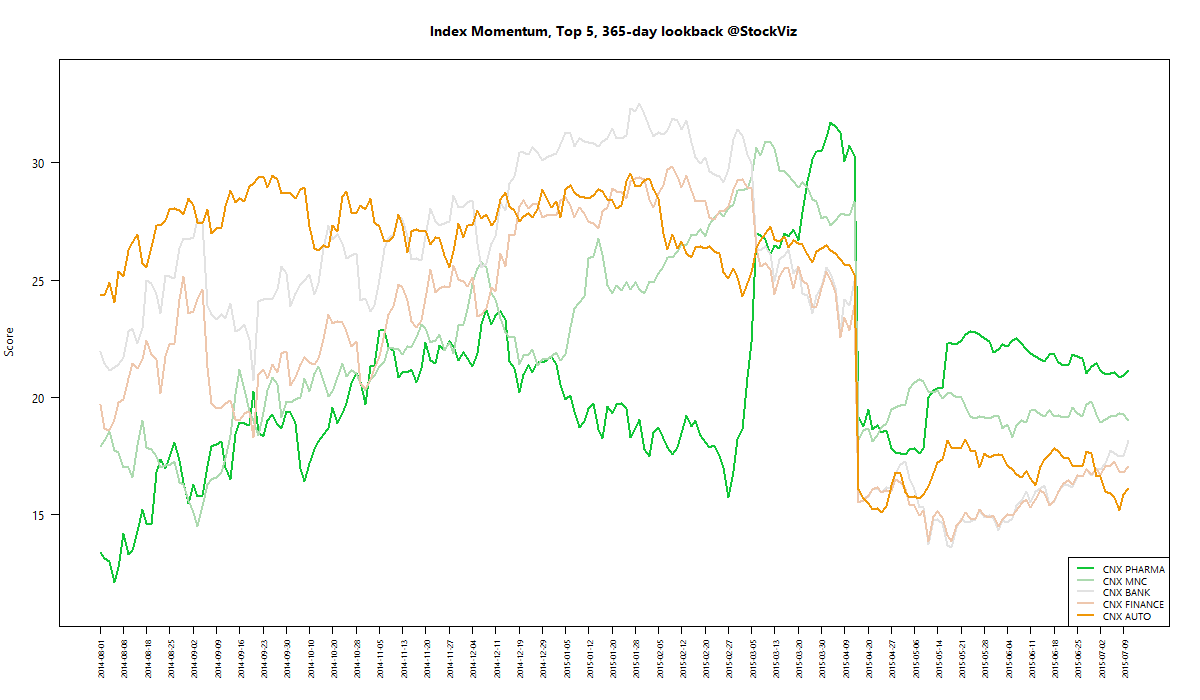
Category: Your Money

Index Update 11.07.2015

MOMENTUM

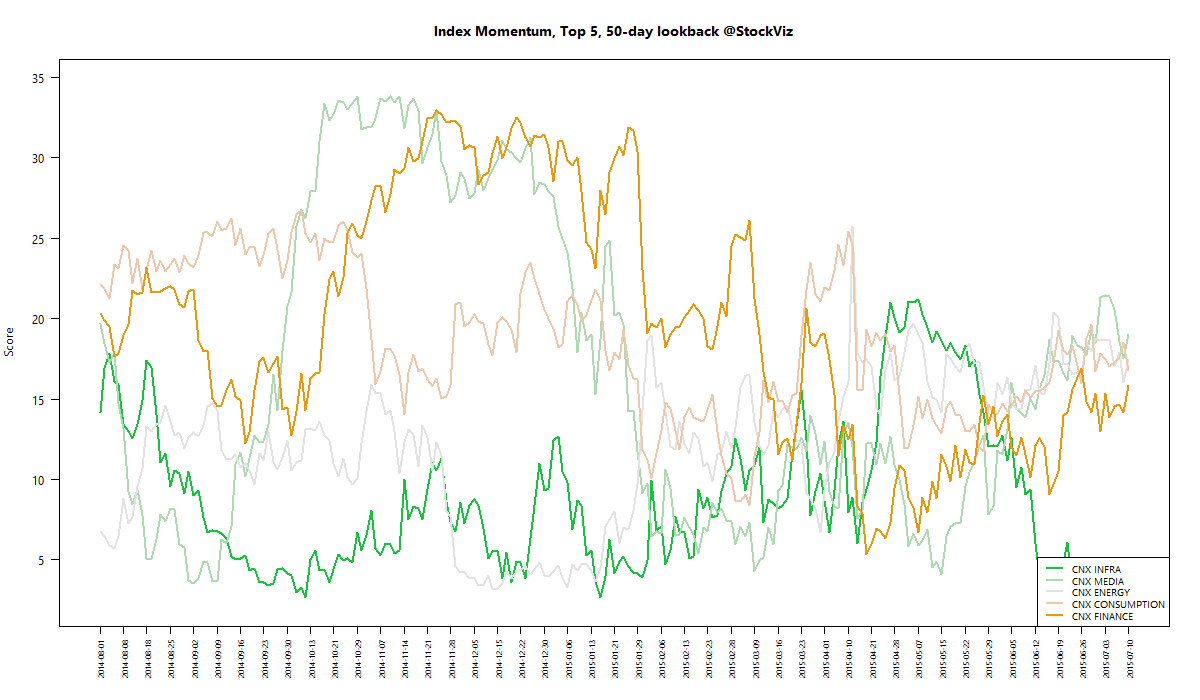
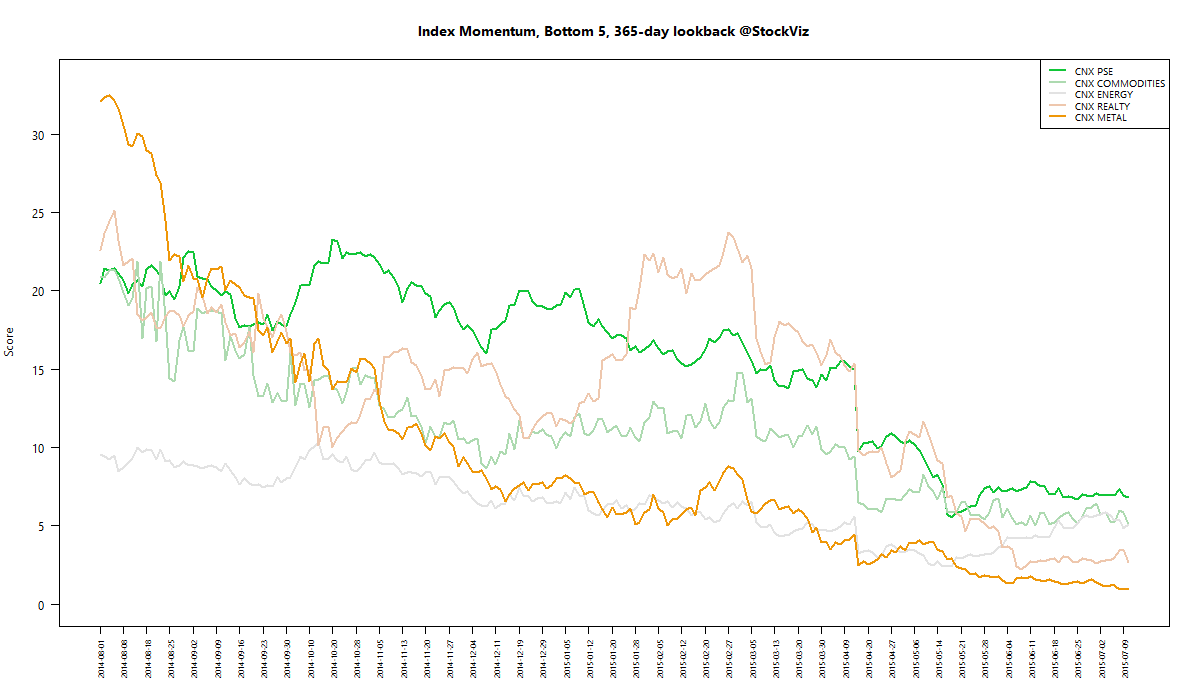
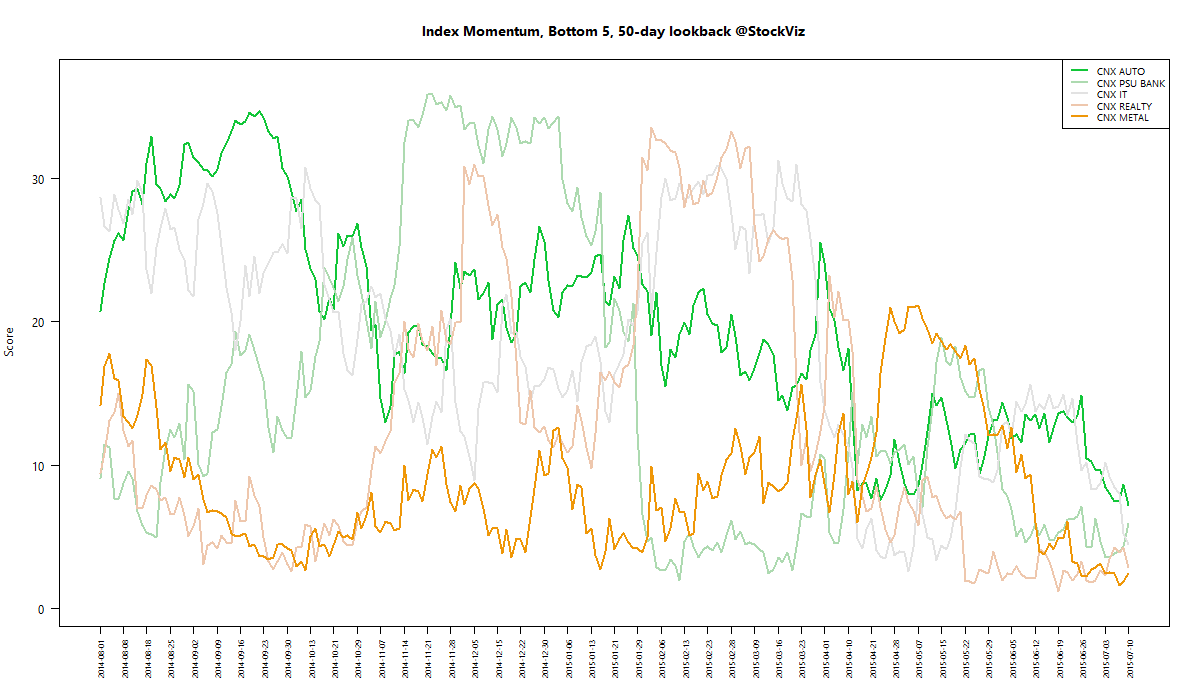
We run our proprietary momentum scoring algorithm on indices just like we do on stocks. You can use the momentum scores of sub-indices to get a sense for which sectors have the wind on their backs and those that are facing headwinds.

Traders can pick their longs in sectors with high short-term momentum and their shorts in sectors with low momentum. Investors can use the longer lookback scores to position themselves using our re-factored index Themes.

You can see how the momentum algorithm has performed on individual stocks here.

Here are the best and the worst sub-indices:

index momentum best 365 2015-07-10 png

index momentum best 50 2015-07-10 png

index momentum worst 365 2015-07-10 png

index momentum worst 50 2015-07-10 png

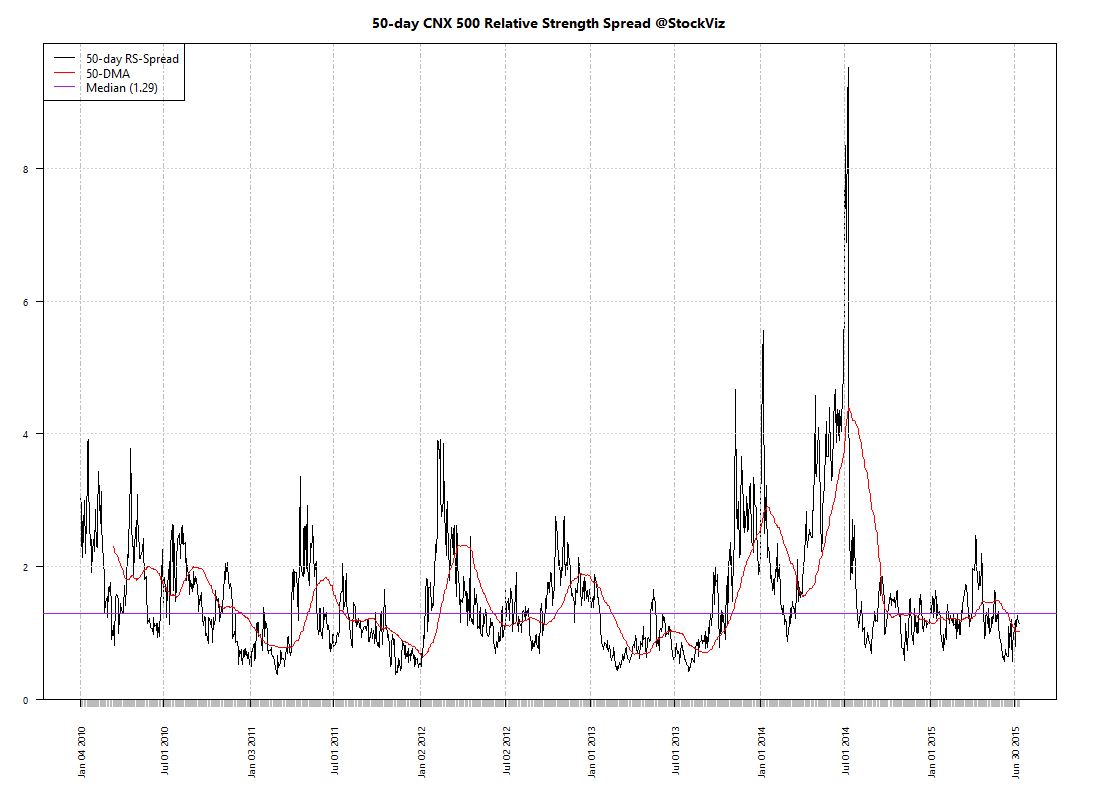
Relative Strength Spread

CNX_500 relative-spread-index 50 2015-07-10 png

Refactored Index Performance

50-day performance, from May 04, 2015 through July 10, 2015:

Trend Model Summary

Index Signal % From Peak Day of Peak
CNX AUTO SHORT
9.51
2015-Jan-27
CNX BANK LONG
8.93
2015-Jan-27
CNX COMMODITIES SHORT
28.96
2008-Jan-04
CNX CONSUMPTION LONG
2.44
2015-Apr-13
CNX ENERGY SHORT
27.21
2008-Jan-14
CNX FMCG SHORT
10.80
2015-Feb-25
CNX INFRA LONG
46.72
2008-Jan-09
CNX IT SHORT
88.69
2000-Feb-21
CNX MEDIA LONG
24.79
2008-Jan-04
CNX METAL LONG
60.32
2008-Jan-04
CNX MNC LONG
3.13
2015-Mar-12
CNX NIFTY LONG
7.07
2015-Mar-03
CNX PHARMA LONG
9.35
2015-Apr-08
CNX PSE LONG
25.36
2008-Jan-04
CNX PSU BANK LONG
37.25
2010-Nov-05
CNX REALTY SHORT
90.44
2008-Jan-14
CNX SERVICE LONG
8.97
2015-Mar-03
Finance and FMCG showed an uptick in momentum. However, the word of the week is “listless.” Expect most trend followers to lose discipline right about now…

Correlation Update 11.07.2015

Nifty one year daily return correlations

Nifty one year daily return correlations

Nifty one month daily return correlations

Nifty one month daily return correlations

Bank Nifty one year daily return correlations

Bank Nifty one year daily return correlations

Bank Nifty one month daily return correlations

Bank Nifty one month daily return correlations

Midcap one year daily return correlations

Midcap one year daily return correlations

Midcap one month daily return correlations

Midcap one month daily return correlations

A lot of thick blue squares mean that positive correlations are high. Red squares mean negative correlations are high. Whites are the doldrums.

Selling NIFTY Butterflies with Stop Loss

Stop loss

We saw earlier how infrequent but large losses in the short-call butterfly strategy can wipe out all the past profits earned. To figure out a stop-loss mechanism, we plotted individual expiry-to-expiry butterflies to find out how each one of them behaved. This data is available in the appendix below.

The stop-loss is set at 10 points (x lot-size) for the butterfly. But this kicks in only 10 days before the contracts expire (see how it gets “pulled” here.)

Returns comparison

Here’s the month-over-month returns of a mechanical short-call butterfly strategy with stop-loss:
butterfly.returns.SL.NIFTY

Here’s the month-over-month returns of a mechanical short-call butterfly strategy without stop-loss:
butterfly.returns.noSL.NIFTY

Because of the stop-loss, the frequency of losses increases but their magnitude decreases. However, stop-losses were hit about half the time.

With stop-loss:
butterfly returns with stop loss
Without stop-loss:
butterfly returns without stop loss

Summary

Applying a stop-loss to a mechanical expiry-to-expiry short call butterfly strategy on the NIFTY seems to enhance returns by cutting out infrequent but large losses. However, the frequency of wins seems low given that only two out of 5 years resulted in net profit. If you did not use a stop-loss, you would have larger gains and would have had more positive years. However, losses in 2010 and 2012 were enough to wipe out all profits and more.

Appendix

https://www.scribd.com/doc/271141815/Nifty-Butterfly

BANKNIFTY Butterflies

Introduction

So far, we have focused on the NIFTY for selling butterflies (Part I, II, III.) How would this look on the BANKNIFTY?

CNX BANK Index Returns

First, let’s have a look at the 30-day rolling returns of the CNX BANK Index, from 2010 to the present, the whole population:

day-30-rolling.BANKNIFTY.2010-2015
Median: 1.79%

2014-present:
day-30-rolling.BANKNIFTY.2014-2015
Median: 2.21%

Beginning of 2015-present:
day-30-rolling.BANKNIFTY.2015-2015
Median: flat

Currently, the index is around 18700. That means a 100-point move translates to 100/18700 ~0.5%

Expiry-to-Expiry Back-test

If we do the same back-test we did to the NIFTY, this is what we find:

butterfly.returns.BANKNIFTY

Conclusion

As with the NIFTY, the trade makes money if you know how to cut your losses. However, when the trade is live, how do we know what the future volatility of the underlying is going to look like? Without risk-management, a short-call butterfly strategy will encounter out-sized losses that wipe out all prior incremental gains.

A Simple NIFTY Short Call Butterfly Back-Test

Monthly moves

We saw that the NIFTY’s median move over a 30-day period is over 1% and that is all that is required to make a short-call butterfly strategy profitable. Let us now do a quick back-test to check if it is indeed the case.

Back-test

Here is the short-call butterfly back-test from 2010 through now. You basically sell the closest expiry butterfly at each expiry (click to embiggen):

butterfly.returns.NIFTY

Summary

While it is true that a 1% move in the NIFTY results in a profitable trade, there are instances where the NIFTY doesn’t move +/-1%. When the NIFTY ends flat, you end up losing all your prior profits. Understanding what drives NIFTY to move is key to managing your risk while running this strategy.