Category: Your Money

Mutual Fund Top 10 Lists

Top 10 funds over the years

Based on our RS-Spead metric, we ranked mutual funds based on their relative outperformance vs. CNX 500 over a one year period. See if you can find a pattern here.

*We have stared the fund that made it to the top-10 list the previous year.

Thoughts

There is no unqualified “best” fund out there. Among the top 5 fund houses (HDFC, ICICI Pru, Birla Sun Life, Reliance and UTI,) all funds within a class (large-cap, mid-cap, Top-100, etc…) will eventually put in roughly the same performance numbers. They will all revert to mean. Investors are probably better served with a negative list of funds and fund houses to avoid than a list of the “best” funds.

Weekly Recap: When Evidence Fails

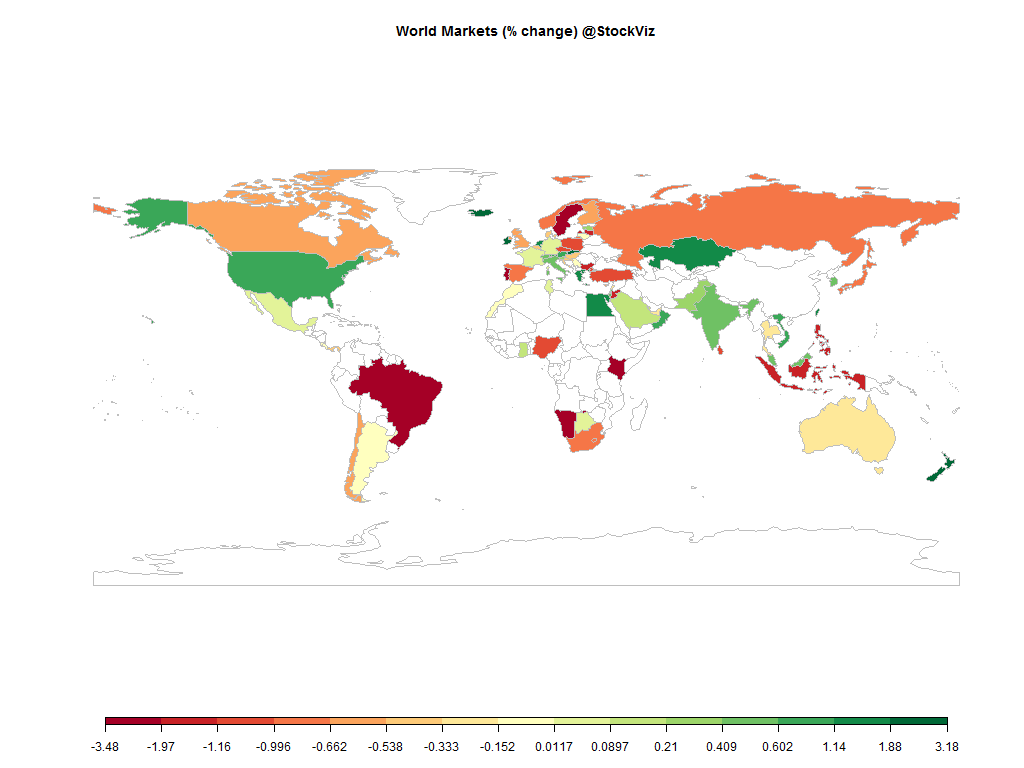
world.2015-10-09.2015-10-16

Equities

Major
DAX(DEU) +0.08%
CAC(FRA) +0.03%
UKX(GBR) -0.59%
NKY(JPN) -0.80%
SPX(USA) +1.14%
MINTs
JCI(IDN) -1.47%
INMEX(MEX) +0.07%
NGSEINDX(NGA) -1.10%
XU030(TUR) -1.05%
BRICS
IBOV(BRA) -3.27%
SHCOMP(CHN) +6.54%
NIFTY(IND) +0.59%
INDEXCF(RUS) -0.66%
TOP40(ZAF) -0.73%

Commodities

Energy
Brent Crude Oil -4.00%
Ethanol -0.20%
Natural Gas -3.08%
RBOB Gasoline -6.00%
WTI Crude Oil -4.35%
Heating Oil -5.54%
Metals
Copper -0.41%
Palladium -1.68%
Gold 100oz +1.96%
Platinum +3.61%
Silver 5000oz +2.53%

Currencies

USDEUR:+0.18% USDJPY:-0.69%

MINTs
USDIDR(IDN) +0.95%
USDMXN(MEX) -0.17%
USDNGN(NGA) -0.05%
USDTRY(TUR) -0.71%
BRICS
USDBRL(BRA) +5.00%
USDCNY(CHN) +0.14%
USDINR(IND) +0.12%
USDRUB(RUS) -0.53%
USDZAR(ZAF) -1.93%
Agricultural
Cotton +3.23%
Feeder Cattle +2.54%
Lean Hogs -11.45%
Wheat -2.75%
Orange Juice +18.33%
Soybeans +1.64%
Cocoa +1.34%
Coffee (Arabica) -4.16%
Coffee (Robusta) -0.49%
Corn -1.24%
Soybean Meal +1.76%
Sugar #11 +0.70%
Cattle +4.10%
Lumber +5.94%
White Sugar +0.05%

Credit Indices

Index Change
Markit CDX NA HY -0.72%
Markit CDX NA IG +3.83%
Markit iTraxx Asia ex-Japan IG -4.14%
Markit iTraxx Australia -2.90%
Markit iTraxx Europe -1.84%
Markit iTraxx Europe Crossover +4.46%
Markit iTraxx Japan -0.38%
Markit iTraxx SovX Western Europe +0.27%
Markit LCDX (Loan CDS) +0.00%
Markit MCDX (Municipal CDS) +0.56%
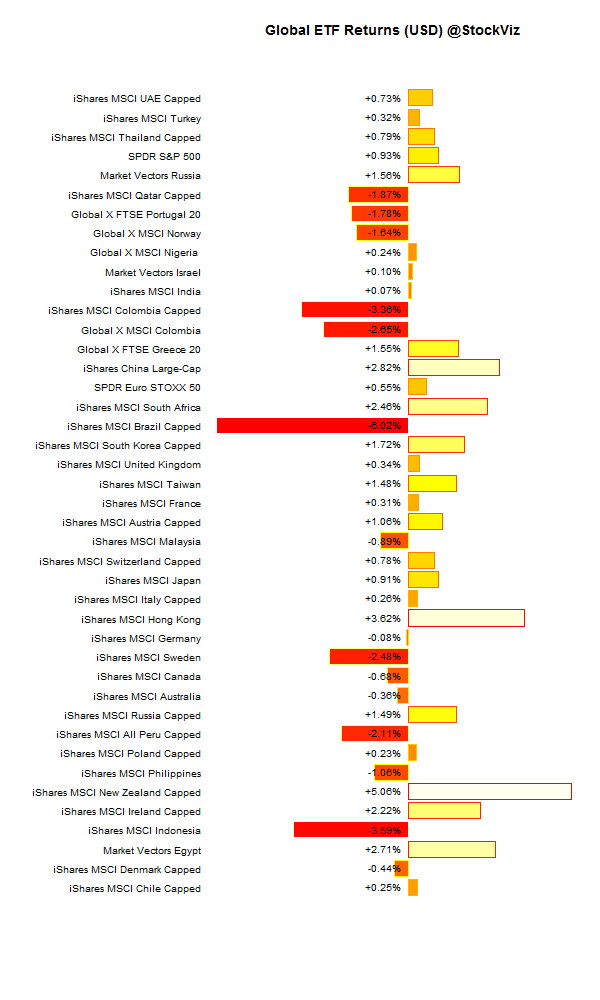
Risk ON like Donkey Kong this week. All that money that fled EMs fearing a Fed rate hike is finding its way back…

Global ETFs (USD)

global.etf.performance.2015-10-09.2015-10-16

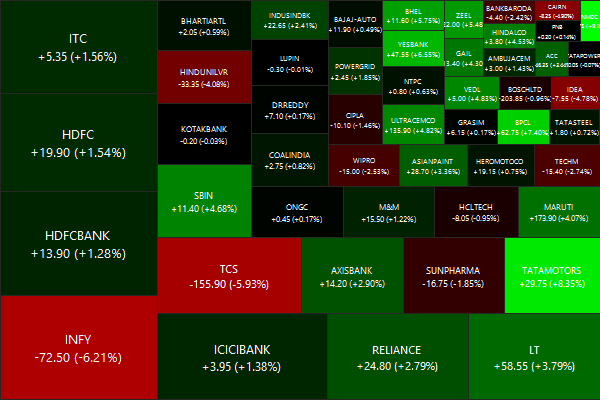
Nifty Heatmap

CNX NIFTY.2015-10-09.2015-10-16

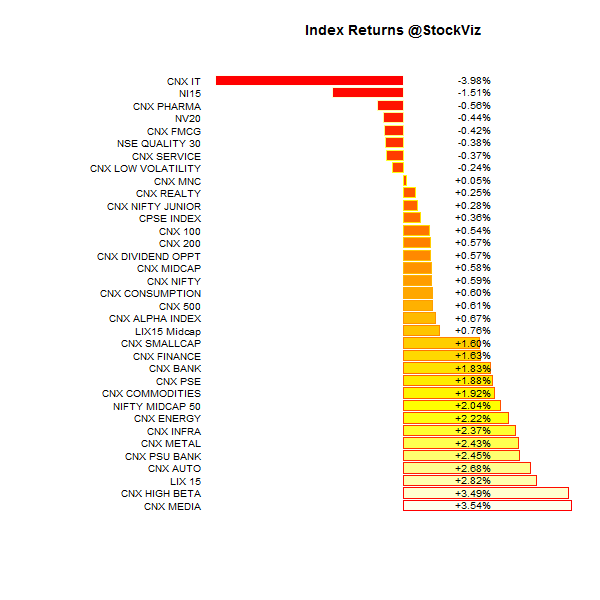
Index Returns

For a deeper dive into indices, check out our weekly Index Update.
index.performance.2015-10-09.2015-10-16

Market Cap Decile Performance

Decile Mkt. Cap. Adv/Decl
1 (micro) +1.34% 76/59
2 +3.26% 81/53
3 +3.42% 72/62
4 +3.84% 73/62
5 +2.85% 75/59
6 +2.42% 76/58
7 +2.29% 72/63
8 +2.89% 73/61
9 +0.95% 73/61
10 (mega) +0.47% 75/60
Midcaps outperformed large caps…

Top Winners and Losers

RCOM +8.23%
TATAMOTORS +8.35%
NMDC +9.10%
INFY -6.21%
TCS -5.93%
CONCOR -5.79%
IT guys got hit buy a bus…

ETF Performance

INFRABEES +3.03%
BANKBEES +1.98%
PSUBNKBEES +1.66%
GOLDBEES +1.50%
NIFTYBEES +0.67%
JUNIORBEES +0.55%
CPSEETF +0.32%
Green zoned…

Yield Curve

yieldCurve.2015-10-09.2015-10-16

Bond Indices

Sub Index Change in YTM Total Return(%)
0 5 -0.01 +0.16%
5 10 +0.02 +0.05%
10 15 +0.03 -0.04%
15 20 +0.00 +0.13%
20 30 -0.03 +0.41%
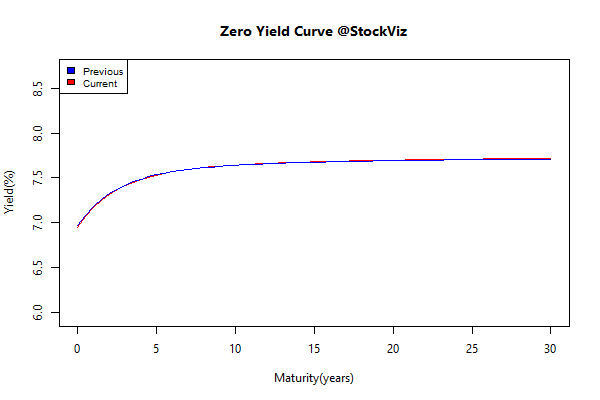
The curve remained unchanged…

Investment Theme Performance

High beta took off like a rocket…

Equity Mutual Funds

Bond Mutual Funds

Thought for the weekend

The investing cycle of good ideas goes something like this:

Early adopters find an anomaly and exploit it for huge gains. More and more smart money begins to figure out this apparent loophole and competition means lower profits to go around. Next come the academics with their research papers that get published in the trade journals and such. Finally, Wall Street picks up on the trend and does their part to create more products than are needed to help everyone else finally jump in on the fad, usually just as the cycle is about to turn.

Source: When Evidence Fails

Mutual Fund Alpha Charts

Charting Alpha

Most mutual fund investors chase recent performance. However, experience shows that alpha, or out-performance, is rarely sustained in the fund universe. To visualize how alpha fluctuates across different time-periods, we extended the relative strength spread notion of stocks to mutual funds. By normalizing performance across multiple funds vs. a single benchmark, the CNX 500 index, we can get a sense for how stable the alpha is.

Exhibits

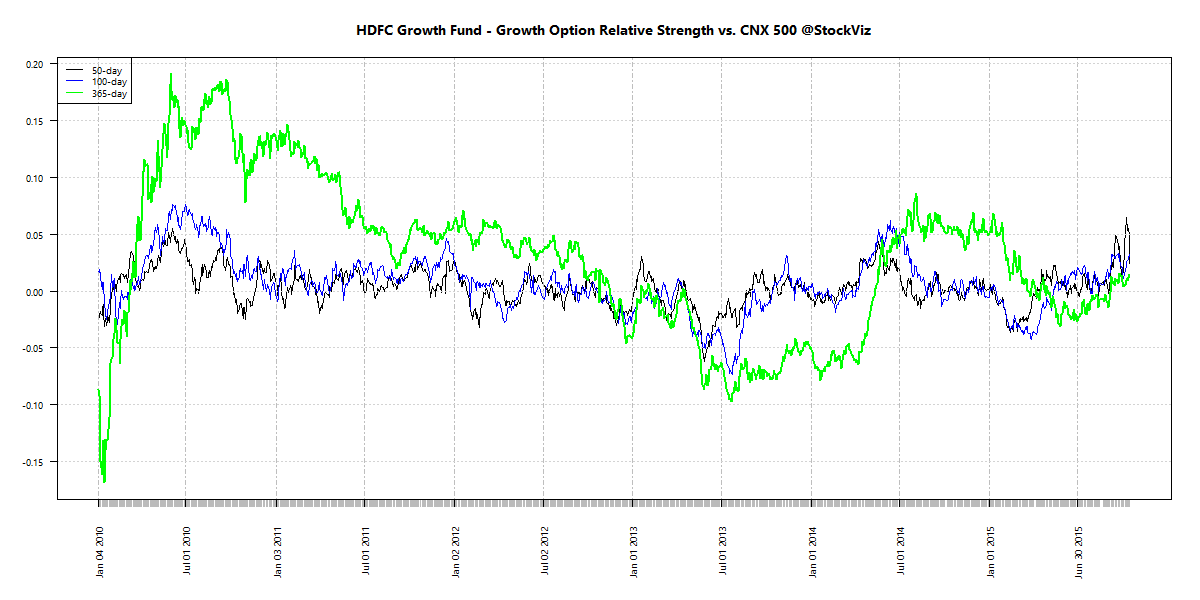
Have a look at the RS-Spread chart of the HDFC Growth Fund:
hdfc.growth.mf.relstrength

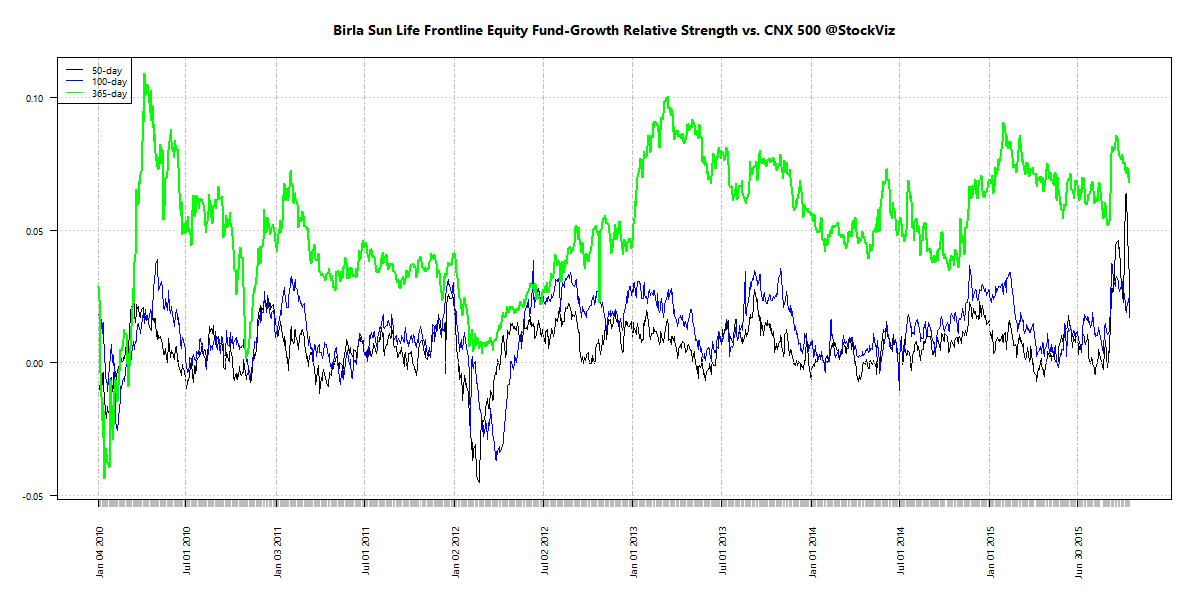
Notice how 1-year alpha was below zero between Oct’2012 and May’2014 and is now back below zero again. This should indicate that whatever strategy the fund is employing is not that great in generating sustainable alpha. Now compare that to the Birla Sun Life Frontline Equity Fund:
birla.frontline.mf.relstrength

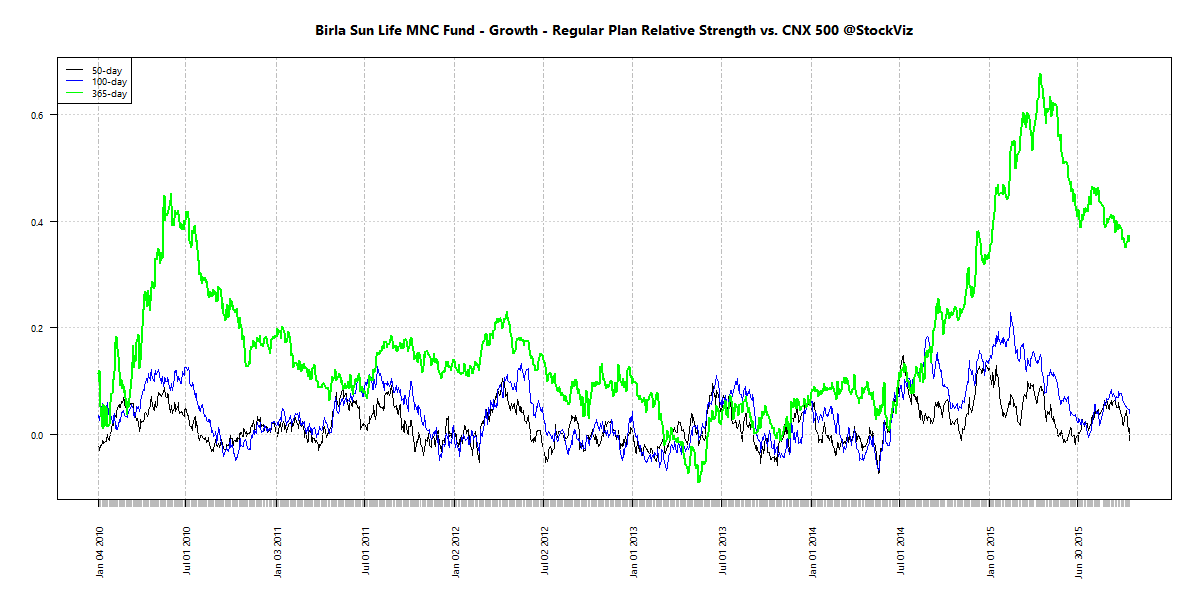
Notice how the fund has managed to outperform over the last 5-years. Here’s the MNC fund’s RS-Spread chart:

Birla.MNC.mf.relstrength

The FundCompare Tool

We update these charts daily for more than 100 funds. You can access them through our FundCompare tool. If you have any questions, give us a call or Whatsapp us!

Index Update 17.10.2015

MOMENTUM

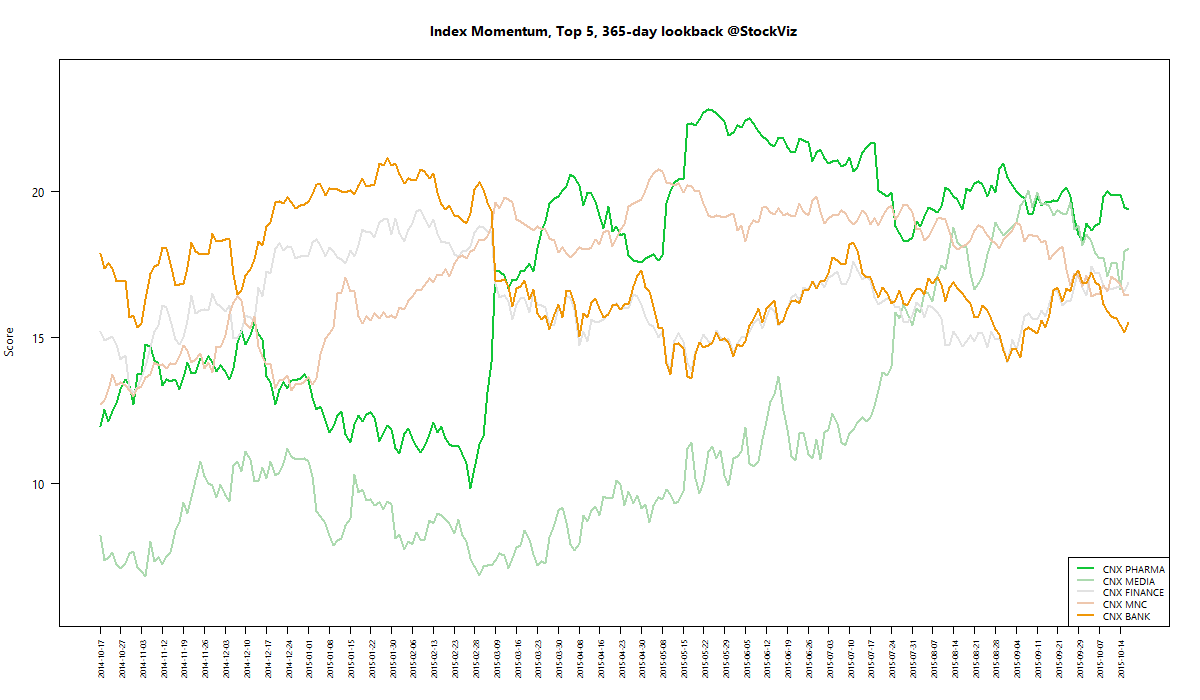
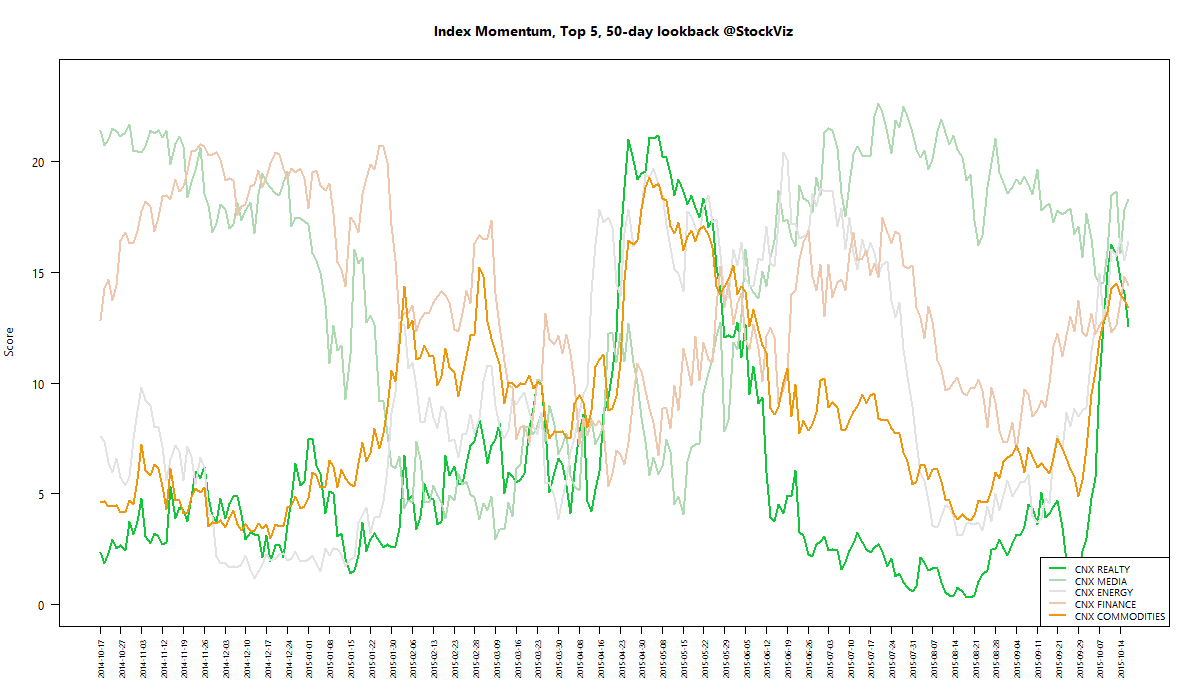
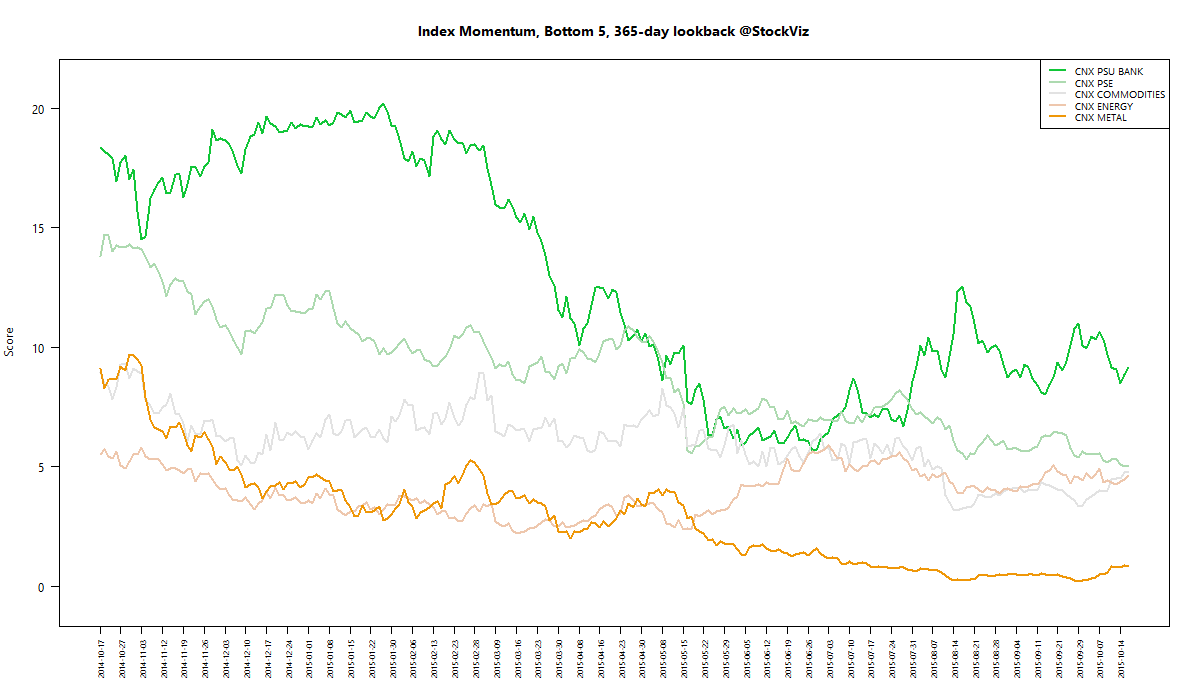
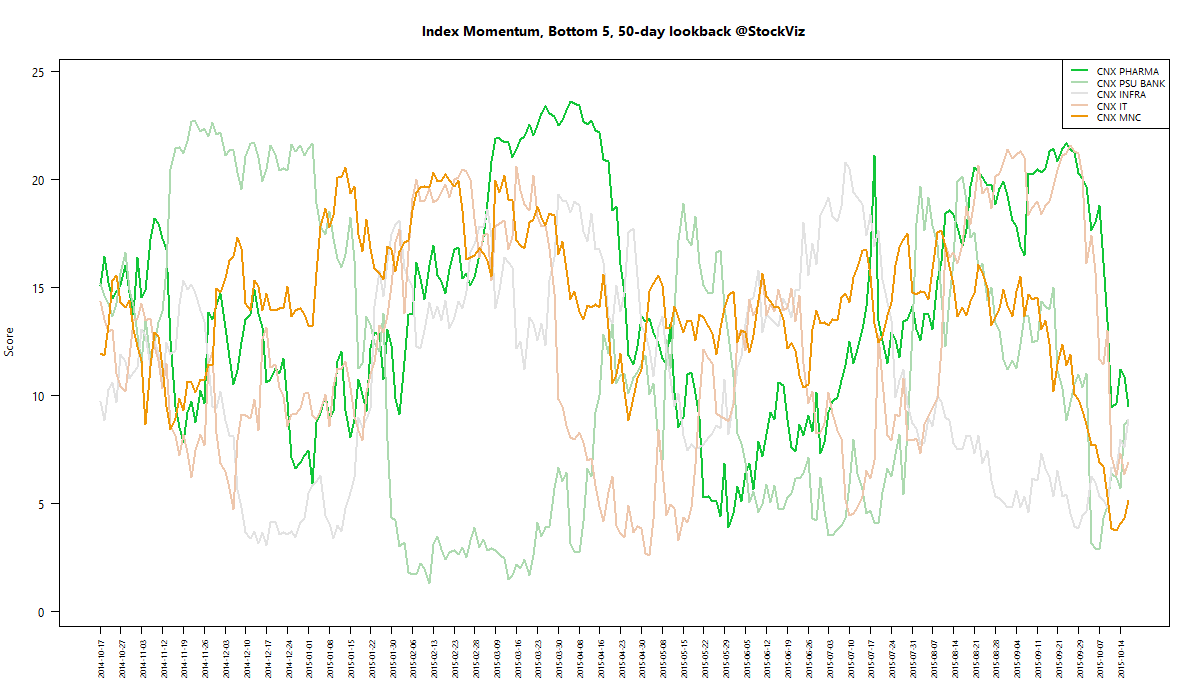
We run our proprietary momentum scoring algorithm on indices just like we do on stocks. You can use the momentum scores of sub-indices to get a sense for which sectors have the wind on their backs and those that are facing headwinds.

Traders can pick their longs in sectors with high short-term momentum and their shorts in sectors with low momentum. Investors can use the longer lookback scores to position themselves using our re-factored index Themes.

You can see how the momentum algorithm has performed on individual stocks here.

Here are the best and the worst sub-indices:

index momentum best 365 2015-10-16 png

index momentum best 50 2015-10-16 png

index momentum worst 365 2015-10-16 png

index momentum worst 50 2015-10-16 png

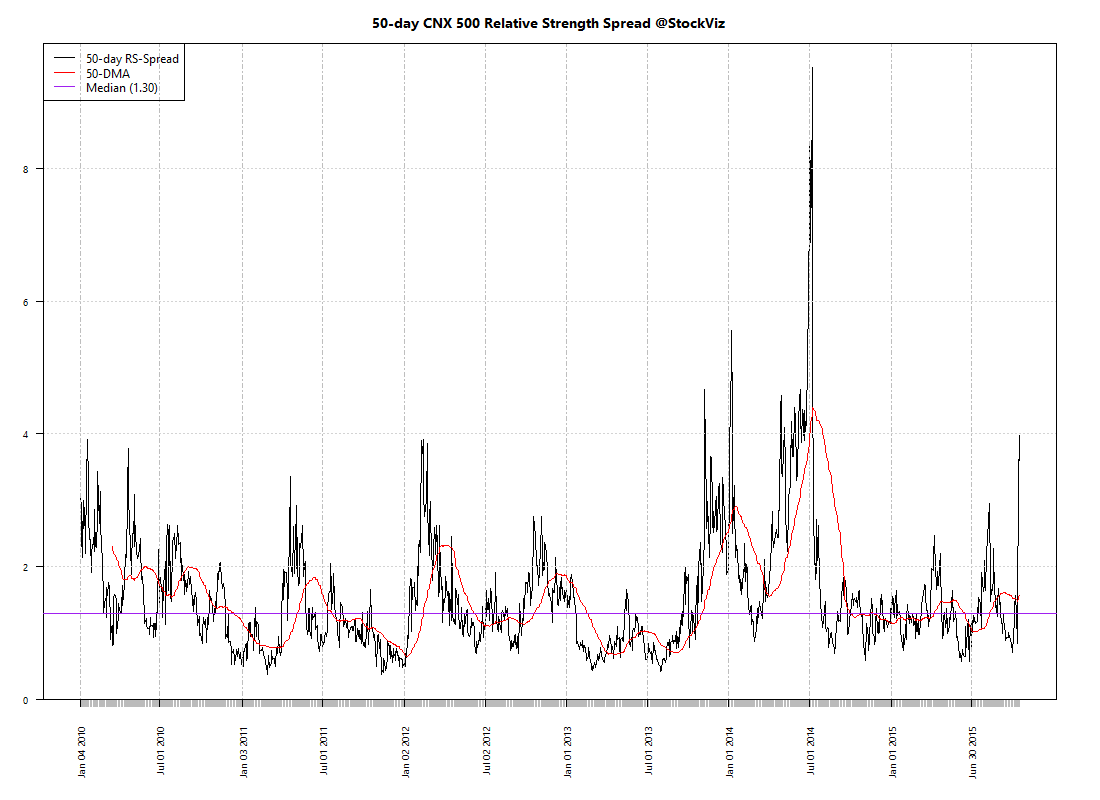
Relative Strength Spread

CNX_500 relative-spread-index 50 2015-10-16 png

Refactored Index Performance

50-day performance, from August 05, 2015 through October 16, 2015:

Trend Model Summary

Index Signal % From Peak Day of Peak
CNX AUTO LONG
9.15
2015-Jan-27
CNX BANK SHORT
12.86
2015-Jan-27
CNX COMMODITIES LONG
34.08
2008-Jan-04
CNX CONSUMPTION SHORT
5.14
2015-Aug-05
CNX ENERGY LONG
32.46
2008-Jan-14
CNX FMCG SHORT
8.34
2015-Feb-25
CNX INFRA LONG
51.93
2008-Jan-09
CNX IT LONG
88.13
2000-Feb-21
CNX MEDIA LONG
15.16
2008-Jan-04
CNX METAL LONG
65.79
2008-Jan-04
CNX MNC SHORT
9.23
2015-Aug-10
CNX NIFTY SHORT
8.43
2015-Mar-03
CNX PHARMA SHORT
4.54
2015-Apr-08
CNX PSE LONG
32.11
2008-Jan-04
CNX PSU BANK SHORT
39.36
2010-Nov-05
CNX REALTY SHORT
90.28
2008-Jan-14
CNX SERVICE SHORT
9.35
2015-Mar-03
A retracement is underway for most indices. CNX 100 broke about its 50-day SMA, activating the Tactical CNX 100 Theme. With most companies yet to announce their results, curb your enthusiasm.

Correlation Update 17.10.2015

Nifty one year daily return correlations

Nifty one year daily return correlations

Nifty one month daily return correlations

Nifty one month daily return correlations

Bank Nifty one year daily return correlations

Bank Nifty one year daily return correlations

Bank Nifty one month daily return correlations

Bank Nifty one month daily return correlations

Midcap one year daily return correlations

Midcap one year daily return correlations

Midcap one month daily return correlations

Midcap one month daily return correlations

A lot of thick blue squares mean that positive correlations are high. Red squares mean negative correlations are high. Whites are the doldrums.