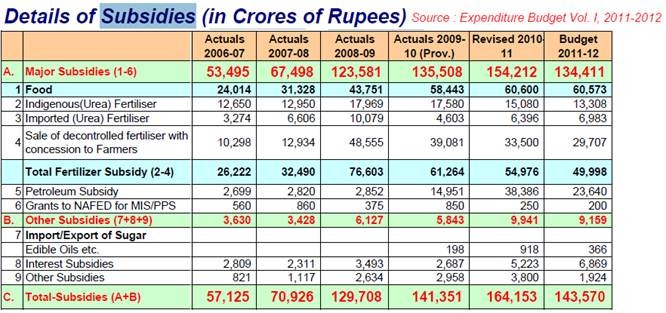
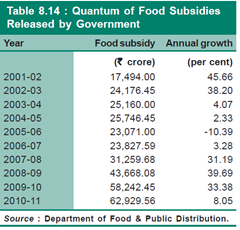
The subsidy hole that India has sunk itself deep into threatens to kill its famed growth story. The major subsidies in the system at present are on fuel, fertilizer and food that corner 95% of subsidy share.
Reducing subsidies is critical from the resource point of view, as, subsidies have been very high as a percentage of GDP. The subsidy bill in the current financial year is expected to rise to 2.4% of GDP from 1.9% estimated in the budget, Finance Minister P Chidambaram said last month.
The government’s major subsidy burden has ballooned over the years from Rs 67,498 crore in 2007-08 to Rs 208,503 crore in 2011-12.

According to the budget proposals, the government’s subsidy bill on food, petroleum and fertilizers is estimated at Rs 179,554 crore for 2012-13 fiscal, which is sure to be surpassed.
High crude oil prices, pending reforms in the fertilizer space and the proposed National Food Security Bill are further expected to swell subsidies.
In 2011-12, the revised estimates (RE) and budget estimates (BE) highlight the government’s failure to rein in subsidies. Petroleum subsidy rose from Rs 23,640 crore in BE to Rs 68,481 crore in RE. The RE for food and fertilizer stood at Rs 72,823 crore (against BE of Rs 60,573 crore) and Rs 67,199 crore (Rs 49,998 crore), respectively.
Apart from the size of such subsidies, other factors like strains on government finances, target group of such subsidies and their after effects on economic growth have dominated the discussion around subsidies.
 The food subsidy has swelled in recent years due to widening gap between the central price of wheat and rice and the economic cost of delivering these food grains. Huge stocks and the carrying costs associated with it have driven subsidies further.
The LPG subsidy is completely unfounded as bulk of it benefits people in the middle and upper income classes. Only about half the kerosene distributed through the PDS actually reaches the farmers or the poor and the massive under-pricing is only leading to large scale diversion for adulteration with diesel and petrol.
The cost of India’s agricultural input subsidies as a share of agriculture output almost doubled from 6.0 per cent in 2003-04 to 11.6 per cent in 2009-10, driven largely by subsidies to fertilizer and electricity.
![clip_image002[10]](http://stockviz.biz/wp-content/uploads/2012/10/clip_image00210_thumb1.jpg) In the process of subsidizing the so-called ‘poor farmer’, state electricity boards have run into massive losses and have recently landed a Rs 2 lakh crore bailout.
In the process of subsidizing the so-called ‘poor farmer’, state electricity boards have run into massive losses and have recently landed a Rs 2 lakh crore bailout.
Fertilizer subsidy as a ratio to the value of crop output, which hovered between 3 to 3.5 per cent during 2000–06, rose to 4.8 per cent in 2007–08, and to more than 10 per cent in 2008–09 due to a spike in the price of imported fertilizers.
Fertilizer subsidy should be on nutrient basis, and ideally given directly to farmers. The sector must be freed from price controls and fertilizer imports must be opened up for the private sector through low import duty. This will help in rationalizing and containing the subsidy bill.
The poor must be insulated from price hikes, which should be directly targeted, but energy prices cannot be delinked from global prices, especially at a time when dependence on imports is rising.
Direct subsidy to a target group of small and marginal farmers is ideal against the present system of uniform indirect subsidy, which tends to benefit the larger farmers more.
![clip_image001[5]](http://stockviz.biz/wp-content/uploads/2012/10/clip_image0015_thumb1.png)
Even as you and I continue to enjoy the current ad-hoc subsidy regime, the intended subsidies do not even reach the deserving segment. The subsidy dilemma has now started impacting the country’s growth in the form of persistent inflation, high fiscal deficit and high rural wages.
And since growth is a pre-requisite to eliminate poverty, as acknowledged by PM Manmohan Singh, the economy may dive into a downward spiral if the current regime of distorted subsidies is not uprooted.


![clip_image002[10]](http://stockviz.biz/wp-content/uploads/2012/10/clip_image00210_thumb1.jpg)
![clip_image001[5]](http://stockviz.biz/wp-content/uploads/2012/10/clip_image0015_thumb1.png)
