Introduction
Previously, we ran back-tests on long-only and long-short momentum algorithm over a couple of look-back periods. We found that (a) momentum with a one-year look-back period out-performed one with a 100-day look-back, and (b) a long-only portfolio significantly out-performed a long-short portfolio. We hypothesize that this is probably because the universe of stocks that we are forced to consider was heavily plucked. But what if we added a volatility metric into the mix to smooth out draw-downs?
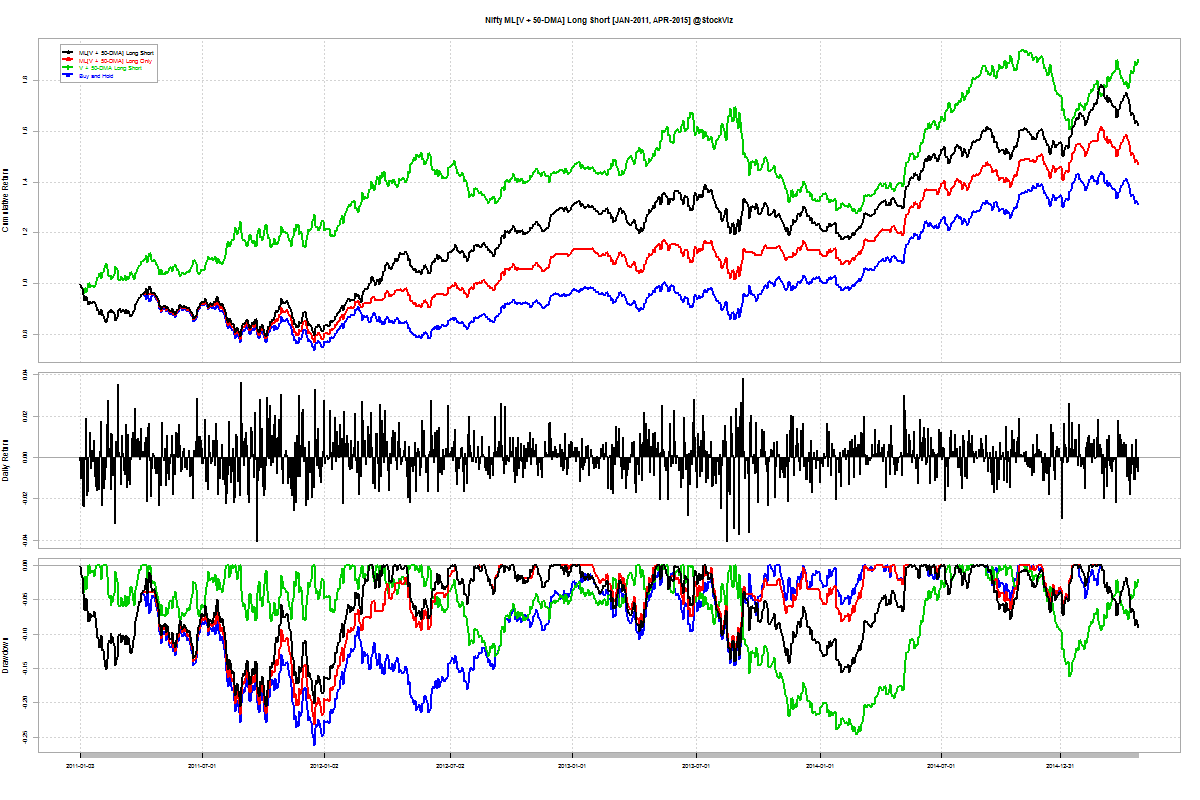
Long-only Momentum
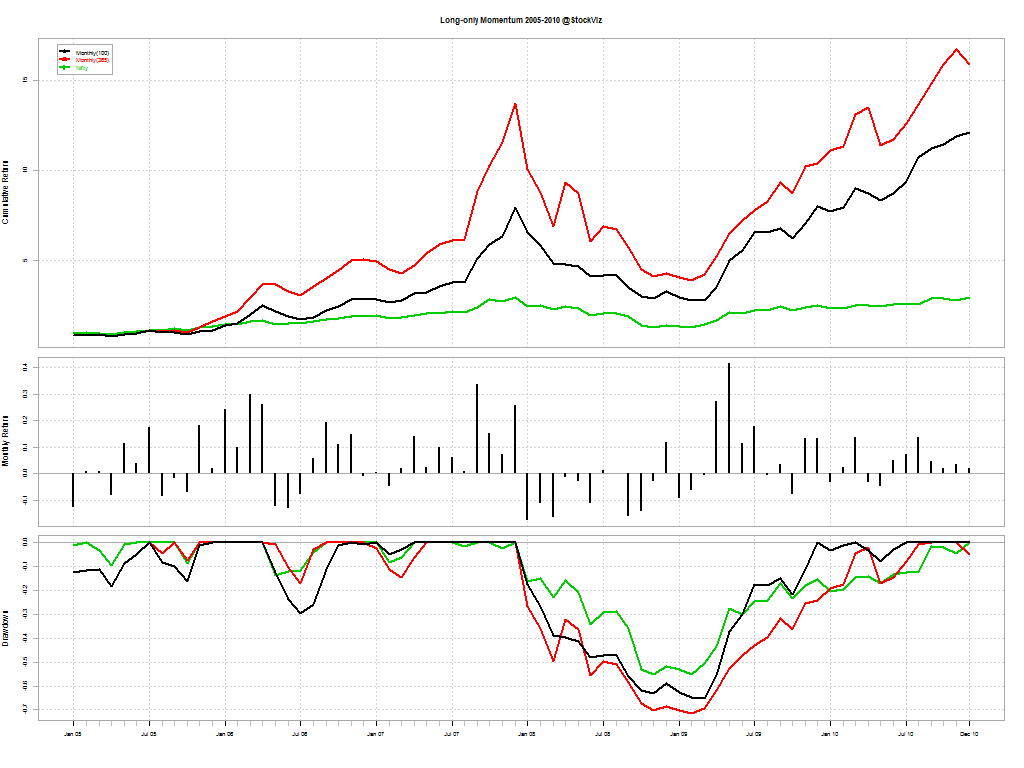
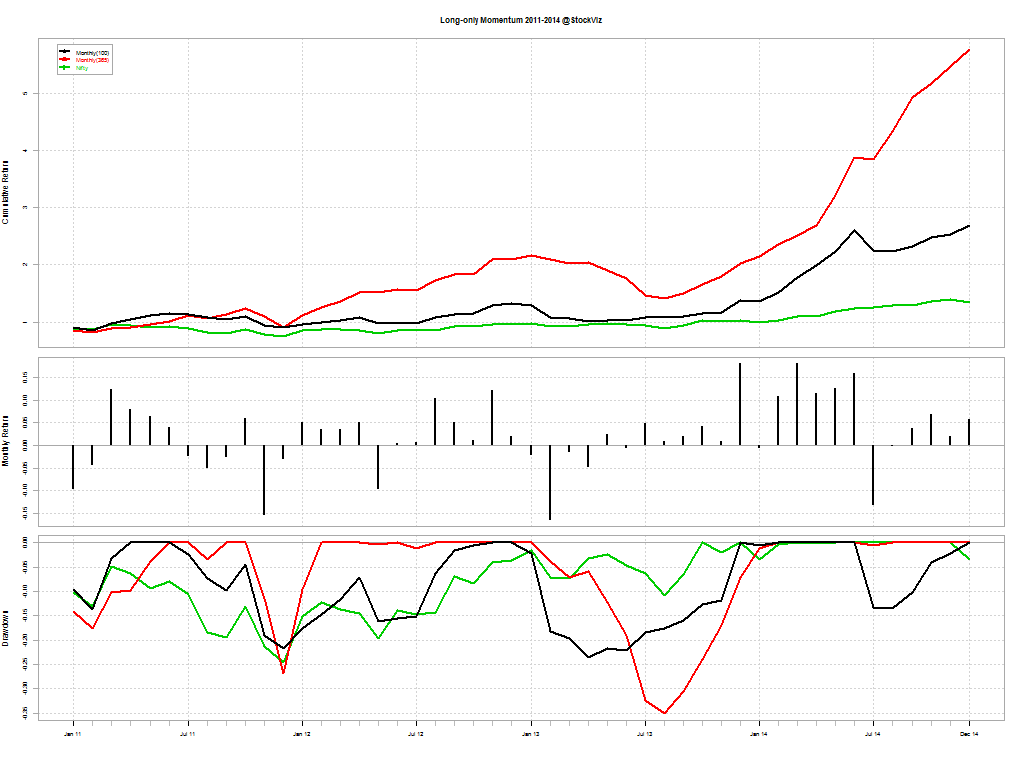
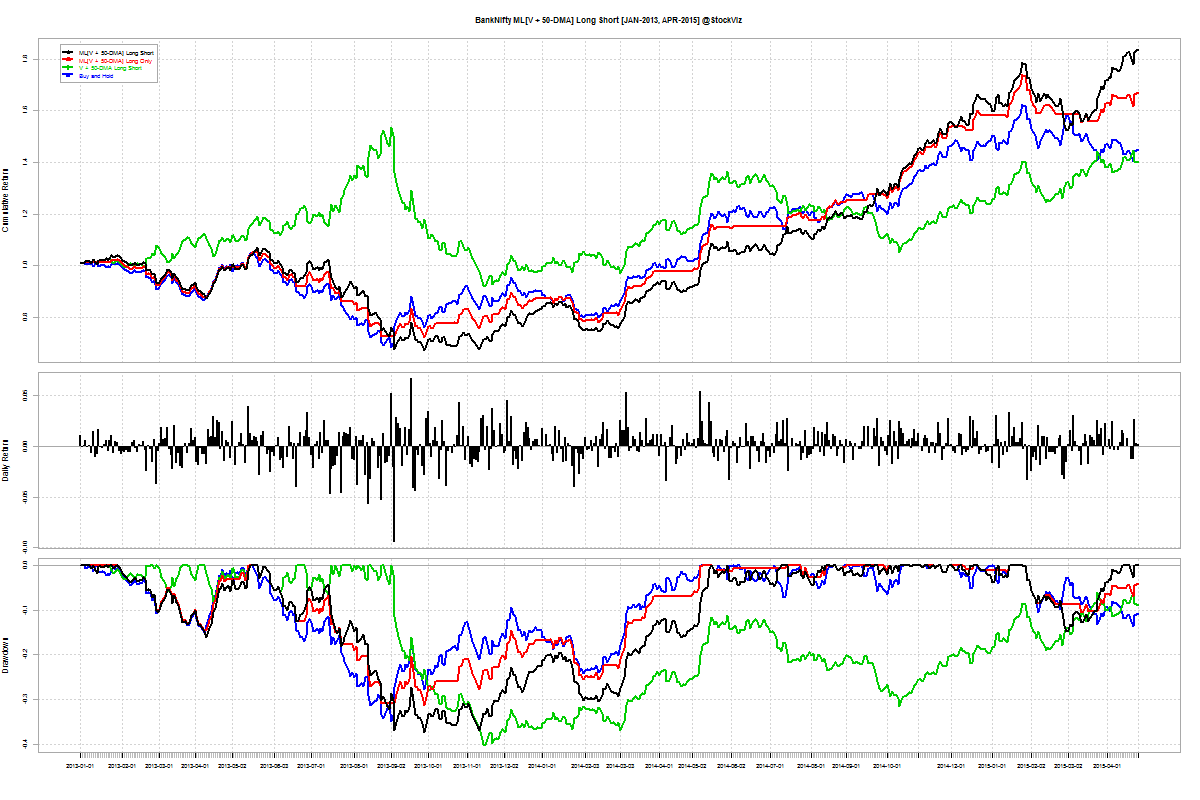
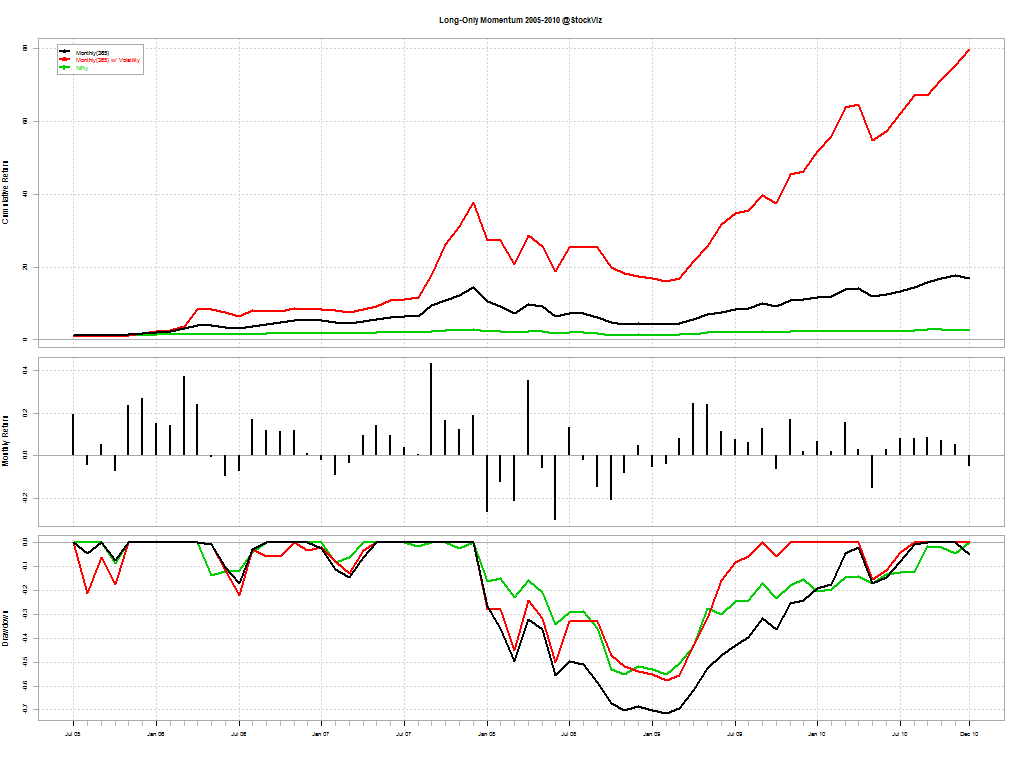
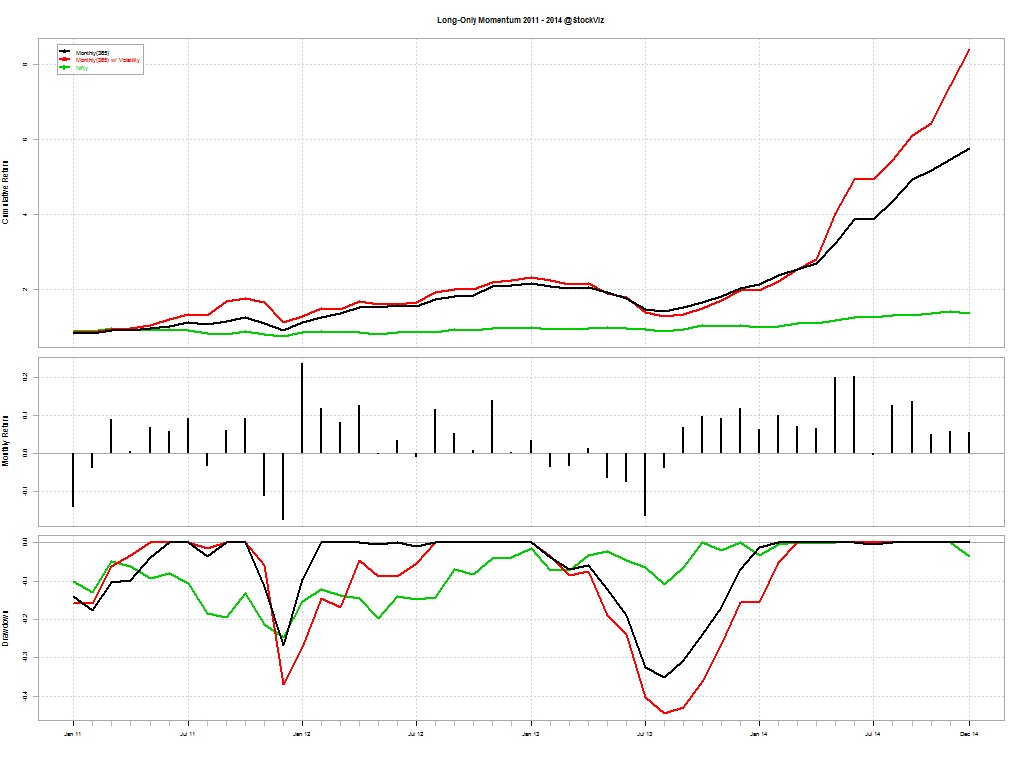
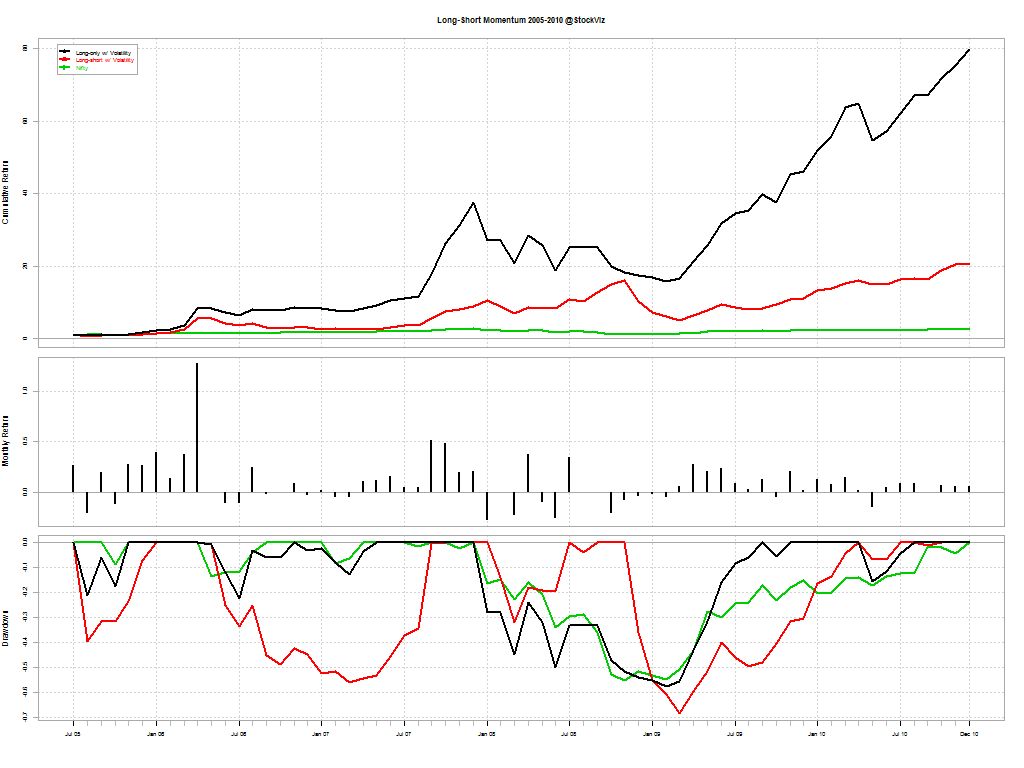
First, lets take a look at the long-only portfolio; both with a one-year look-back:
The red line is the volatility adjusted momentum; black is naive momentum; and green is buy & hold Nifty
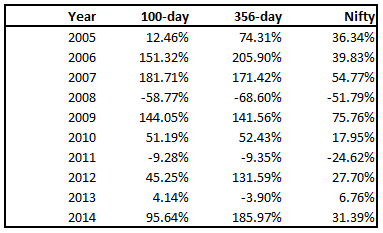
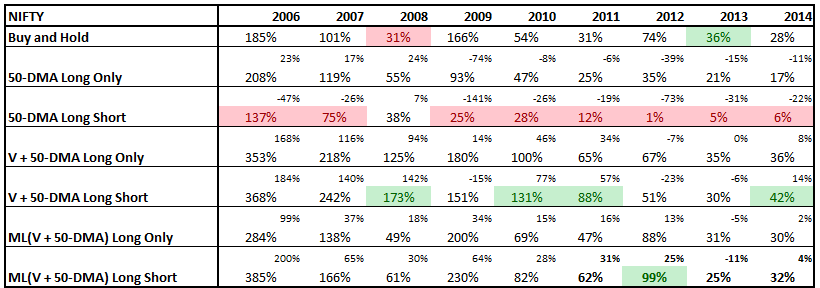
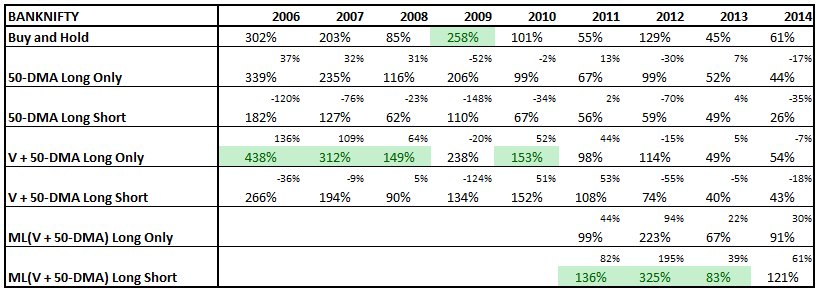
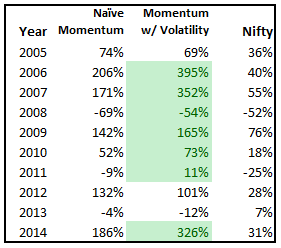
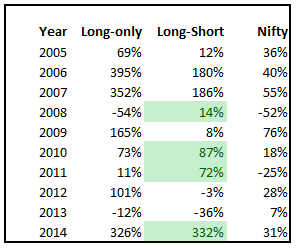
By year:
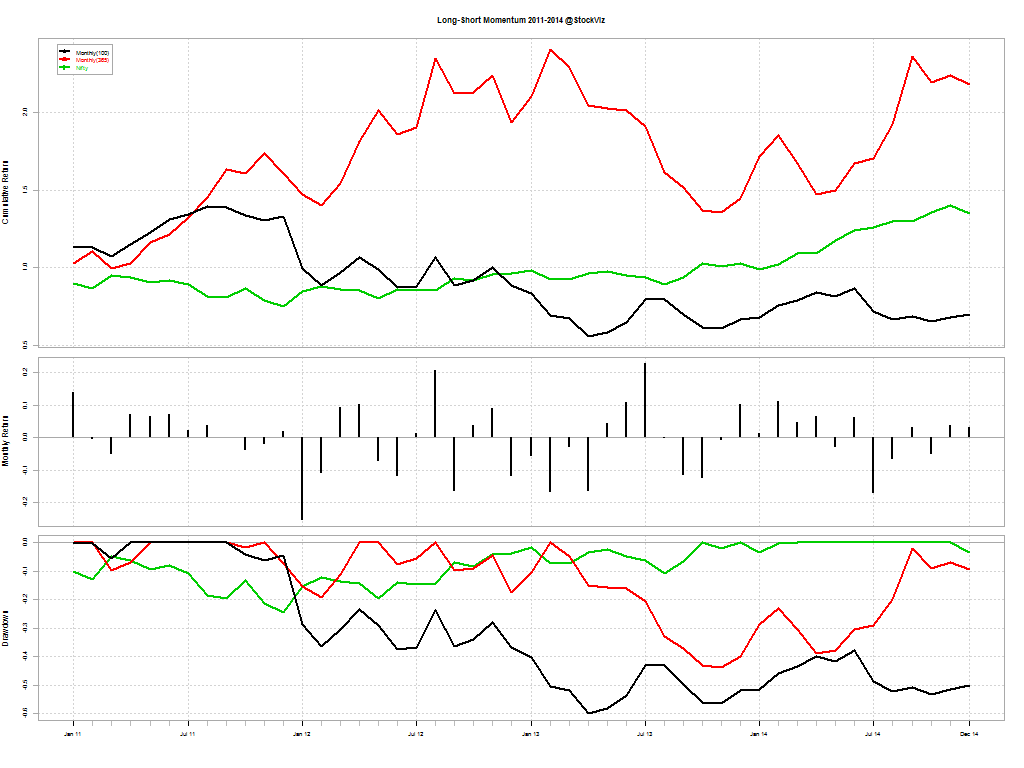
Long-short Momentum
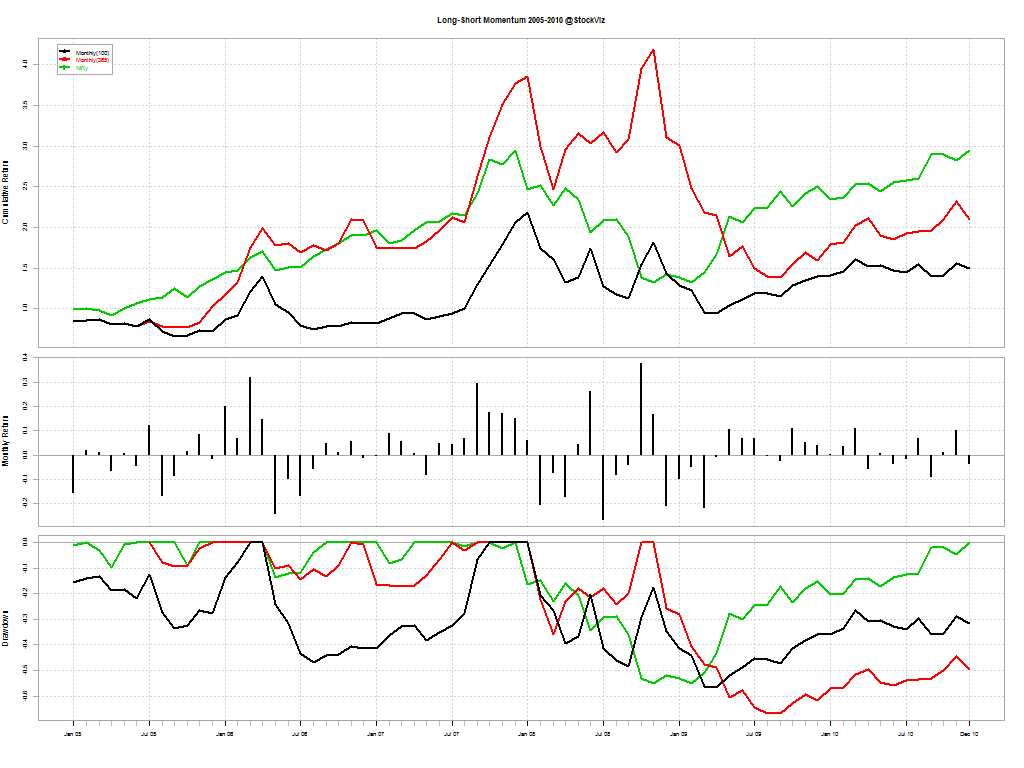
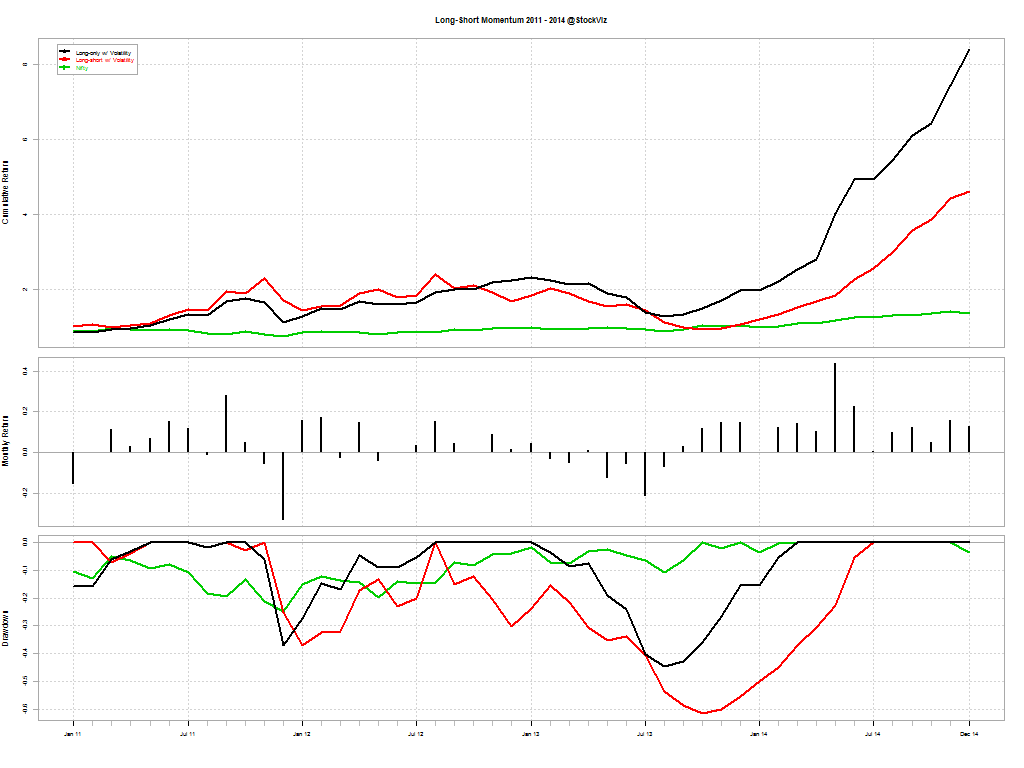
Long-short ended up under-performing long-only once again:
The red line is long-short momentum; black is long-only momentum; and green is buy & hold Nifty
By year:
Conclusion
Over the long run, long-only momentum with volatility adjustment outperformed the long-short version. However, while long-only tanked with the rest of the market in 2008, long-short was in the green. So if you are one of those guys who ask “how did this strategy perform in 2008?” Well, it performed pretty well. But would you have stuck by it when it got shellacked in 2013?
The problem with steep drawdowns is that it makes implementing the strategy with derivatives or leverage difficult. Margin calls might force you to abandon the strategy just before it turns. Next, we will explore a hedged long-only momentum strategy. Stay tuned!