Came across an interesting paper: Will My Risk Parity Strategy Outperform? Robert M. Anderson, Stephen W. Bianchi, CFA, and Lisa R. Goldberg. Even though they discuss risk parity, they make some pretty interesting points that relate to all investment strategies.
Today’s alpha is tomorrow’s beta
… the introduction of new securities can have an indirect effect; a strategy that was seemingly profitable in the past might have been less profitable if the new securities had been available and thus made the strategy accessible to a broader class of investors.
Before index ETFs, there was no cost-effective way of replicating an index. For example, NIFTYBEES was listed in 2002 and came with an expense ratio of 0.80% while retail brokerage charges were in the 0.5-1.0% range. Replicating the NIFTY index before NIFTYBEES came around was expensive. So any backtest before 2002 that that tries to argue the benefits of buying-and-holding an index ETF is likely bogus. Similarly, today’s active management strategies available to a select few hedge-fund investors are tomorrow’s “smart beta” ETFs that will be available to anybody with a demat account.
Leverage is an external source of risk
The notion that levering a low-risk portfolio might be worthwhile dates back to Black, Jensen, and Scholes (1972), who provided empirical evidence that the risk-adjusted returns of low-beta equities are higher than the CAPM would predict.
There are periods when banks pull their lines of credit based on macro factors that has nothing to do with your strategy. For example, during the 2008 financial crisis, your bank/broker would have pulled your credit lines forcing you to sell near the bottom and preventing you from buying the bounce. Any strategy that uses leverage – risk-parity, for example – should factor this risk.
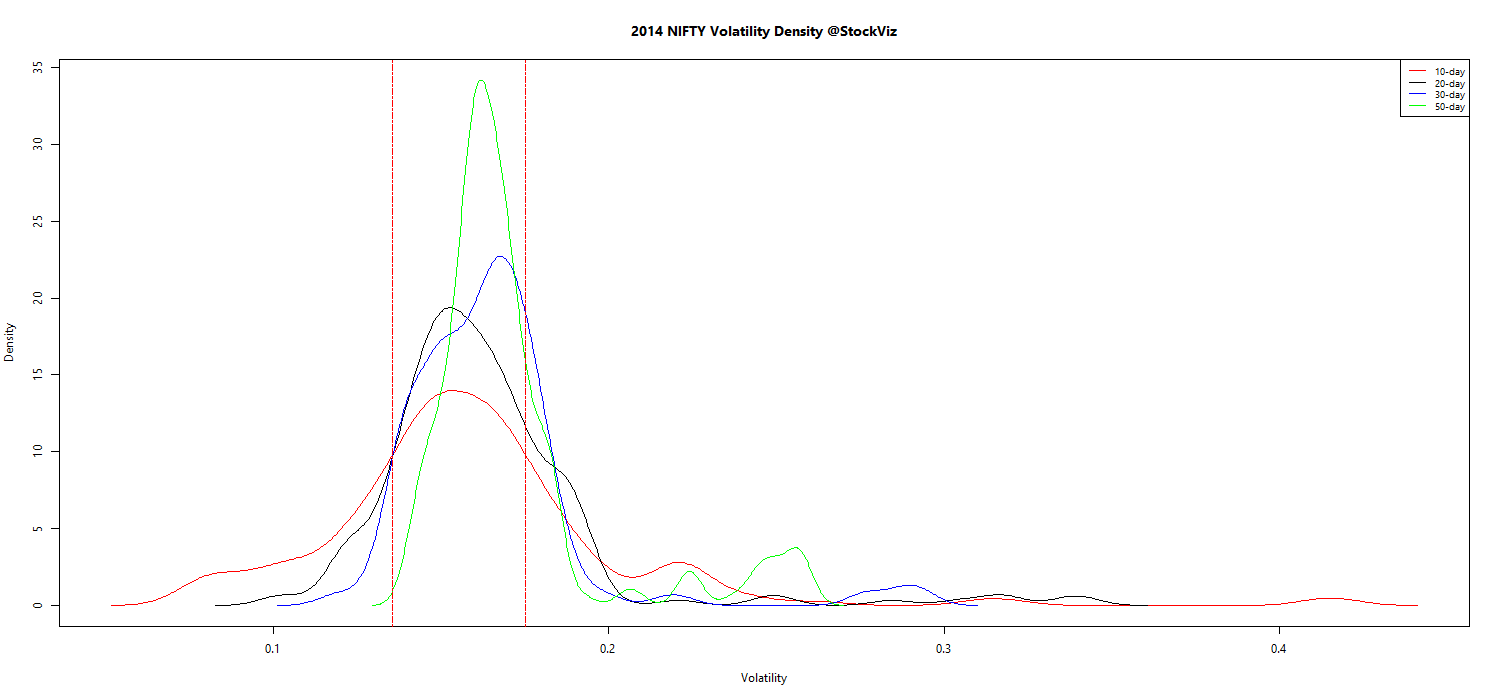
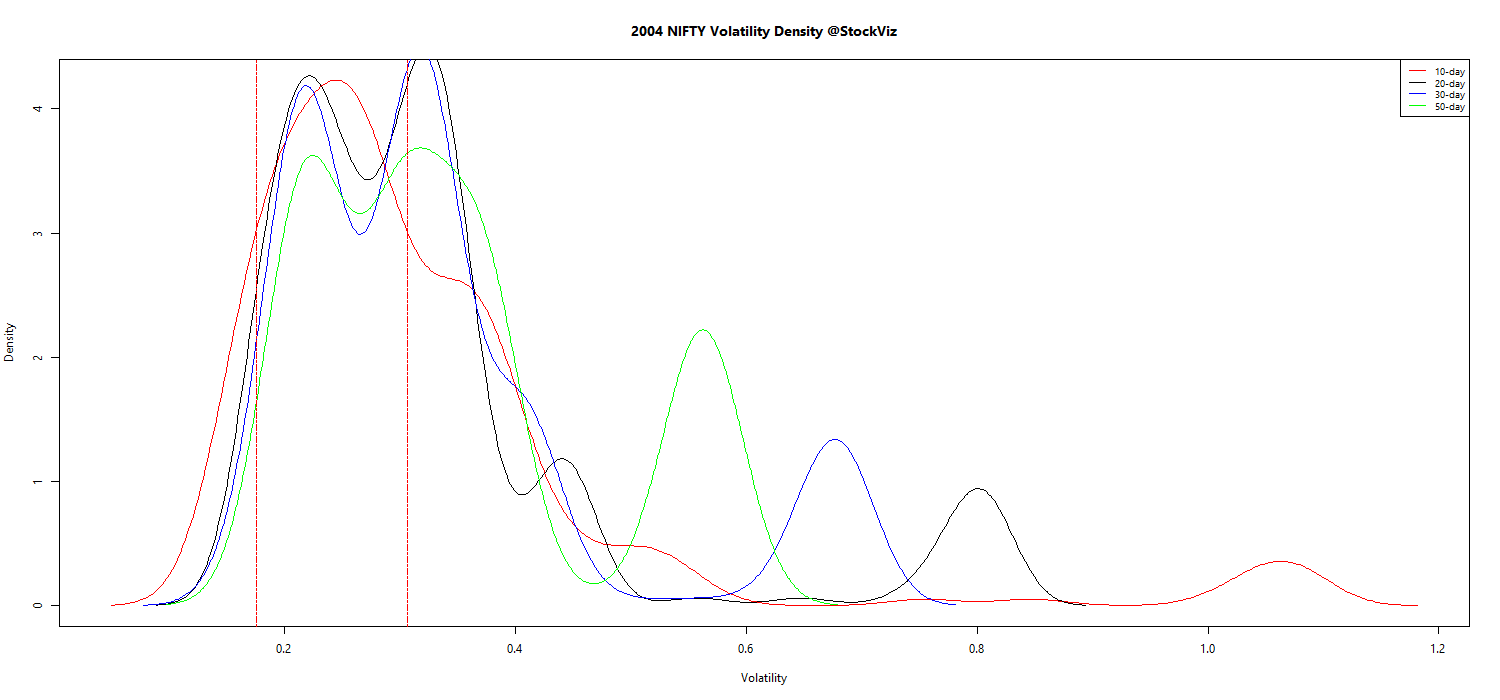
Performance depends materially on the backtesting period
Even if we were reasonably confident that one strategy achieved higher expected returns than another without incurring extra risk, it would be entirely possible for the weaker strategy to outperform over periods of several decades, certainly beyond the investment horizon of most individuals…
Besides, most strategies have a rebalancing frequency – once a month, once a year, and so on. The specific day you choose to rebalance can have a material impact on your strategy. For example, rebalancing during options expiry, corporate events, etc… can meaningfully skew your risk/returns.
Borrowing and trading costs can negate outperformance
Value-weighted strategies require rebalancing only in response to a limited set of events. The risk parity and 60/40 strategies require additional rebalancing in response to price changes and thus have higher turnover rates. Leverage exacerbates turnover.
There is huge execution risk involved in strategies that requires shorting of shares. Given the regulations surrounding SLBS – lending/borrowing allowed only on those securities that are listed in F&O and that too only in increments of lot-sizes – the friction involved in shorting stocks are prohibitive.
Execution drift
There is likely going to be a big difference between model execution prices and actual execution prices. For example, when we rebalance our Themes, we use the latest available price in our database. These prices themselves could be stale by over 10 minutes. These changes then have to percolate down to investors who execute them in the market. From start to finish, there could be a price gap of over 20 minutes – a significant source of drift between the ideal P&L and actual P&L.
Conclusion
Investors should have a deployment checklist for their strategies that addresses the issues raised above. What we have found is that most strategies that look good on a simple backtest don’t look that great when costs, variable periods, drift and half-lives are factored in.