MOMENTUM
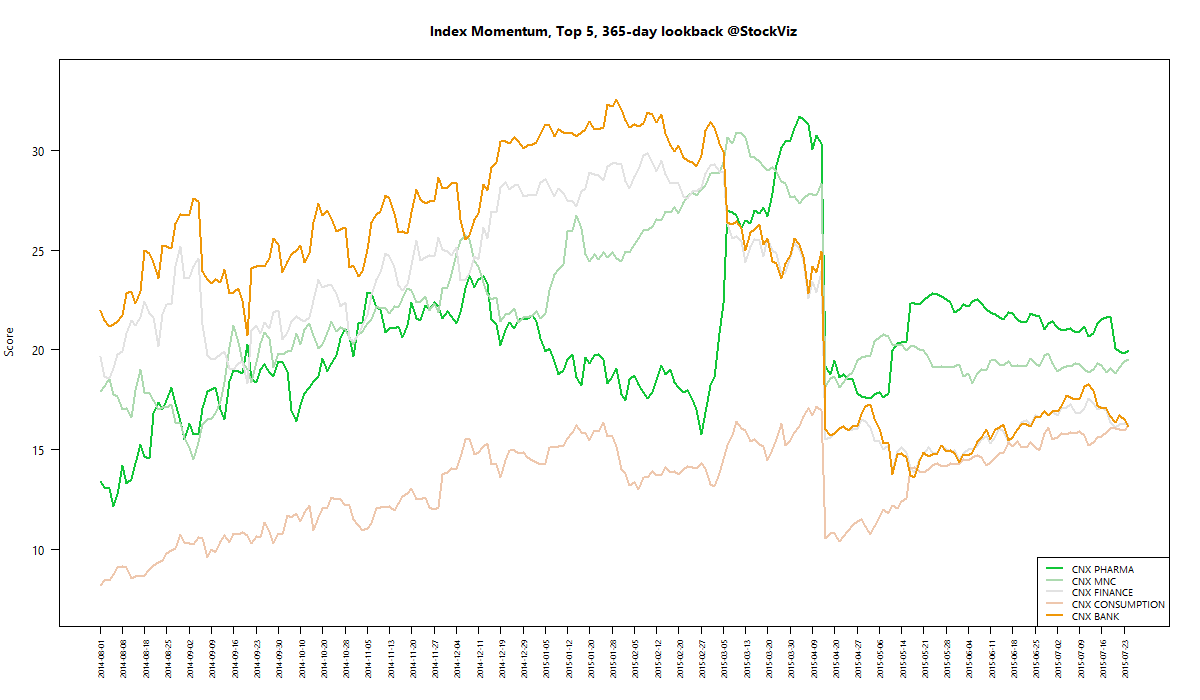
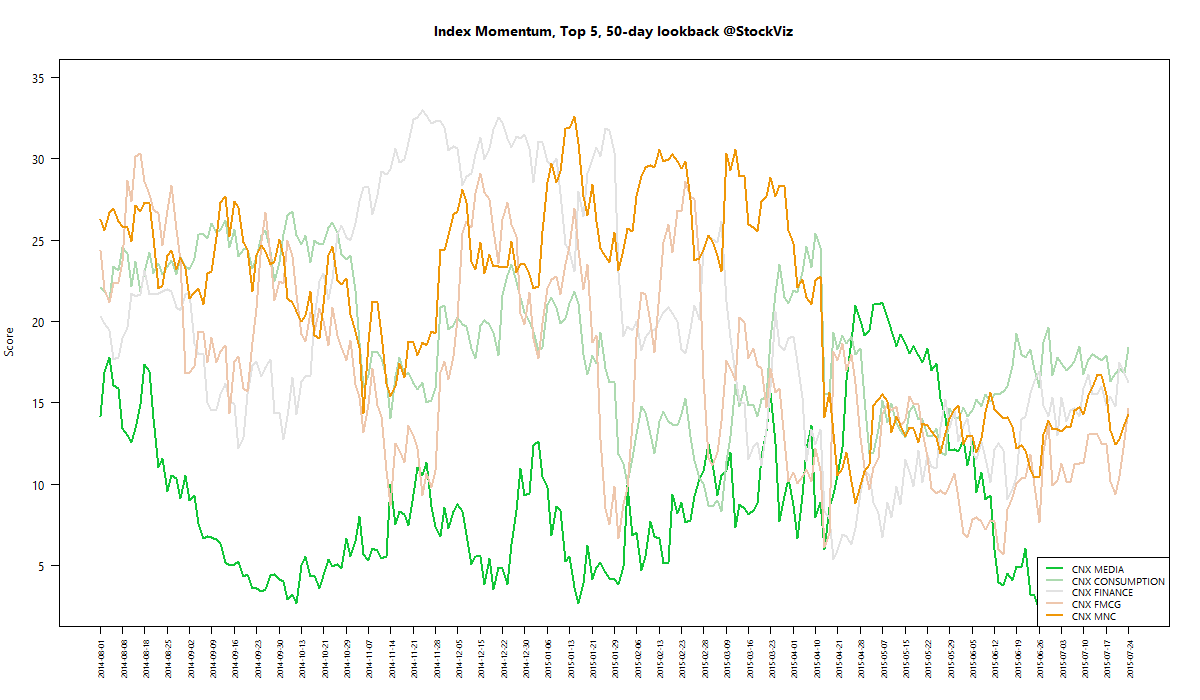
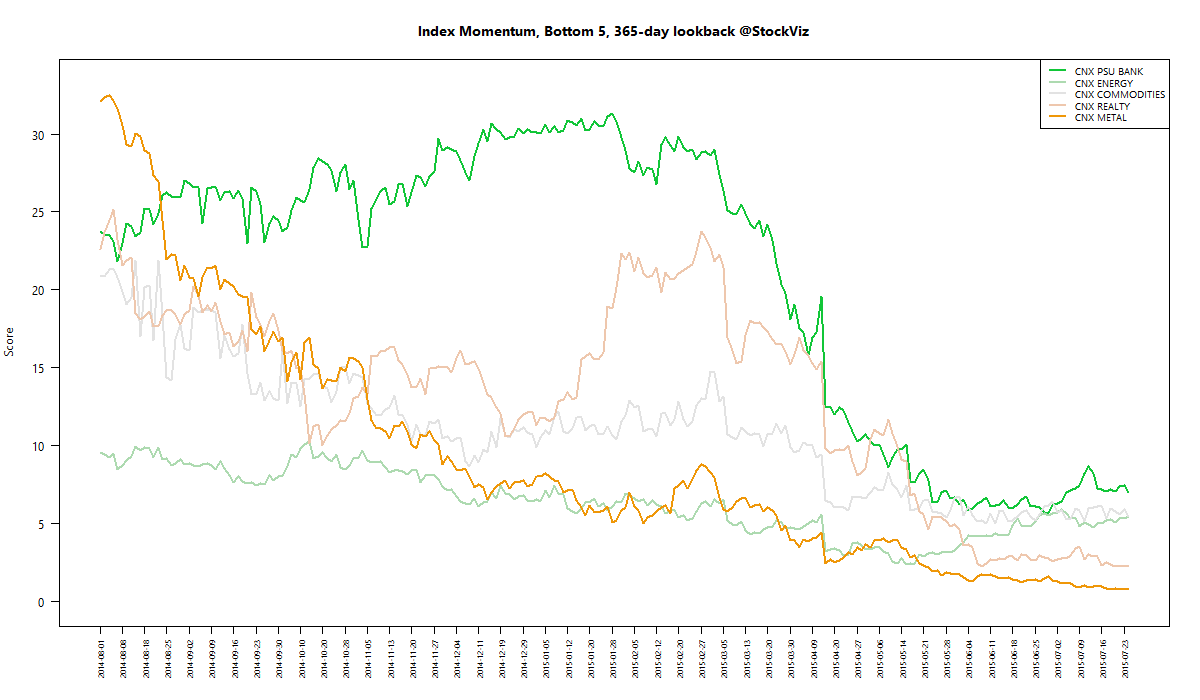
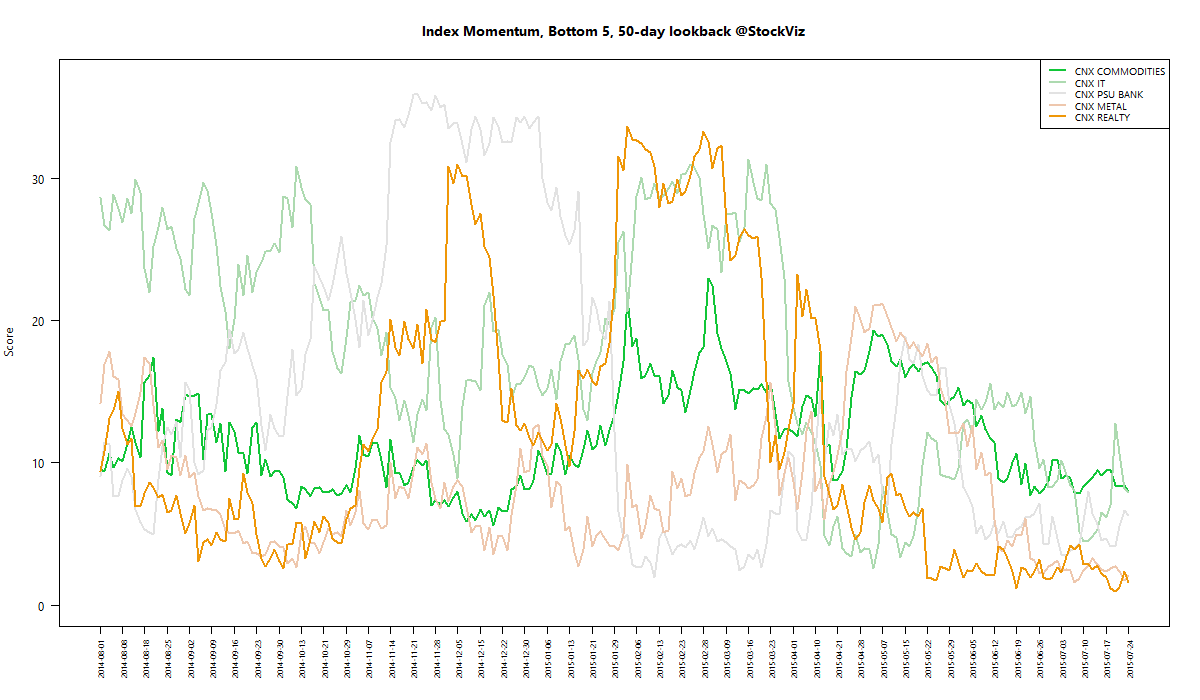
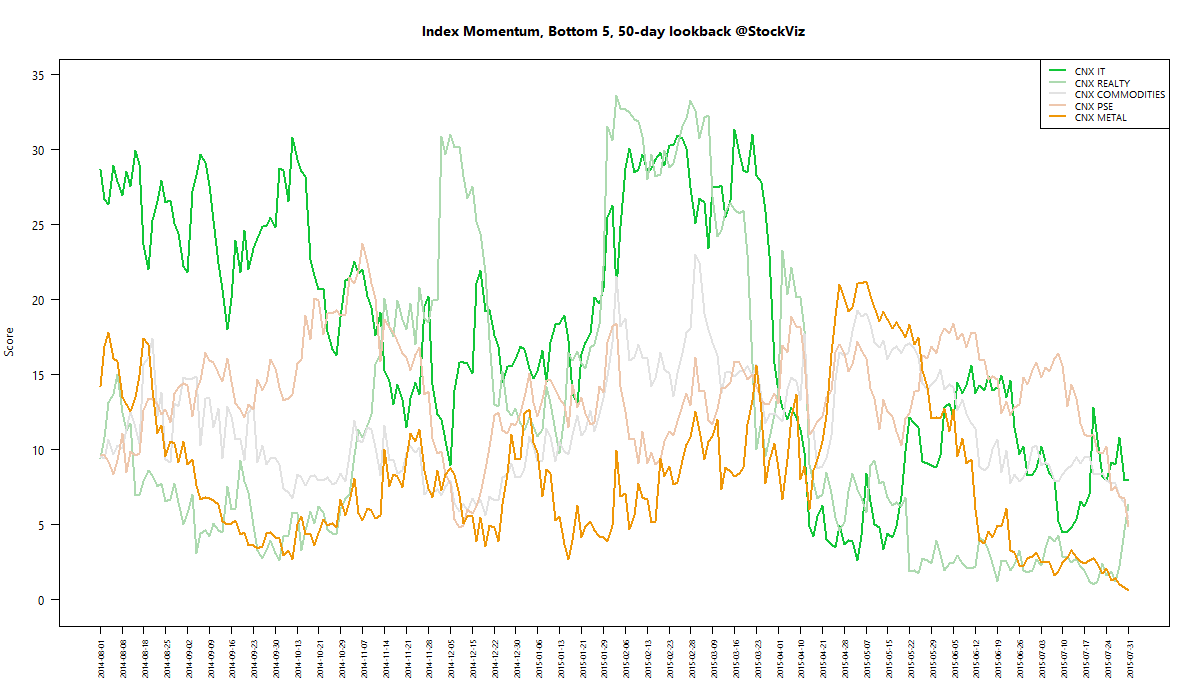
We run our proprietary momentum scoring algorithm on indices just like we do on stocks. You can use the momentum scores of sub-indices to get a sense for which sectors have the wind on their backs and those that are facing headwinds.
Traders can pick their longs in sectors with high short-term momentum and their shorts in sectors with low momentum. Investors can use the longer lookback scores to position themselves using our re-factored index Themes.
You can see how the momentum algorithm has performed on individual stocks here.
Here are the best and the worst sub-indices:


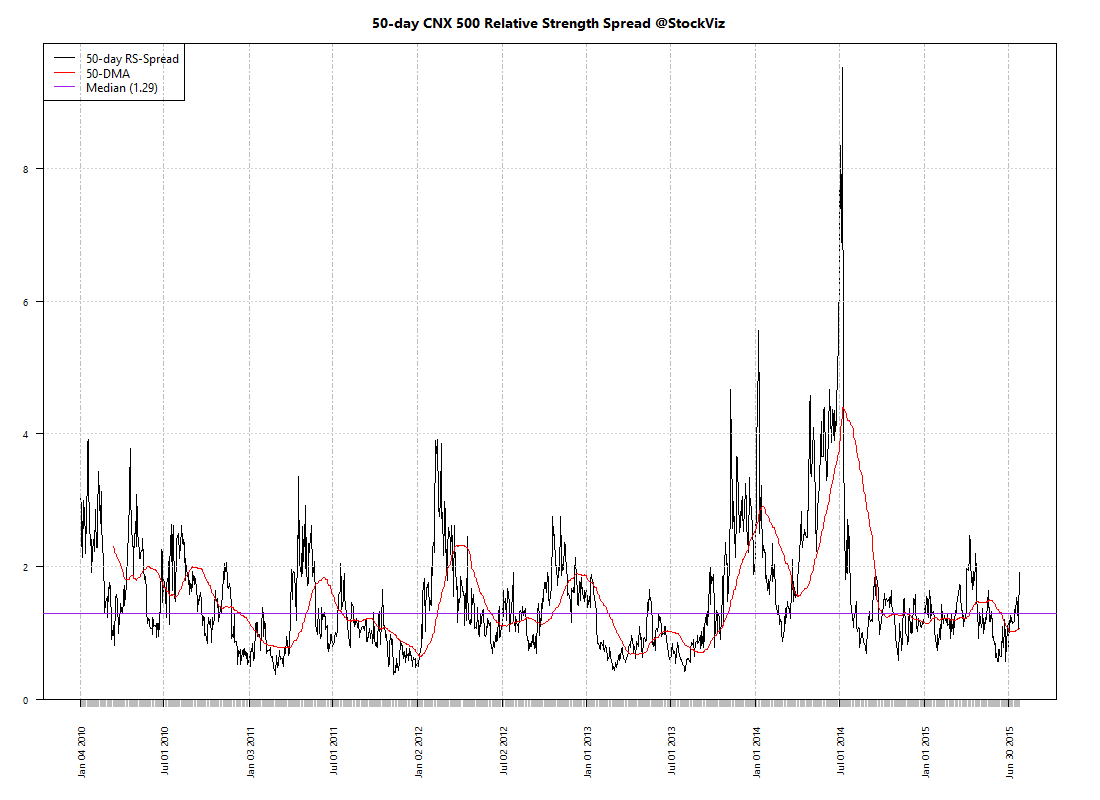
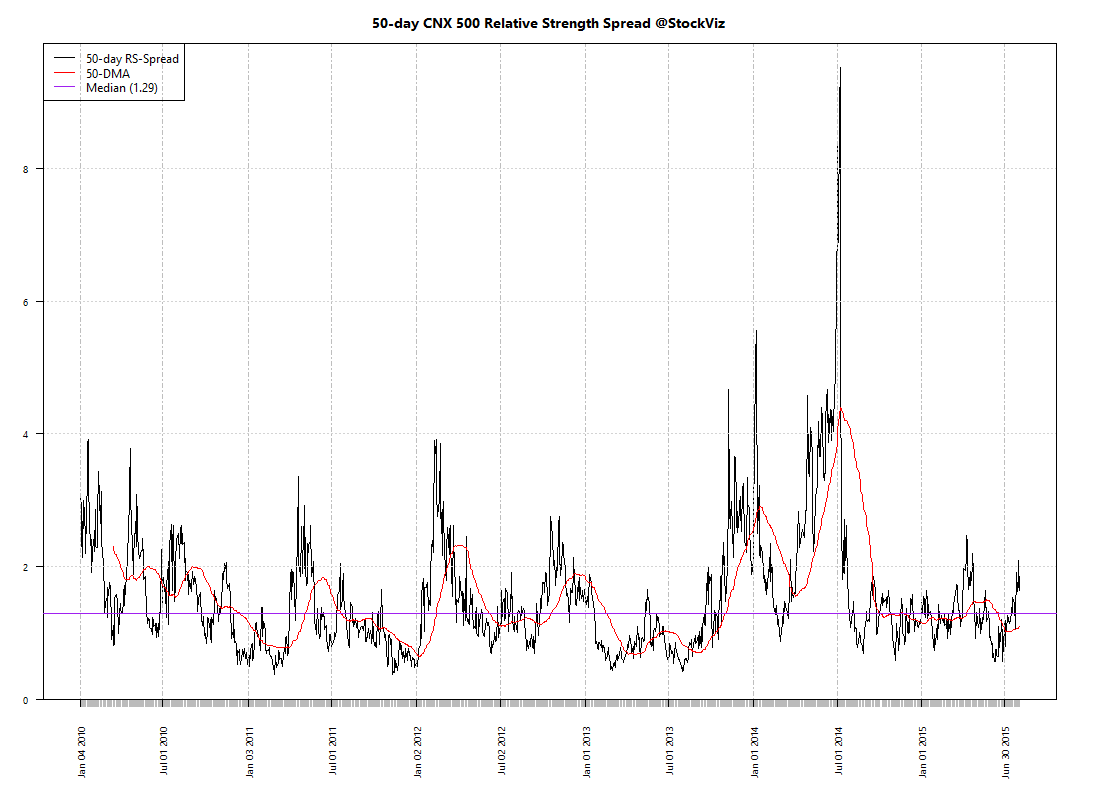
Relative Strength Spread
Refactored Index Performance
50-day performance, from May 25, 2015 through July 31, 2015:
Trend Model Summary
| Index |
Signal |
% From Peak |
Day of Peak |
| CNX AUTO |
SHORT |
6.10
|
2015-Jan-27
|
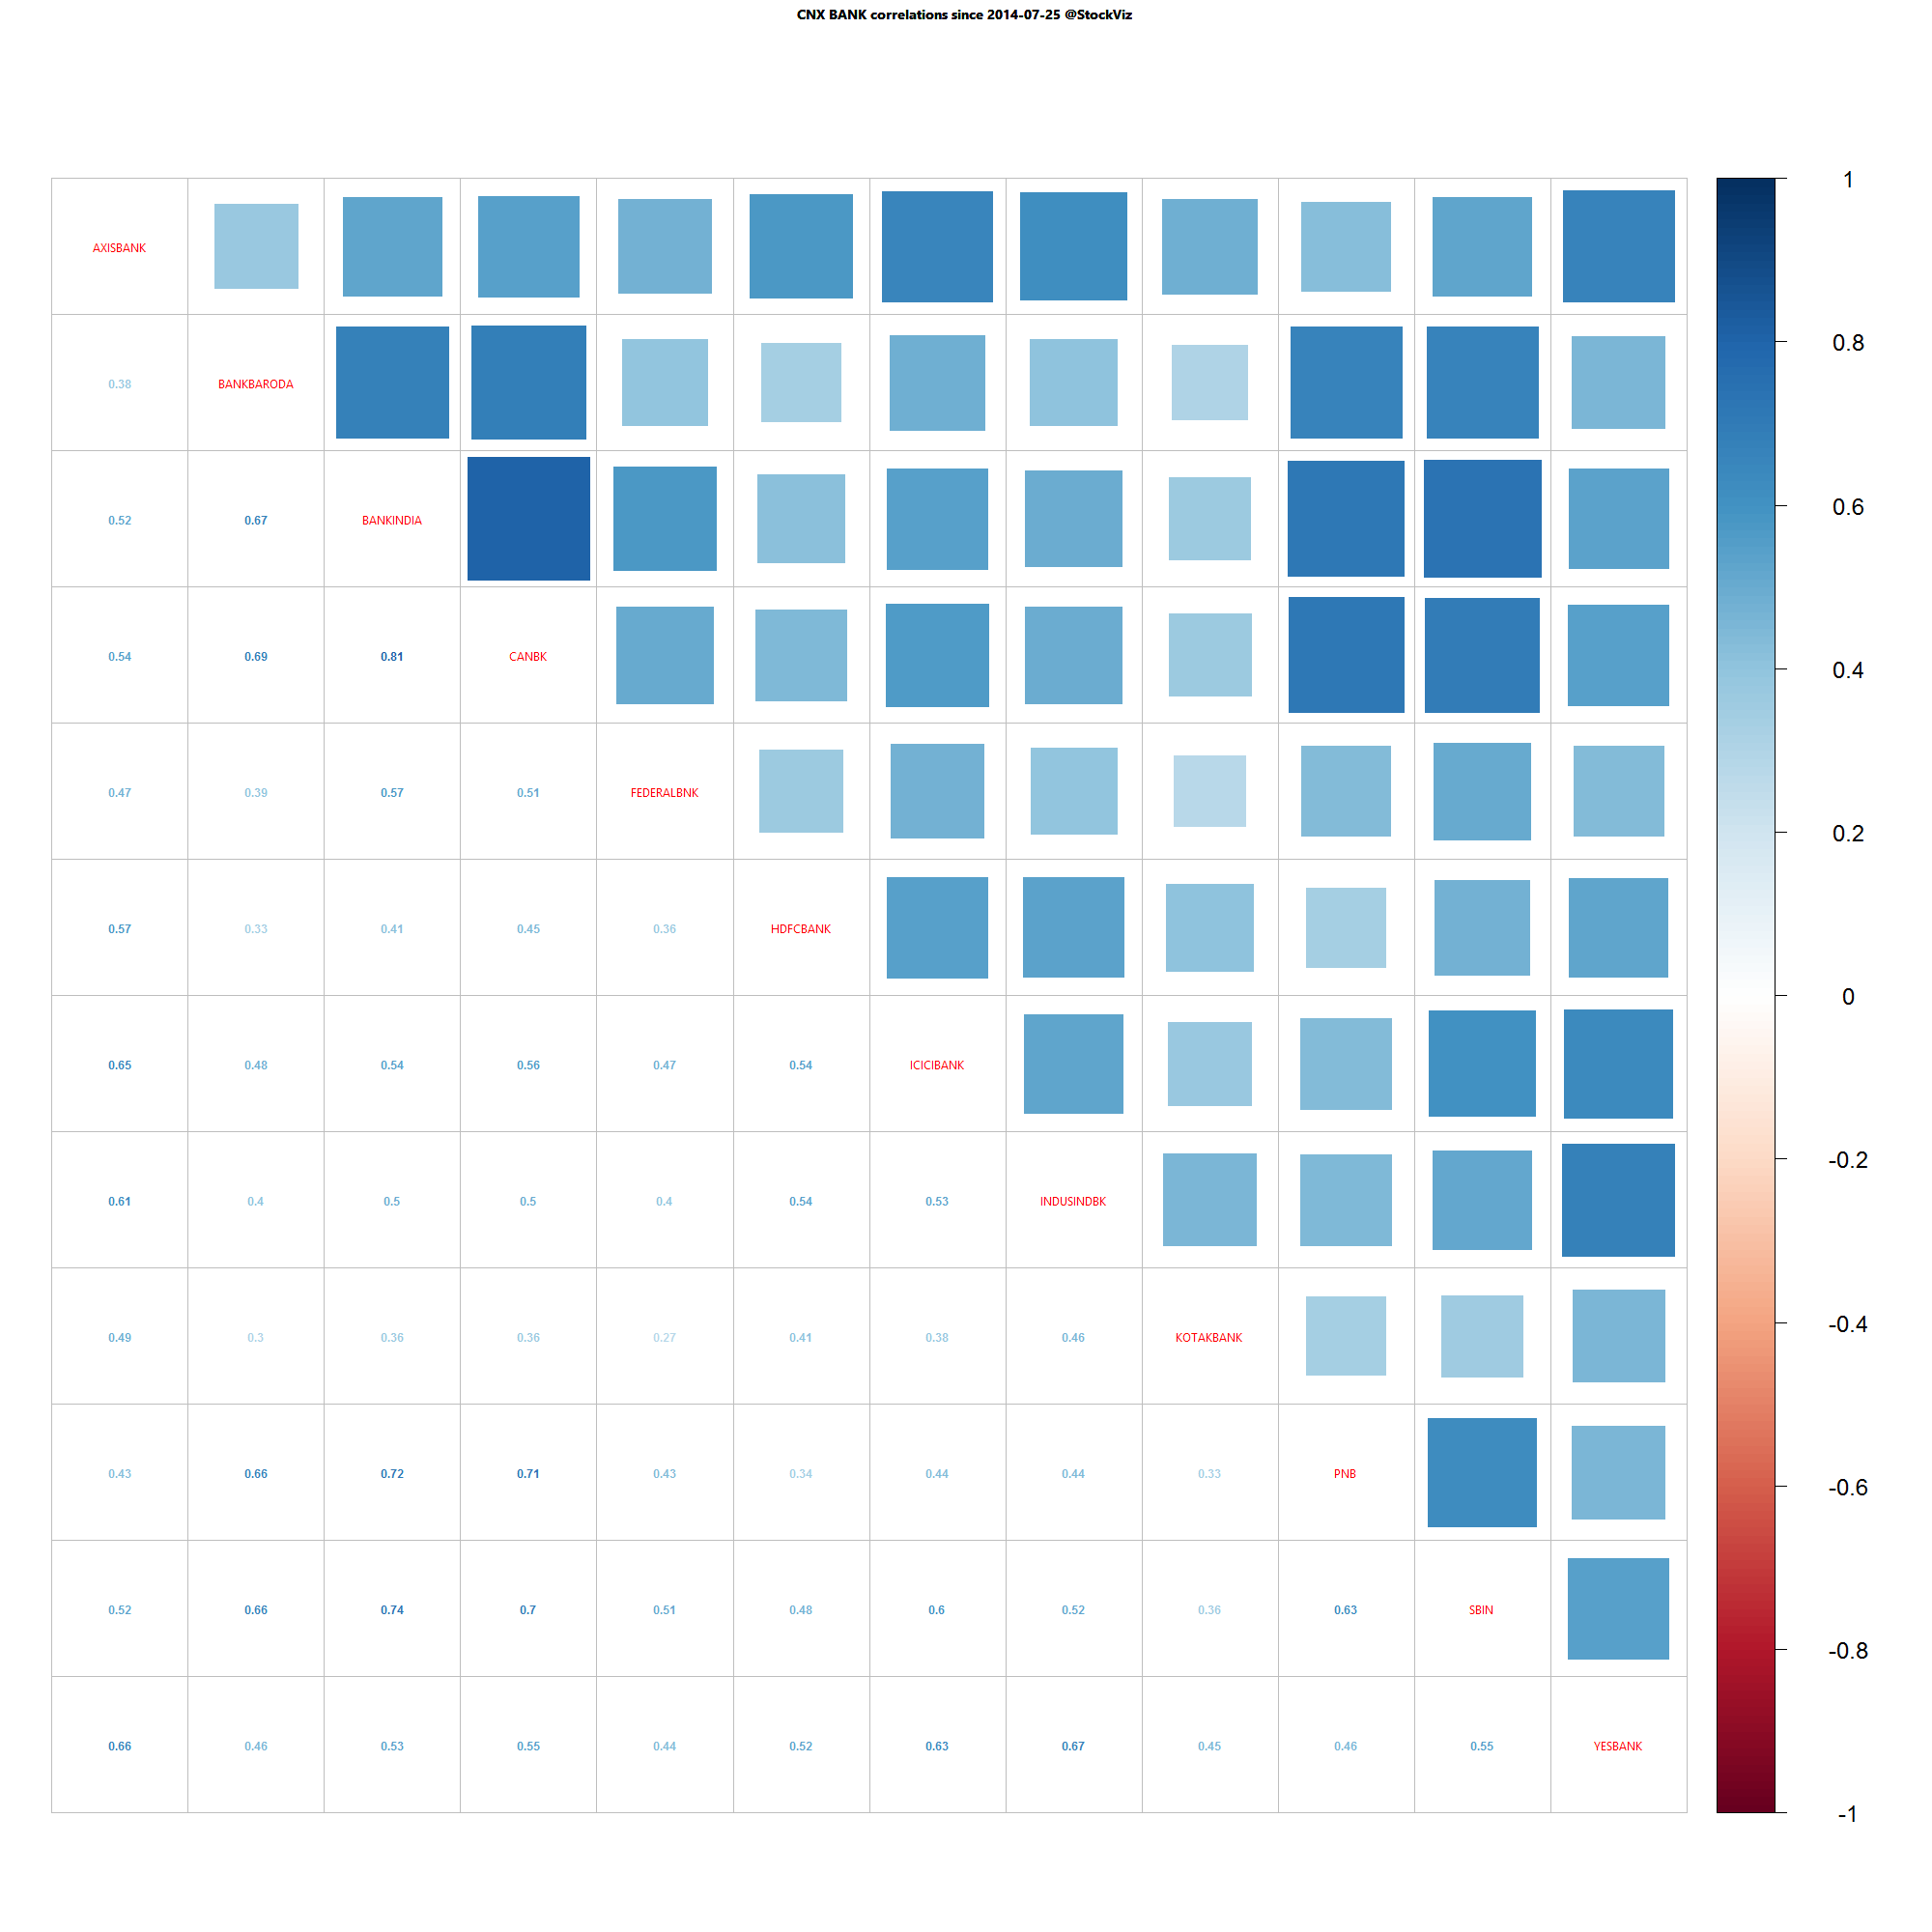
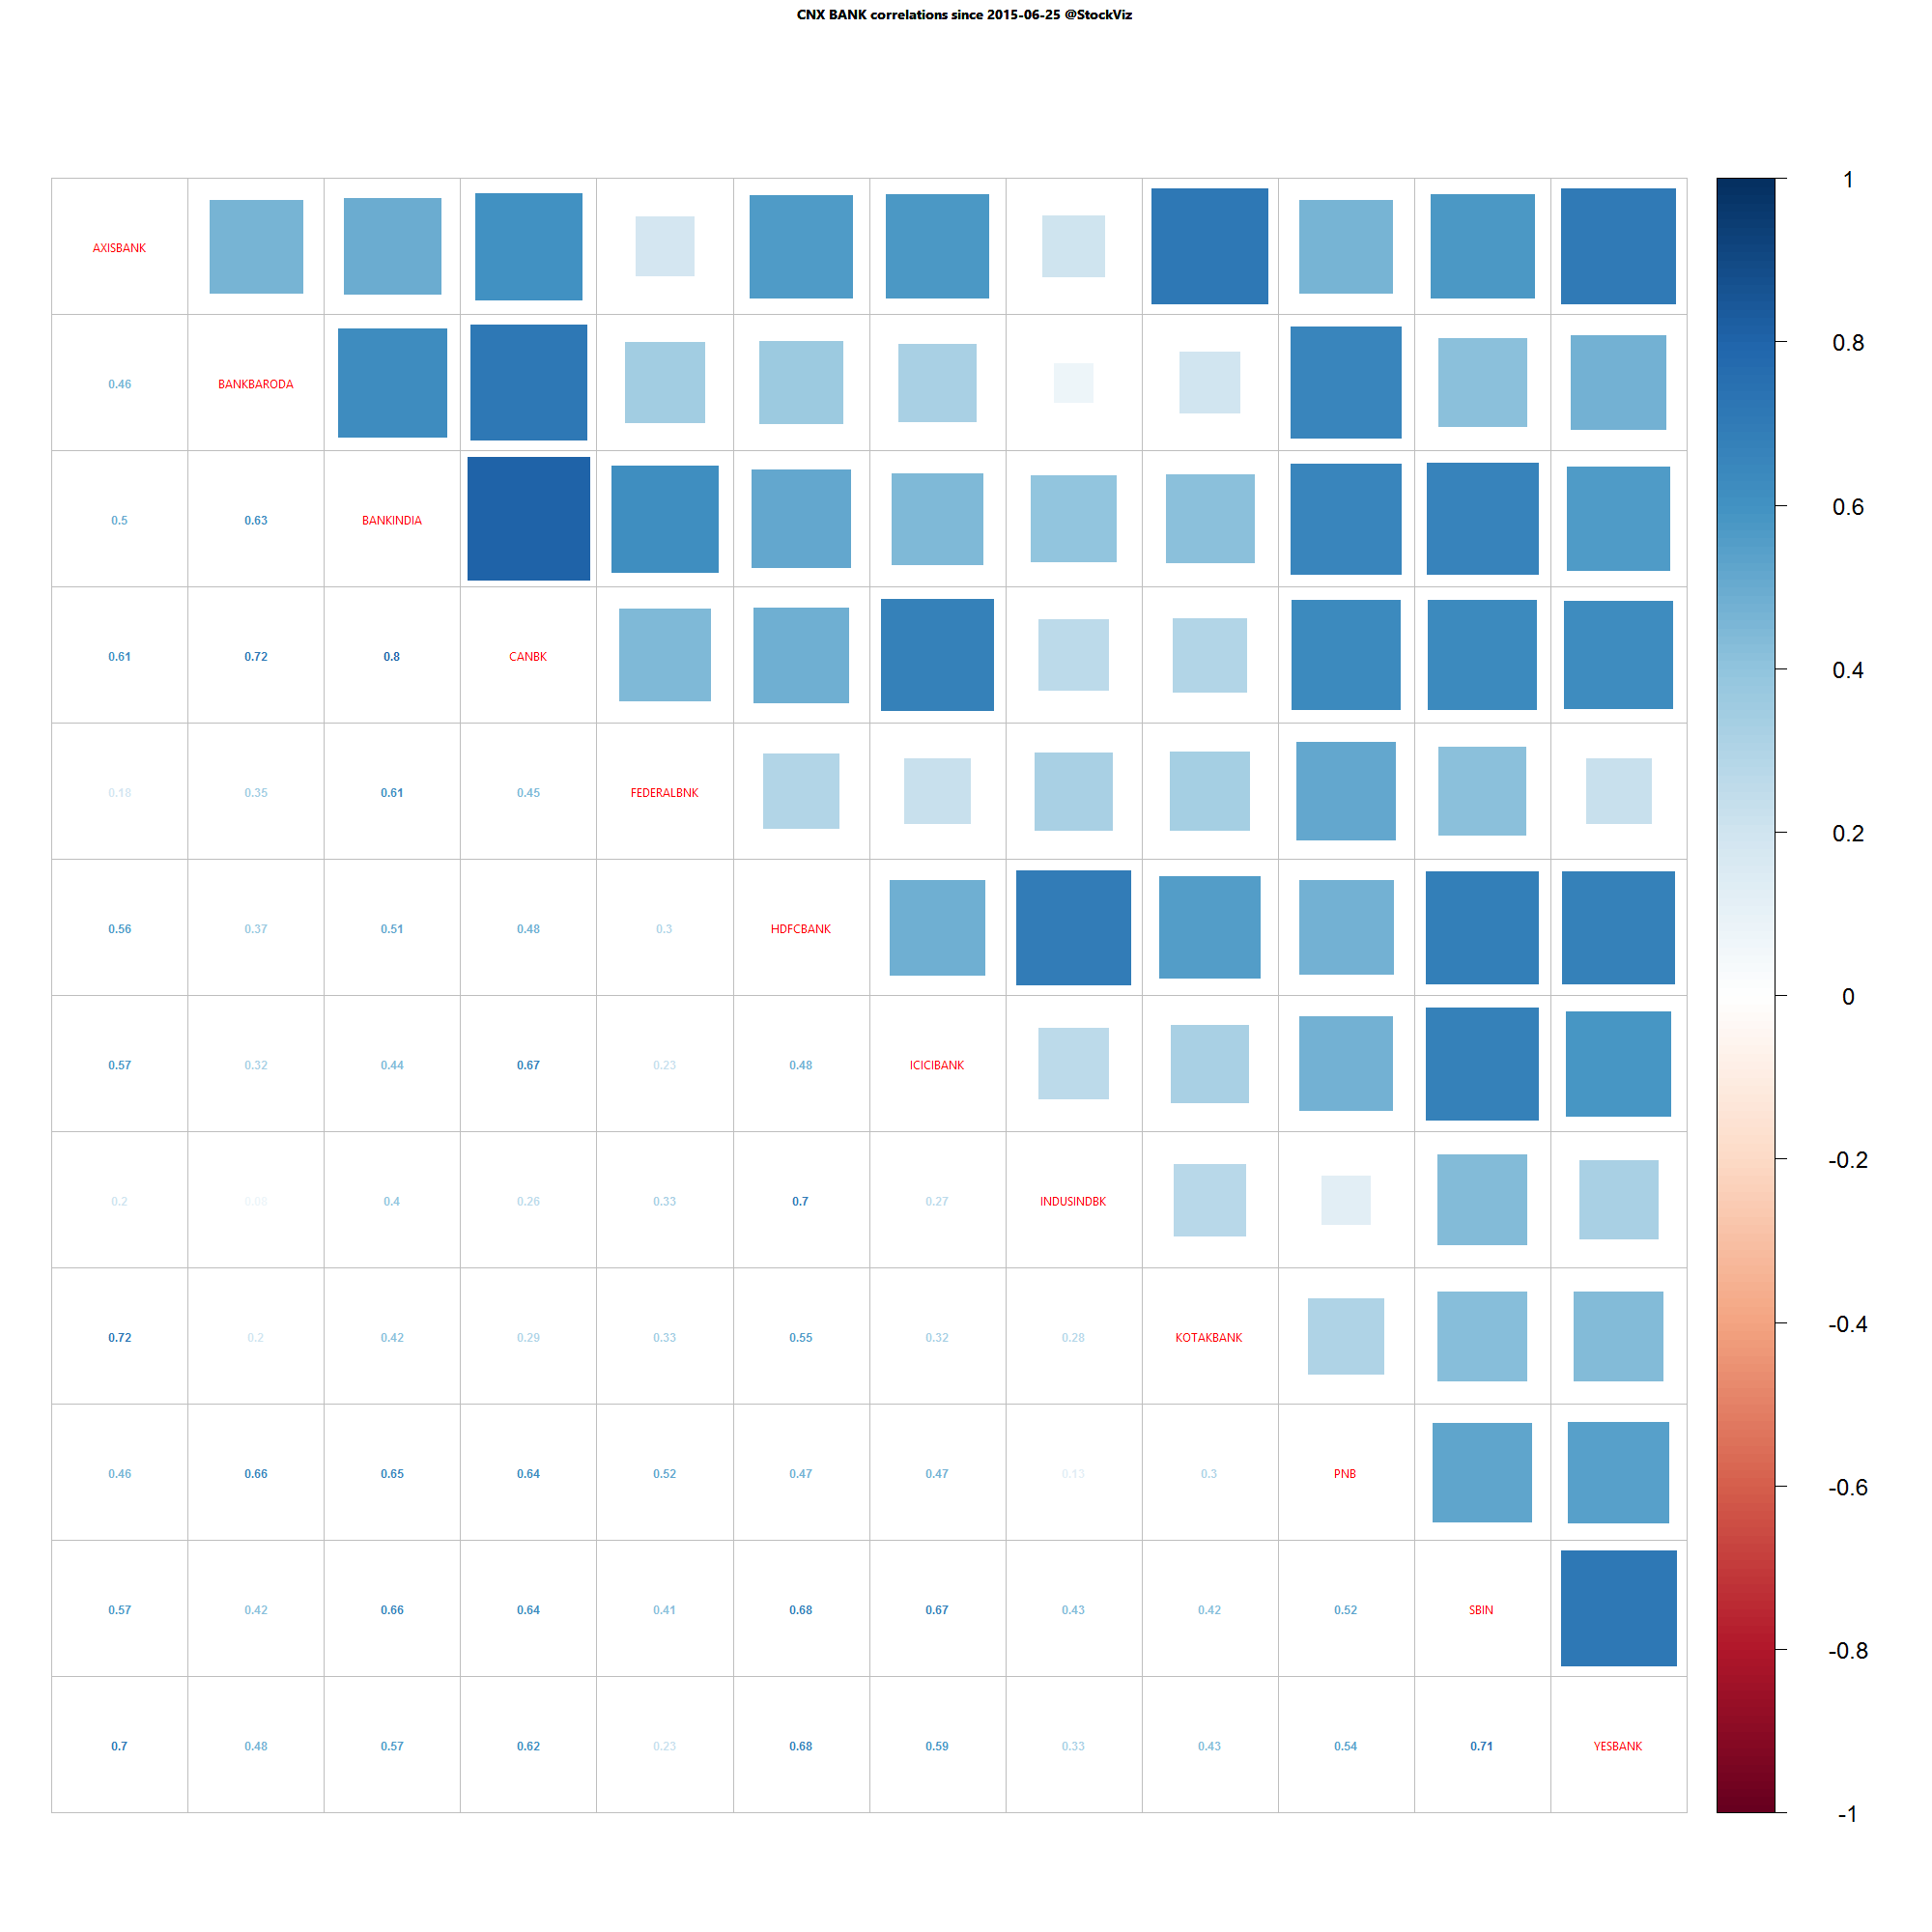
| CNX BANK |
SHORT |
8.88
|
2015-Jan-27
|
| CNX COMMODITIES |
SHORT |
29.07
|
2008-Jan-04
|
| CNX CONSUMPTION |
SHORT |
0.00
|
2015-Jul-31
|
| CNX ENERGY |
LONG |
27.48
|
2008-Jan-14
|
| CNX FMCG |
SHORT |
6.17
|
2015-Feb-25
|
| CNX INFRA |
LONG |
47.33
|
2008-Jan-09
|
| CNX IT |
SHORT |
87.86
|
2000-Feb-21
|
| CNX MEDIA |
SHORT |
16.68
|
2008-Jan-04
|
| CNX METAL |
LONG |
61.25
|
2008-Jan-04
|
| CNX MNC |
SHORT |
0.00
|
2015-Jul-31
|
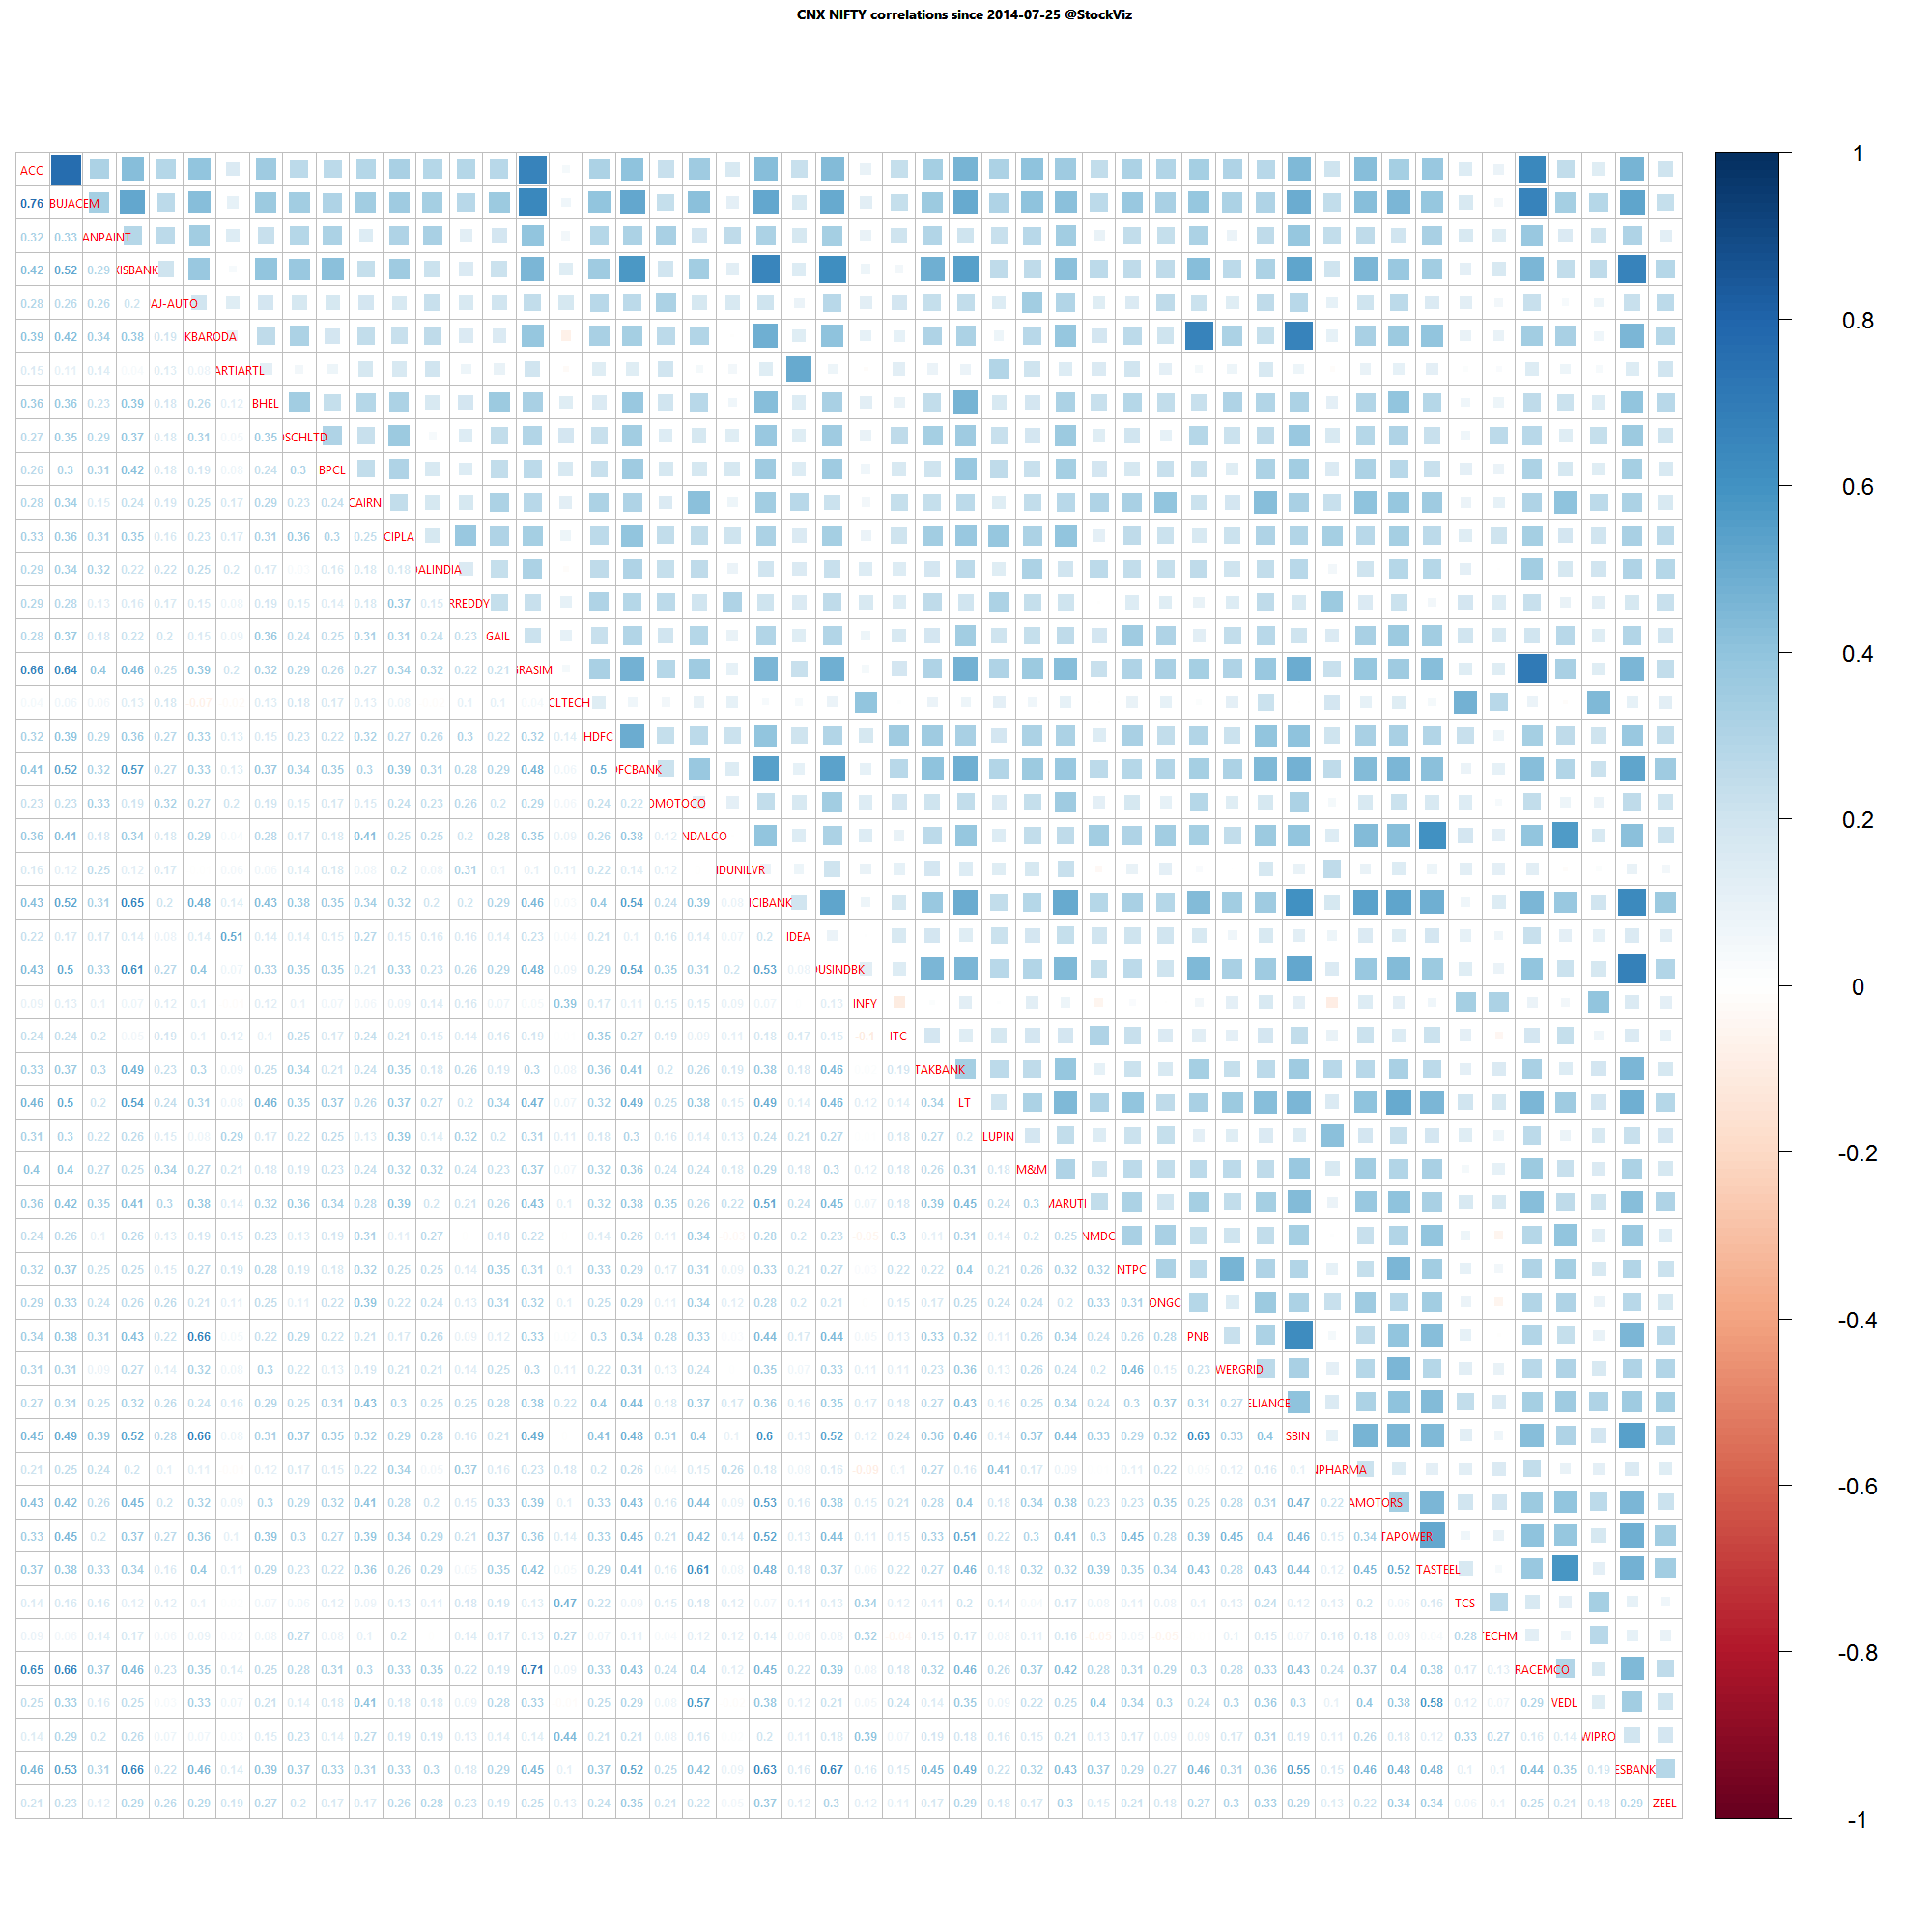
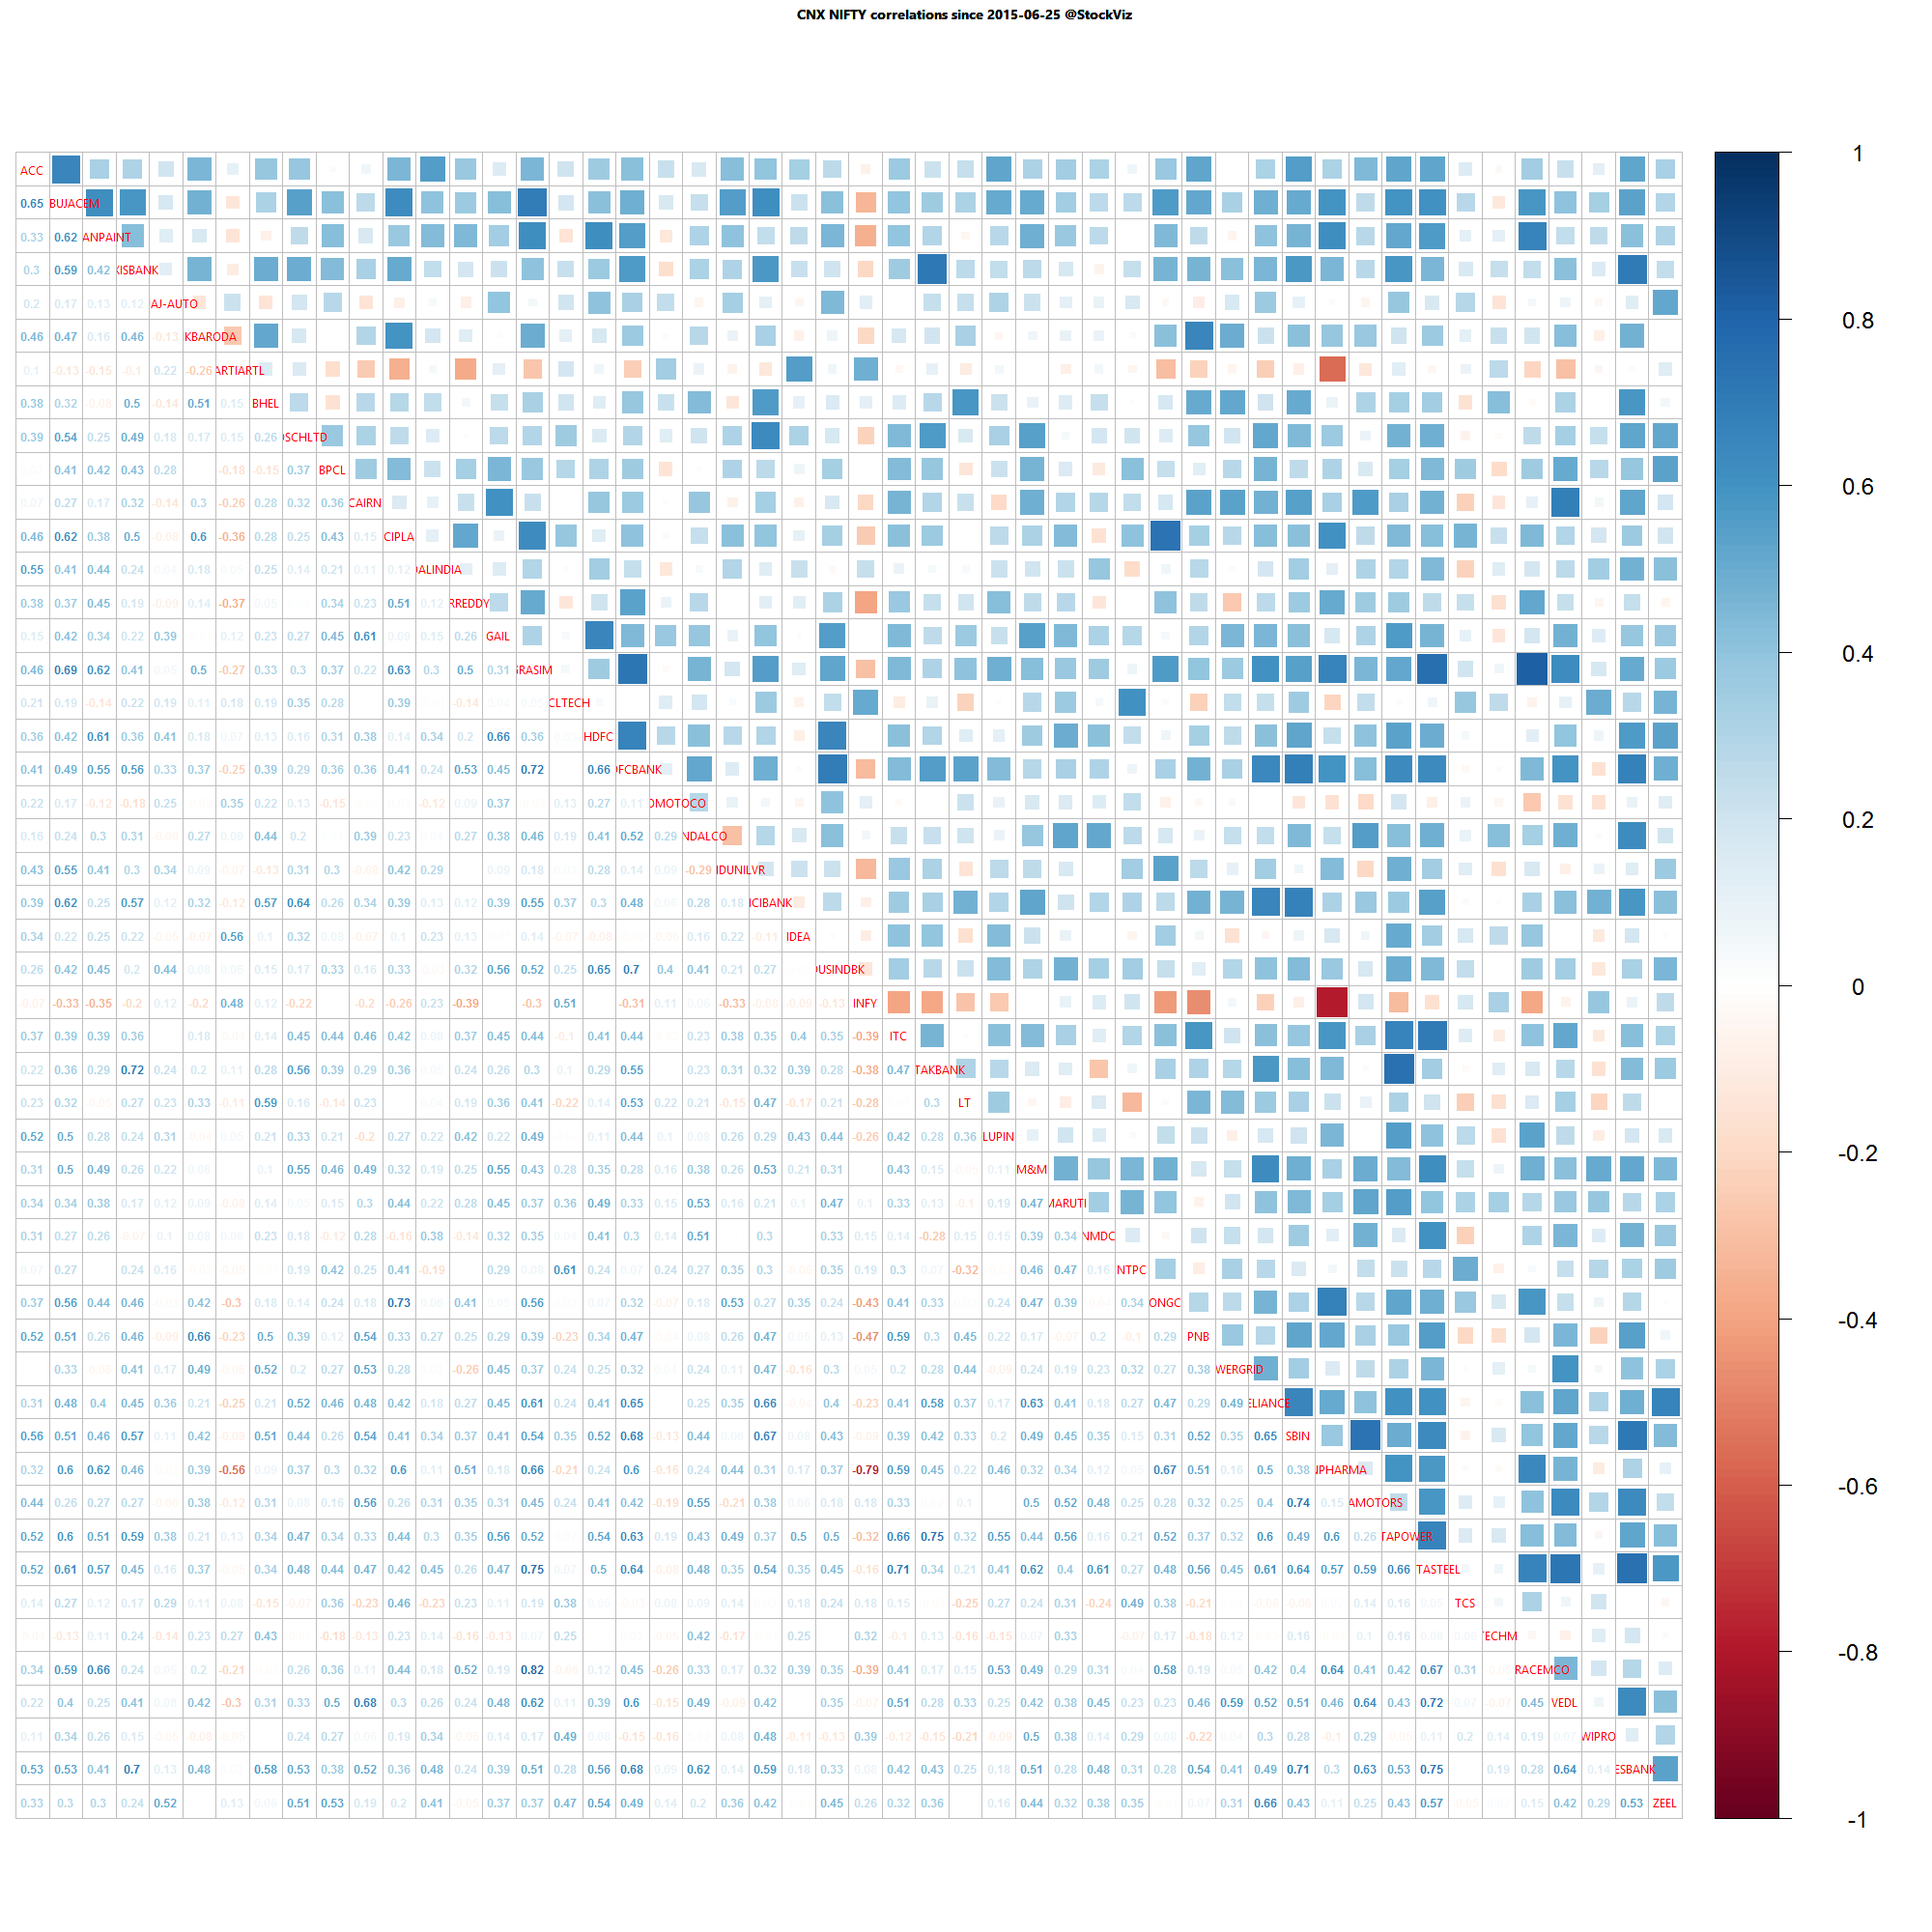
| CNX NIFTY |
SHORT |
5.15
|
2015-Mar-03
|
| CNX PHARMA |
LONG |
10.69
|
2015-Apr-08
|
| CNX PSE |
LONG |
24.77
|
2008-Jan-04
|
| CNX PSU BANK |
SHORT |
36.53
|
2010-Nov-05
|
| CNX REALTY |
LONG |
90.60
|
2008-Jan-14
|
| CNX SERVICE |
SHORT |
6.10
|
2015-Mar-03
|
Relative strength spread shot through its long-term median – good for momentum strategies.
CONSUMPTION and MNC indices recovered from their drawdowns. Will NIFTY be next?