Author: stockviz

Index Update 25.09.2015

MOMENTUM

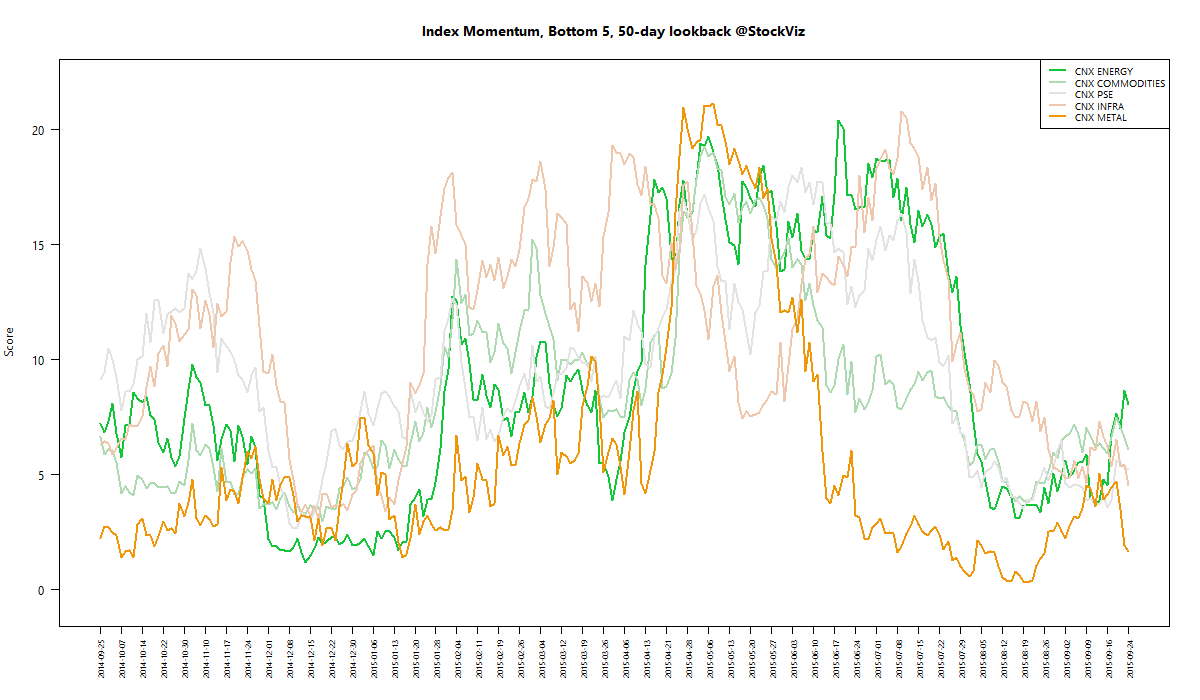
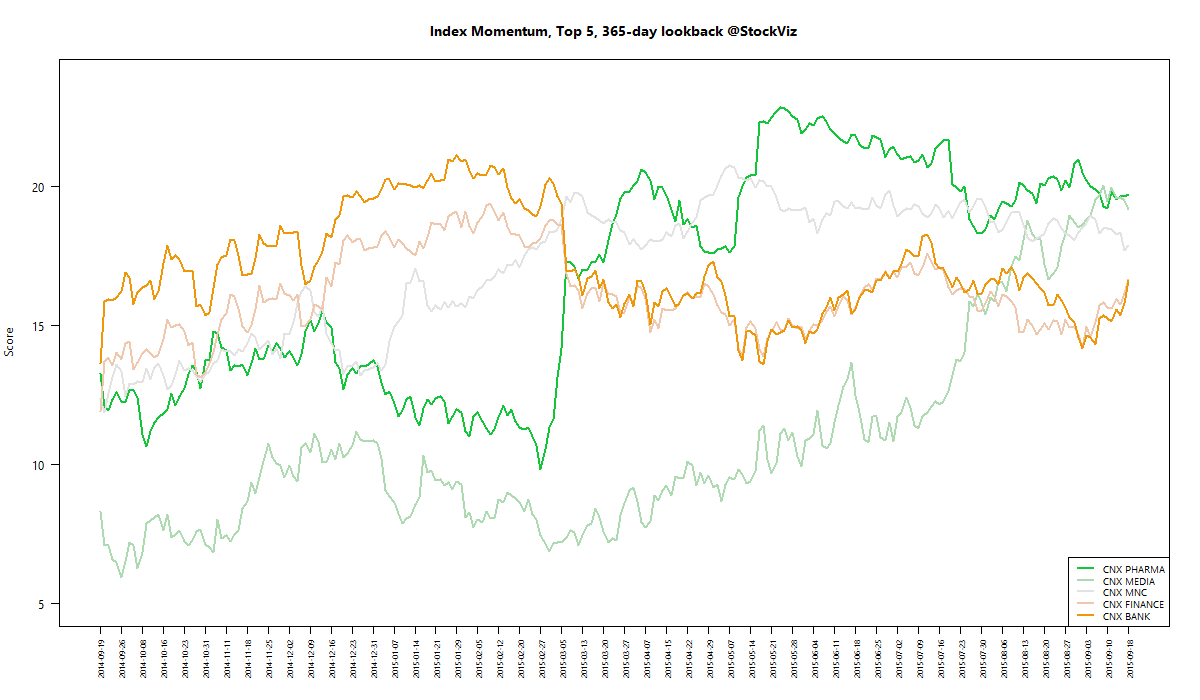
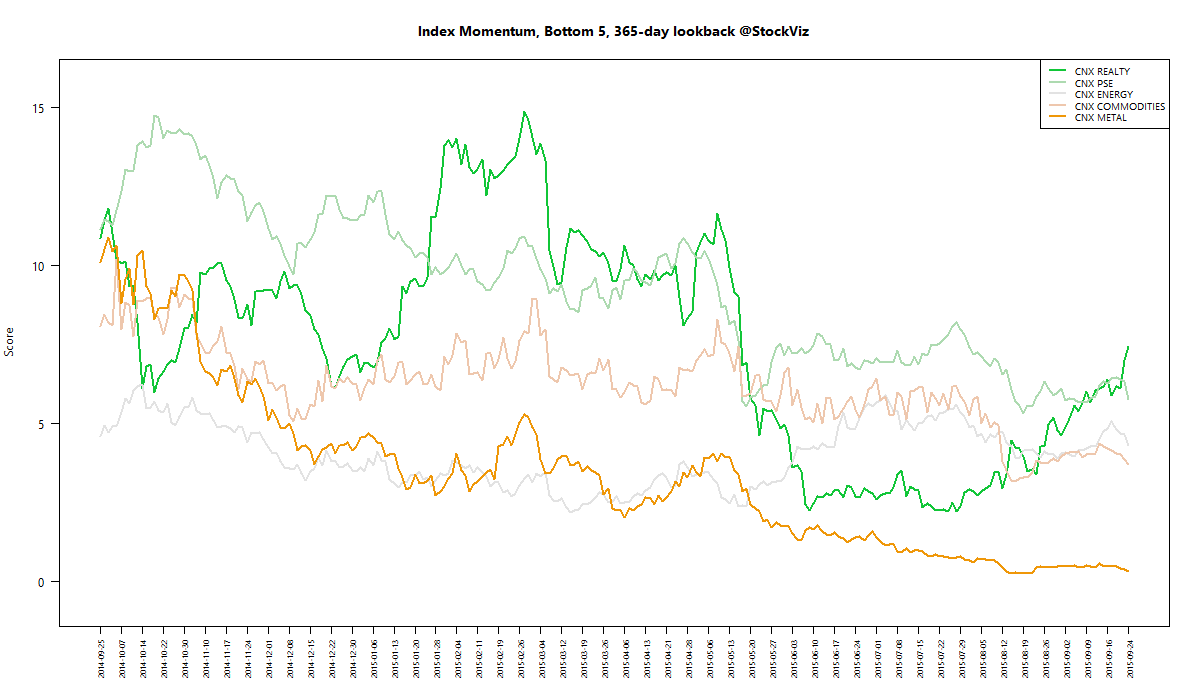
We run our proprietary momentum scoring algorithm on indices just like we do on stocks. You can use the momentum scores of sub-indices to get a sense for which sectors have the wind on their backs and those that are facing headwinds.

Traders can pick their longs in sectors with high short-term momentum and their shorts in sectors with low momentum. Investors can use the longer lookback scores to position themselves using our re-factored index Themes.

You can see how the momentum algorithm has performed on individual stocks here.

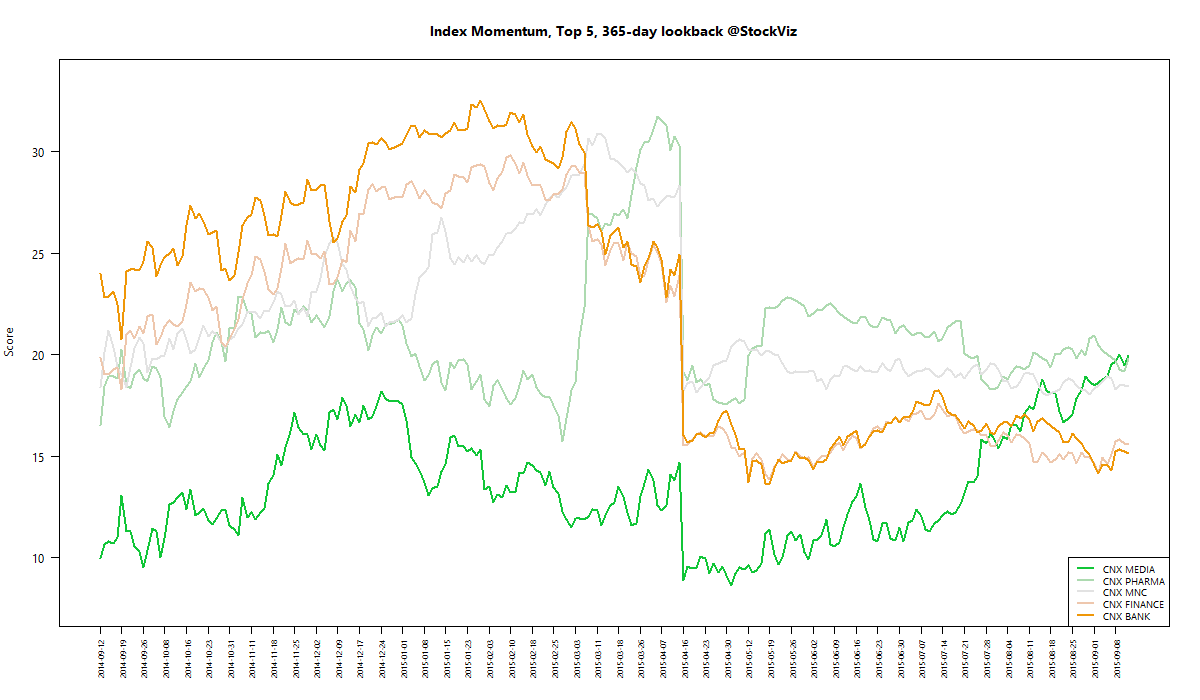
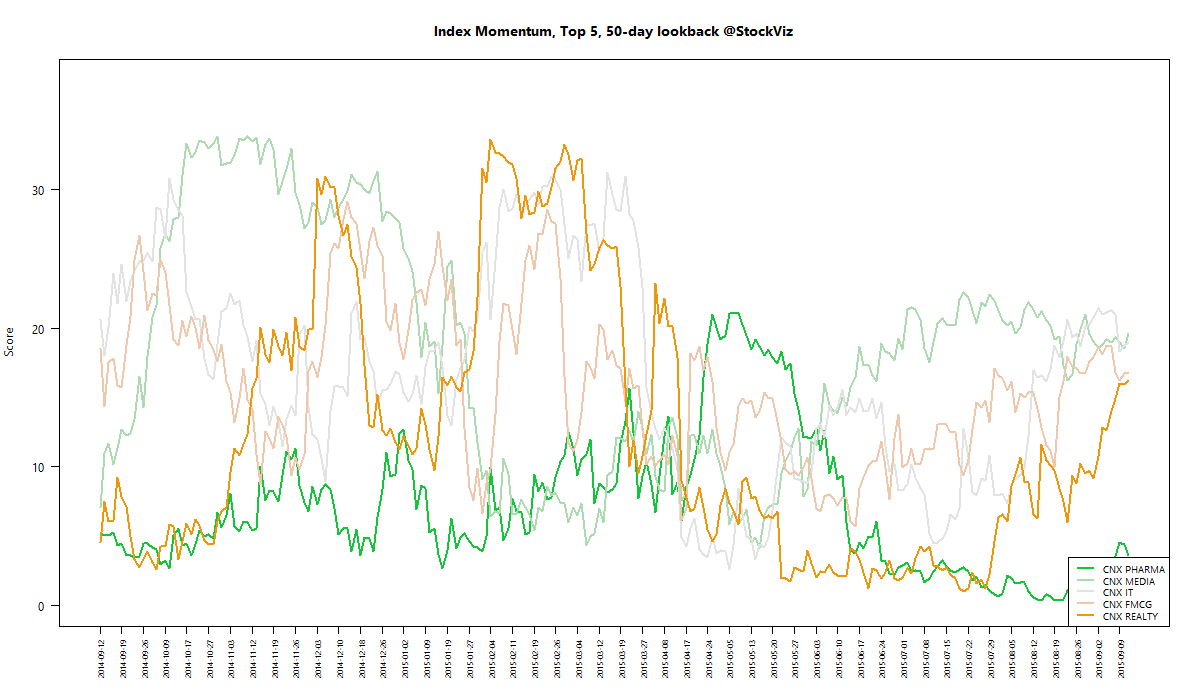
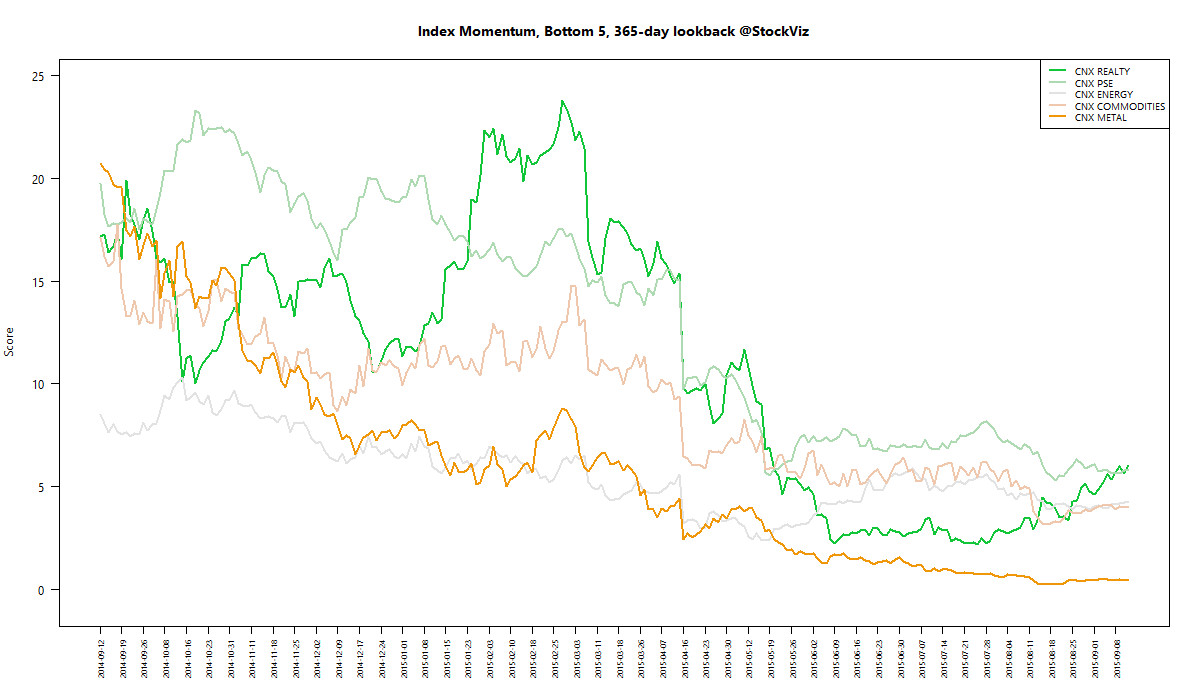
Here are the best and the worst sub-indices:
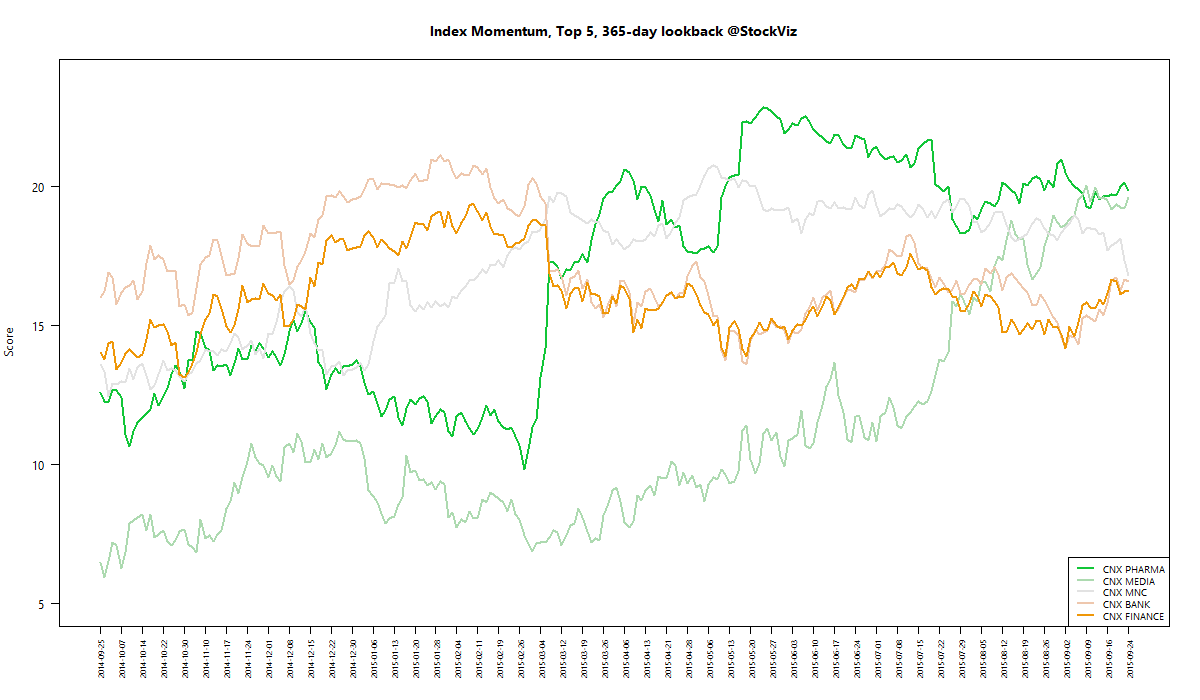
index momentum best 365 2015-09-24 png

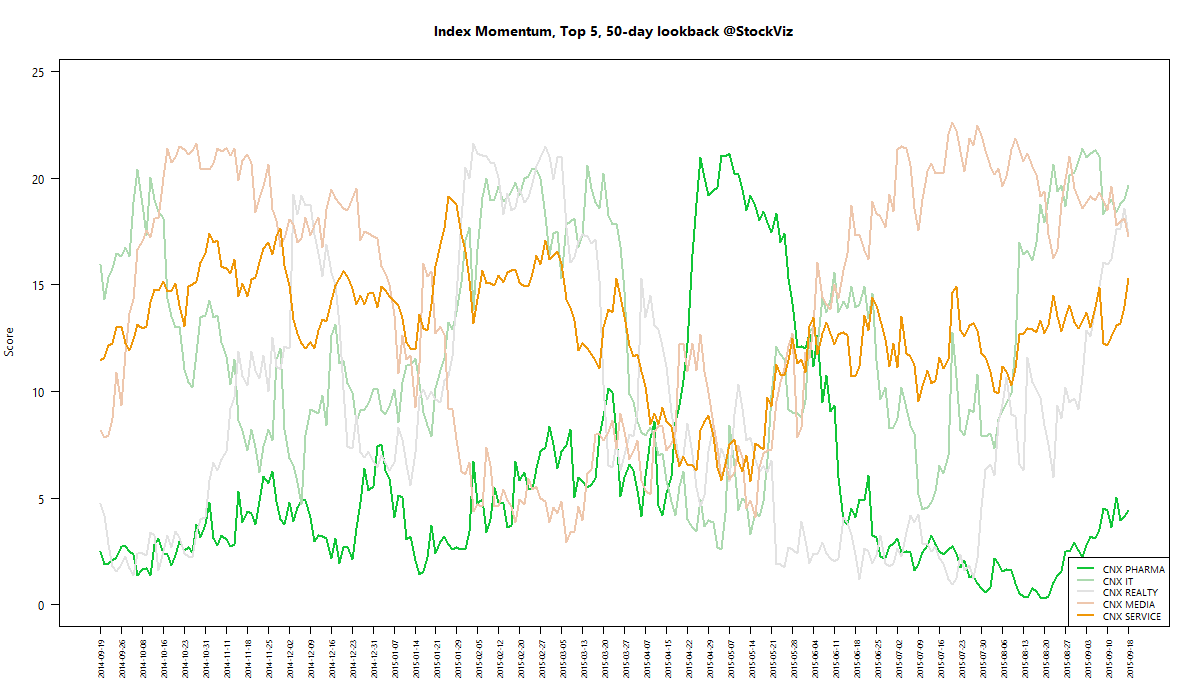
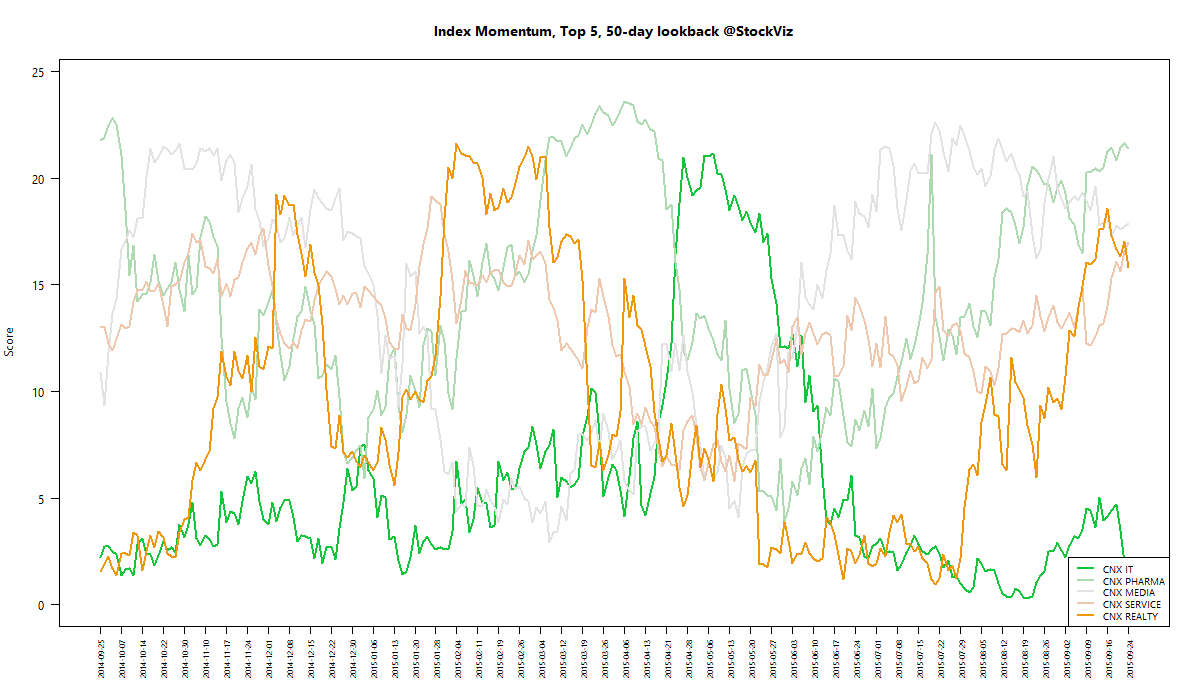
index momentum best 50 2015-09-24 png

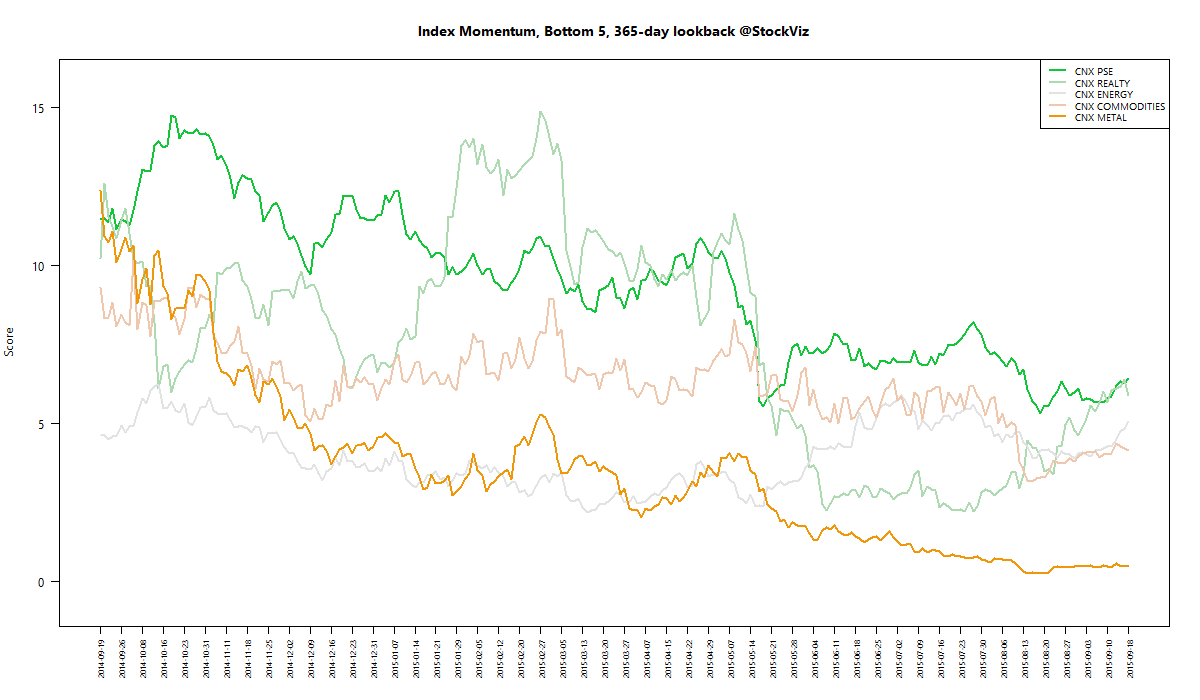
index momentum worst 365 2015-09-24 png

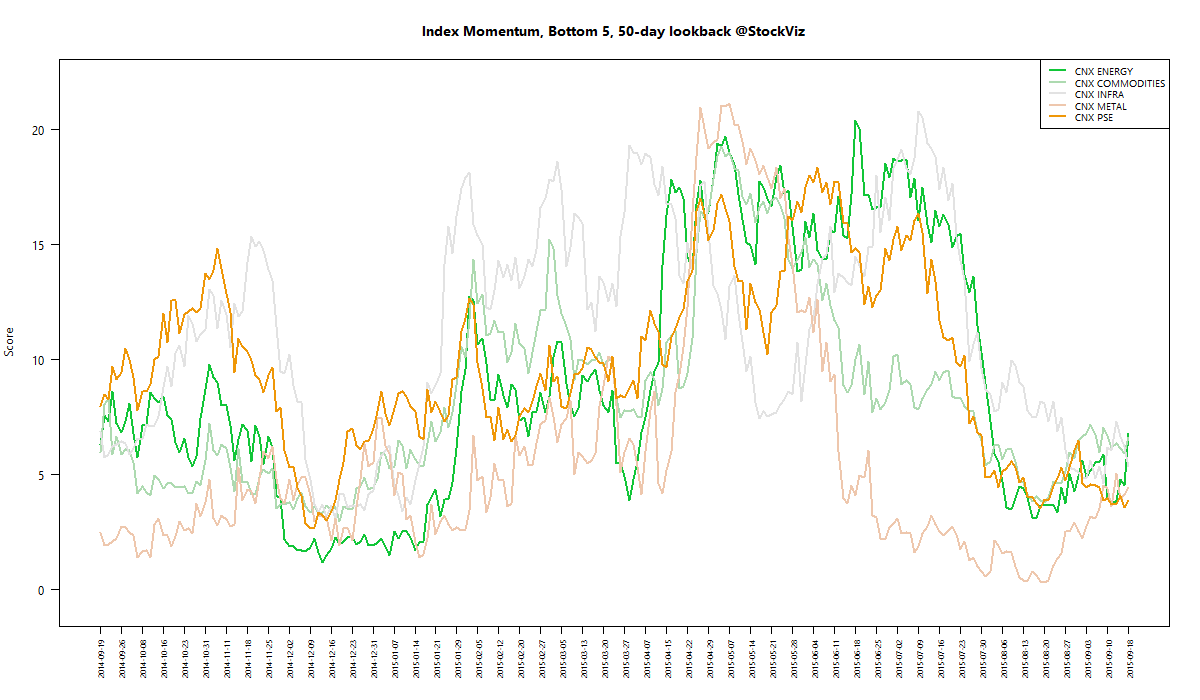
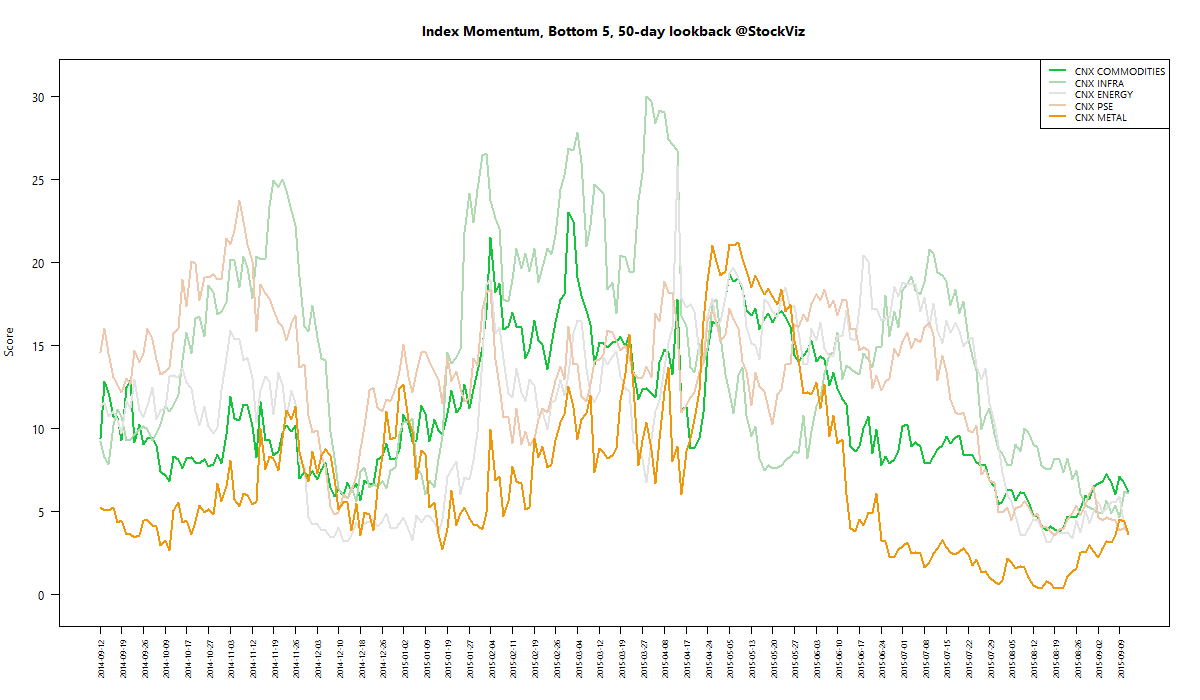
index momentum worst 50 2015-09-24 png

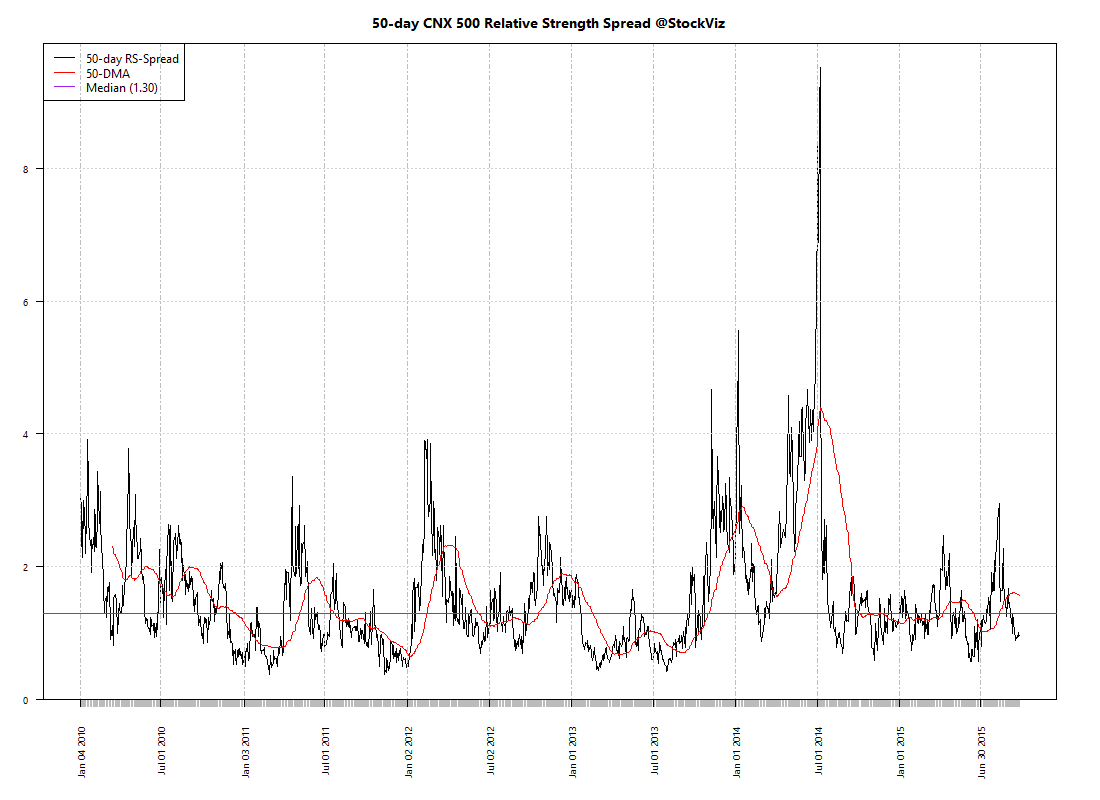
Relative Strength Spread

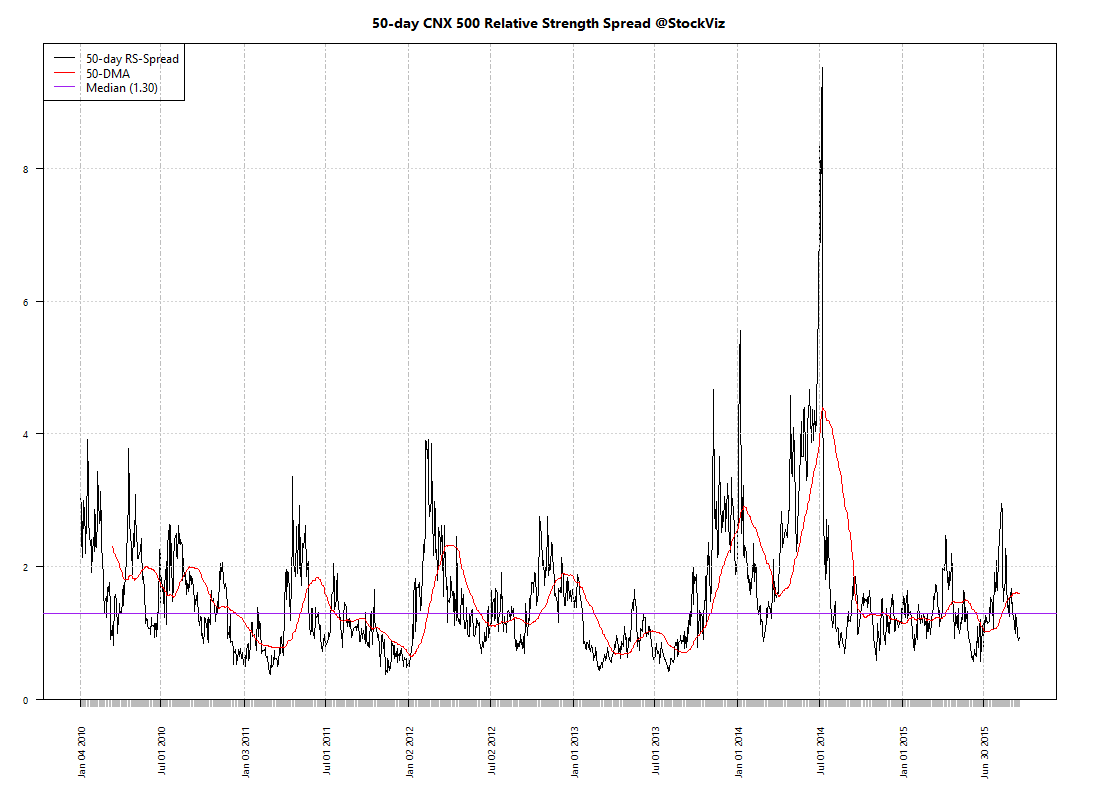
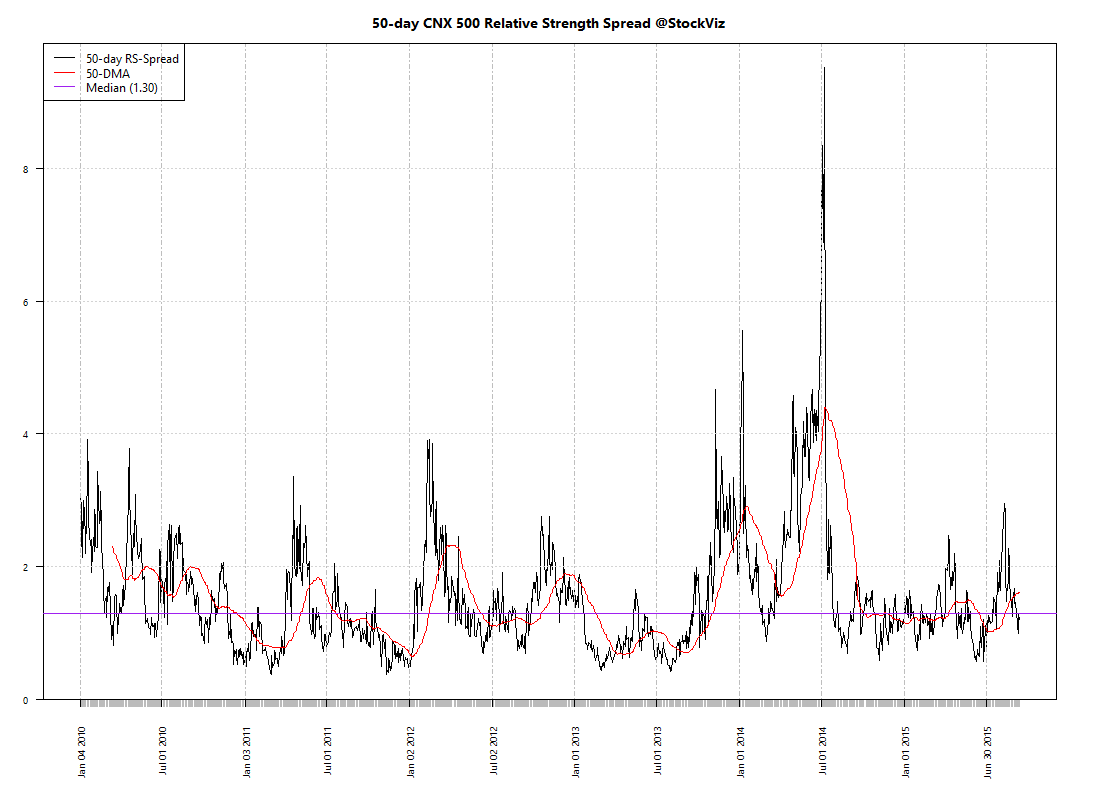
CNX_500 relative-spread-index 50 2015-09-24 png

Refactored Index Performance

50-day performance, from July 16, 2015 through September 24, 2015:

Trend Model Summary

Index Signal % From Peak Day of Peak
CNX AUTO SHORT
15.15
2015-Jan-27
CNX BANK LONG
16.34
2015-Jan-27
CNX COMMODITIES SHORT
38.78
2008-Jan-04
CNX CONSUMPTION SHORT
9.43
2015-Aug-05
CNX ENERGY SHORT
37.64
2008-Jan-14
CNX FMCG LONG
12.60
2015-Feb-25
CNX INFRA SHORT
55.65
2008-Jan-09
CNX IT LONG
87.48
2000-Feb-21
CNX MEDIA SHORT
18.71
2008-Jan-04
CNX METAL SHORT
69.33
2008-Jan-04
CNX MNC SHORT
10.28
2015-Aug-10
CNX NIFTY SHORT
12.54
2015-Mar-03
CNX PHARMA LONG
7.26
2015-Apr-08
CNX PSE SHORT
36.45
2008-Jan-04
CNX PSU BANK LONG
41.91
2010-Nov-05
CNX REALTY LONG
90.96
2008-Jan-14
CNX SERVICE LONG
11.70
2015-Mar-03
Relative strength spread continues to be in negative momentum territory. Contrarians can use this moment to load up on momentum strategies and ride the bounce…

Correlation Update 25.09.2015

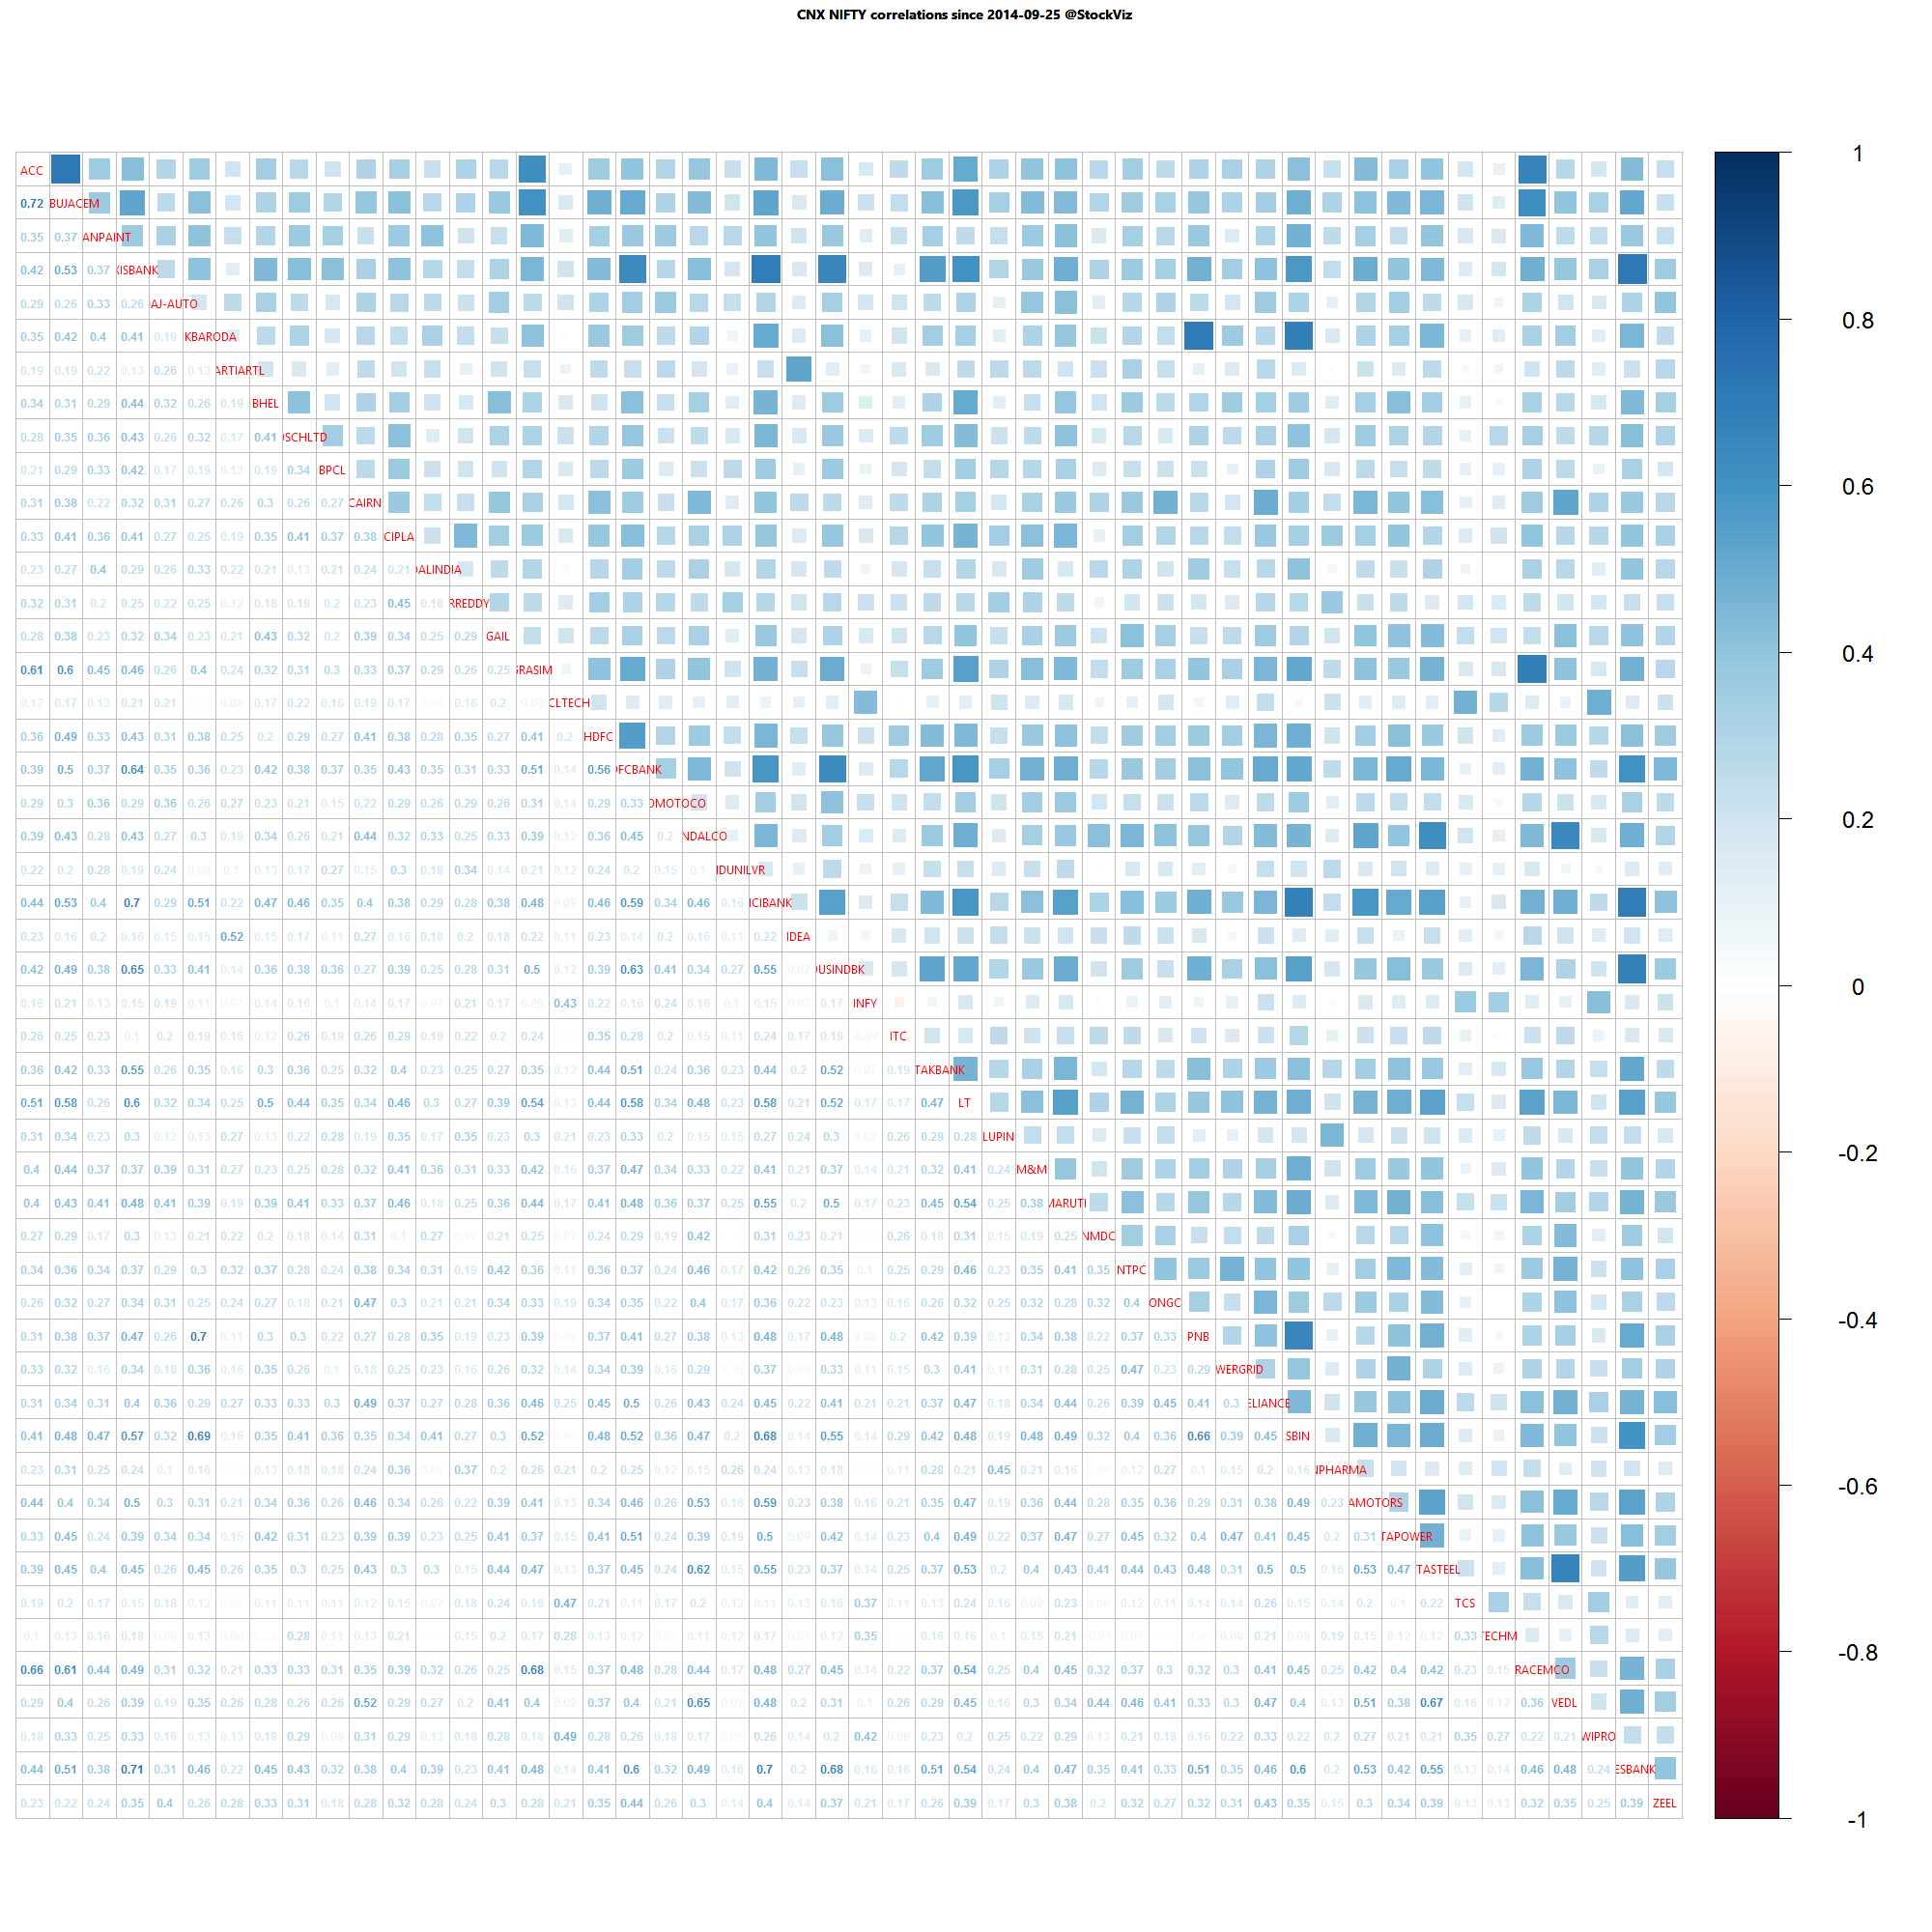
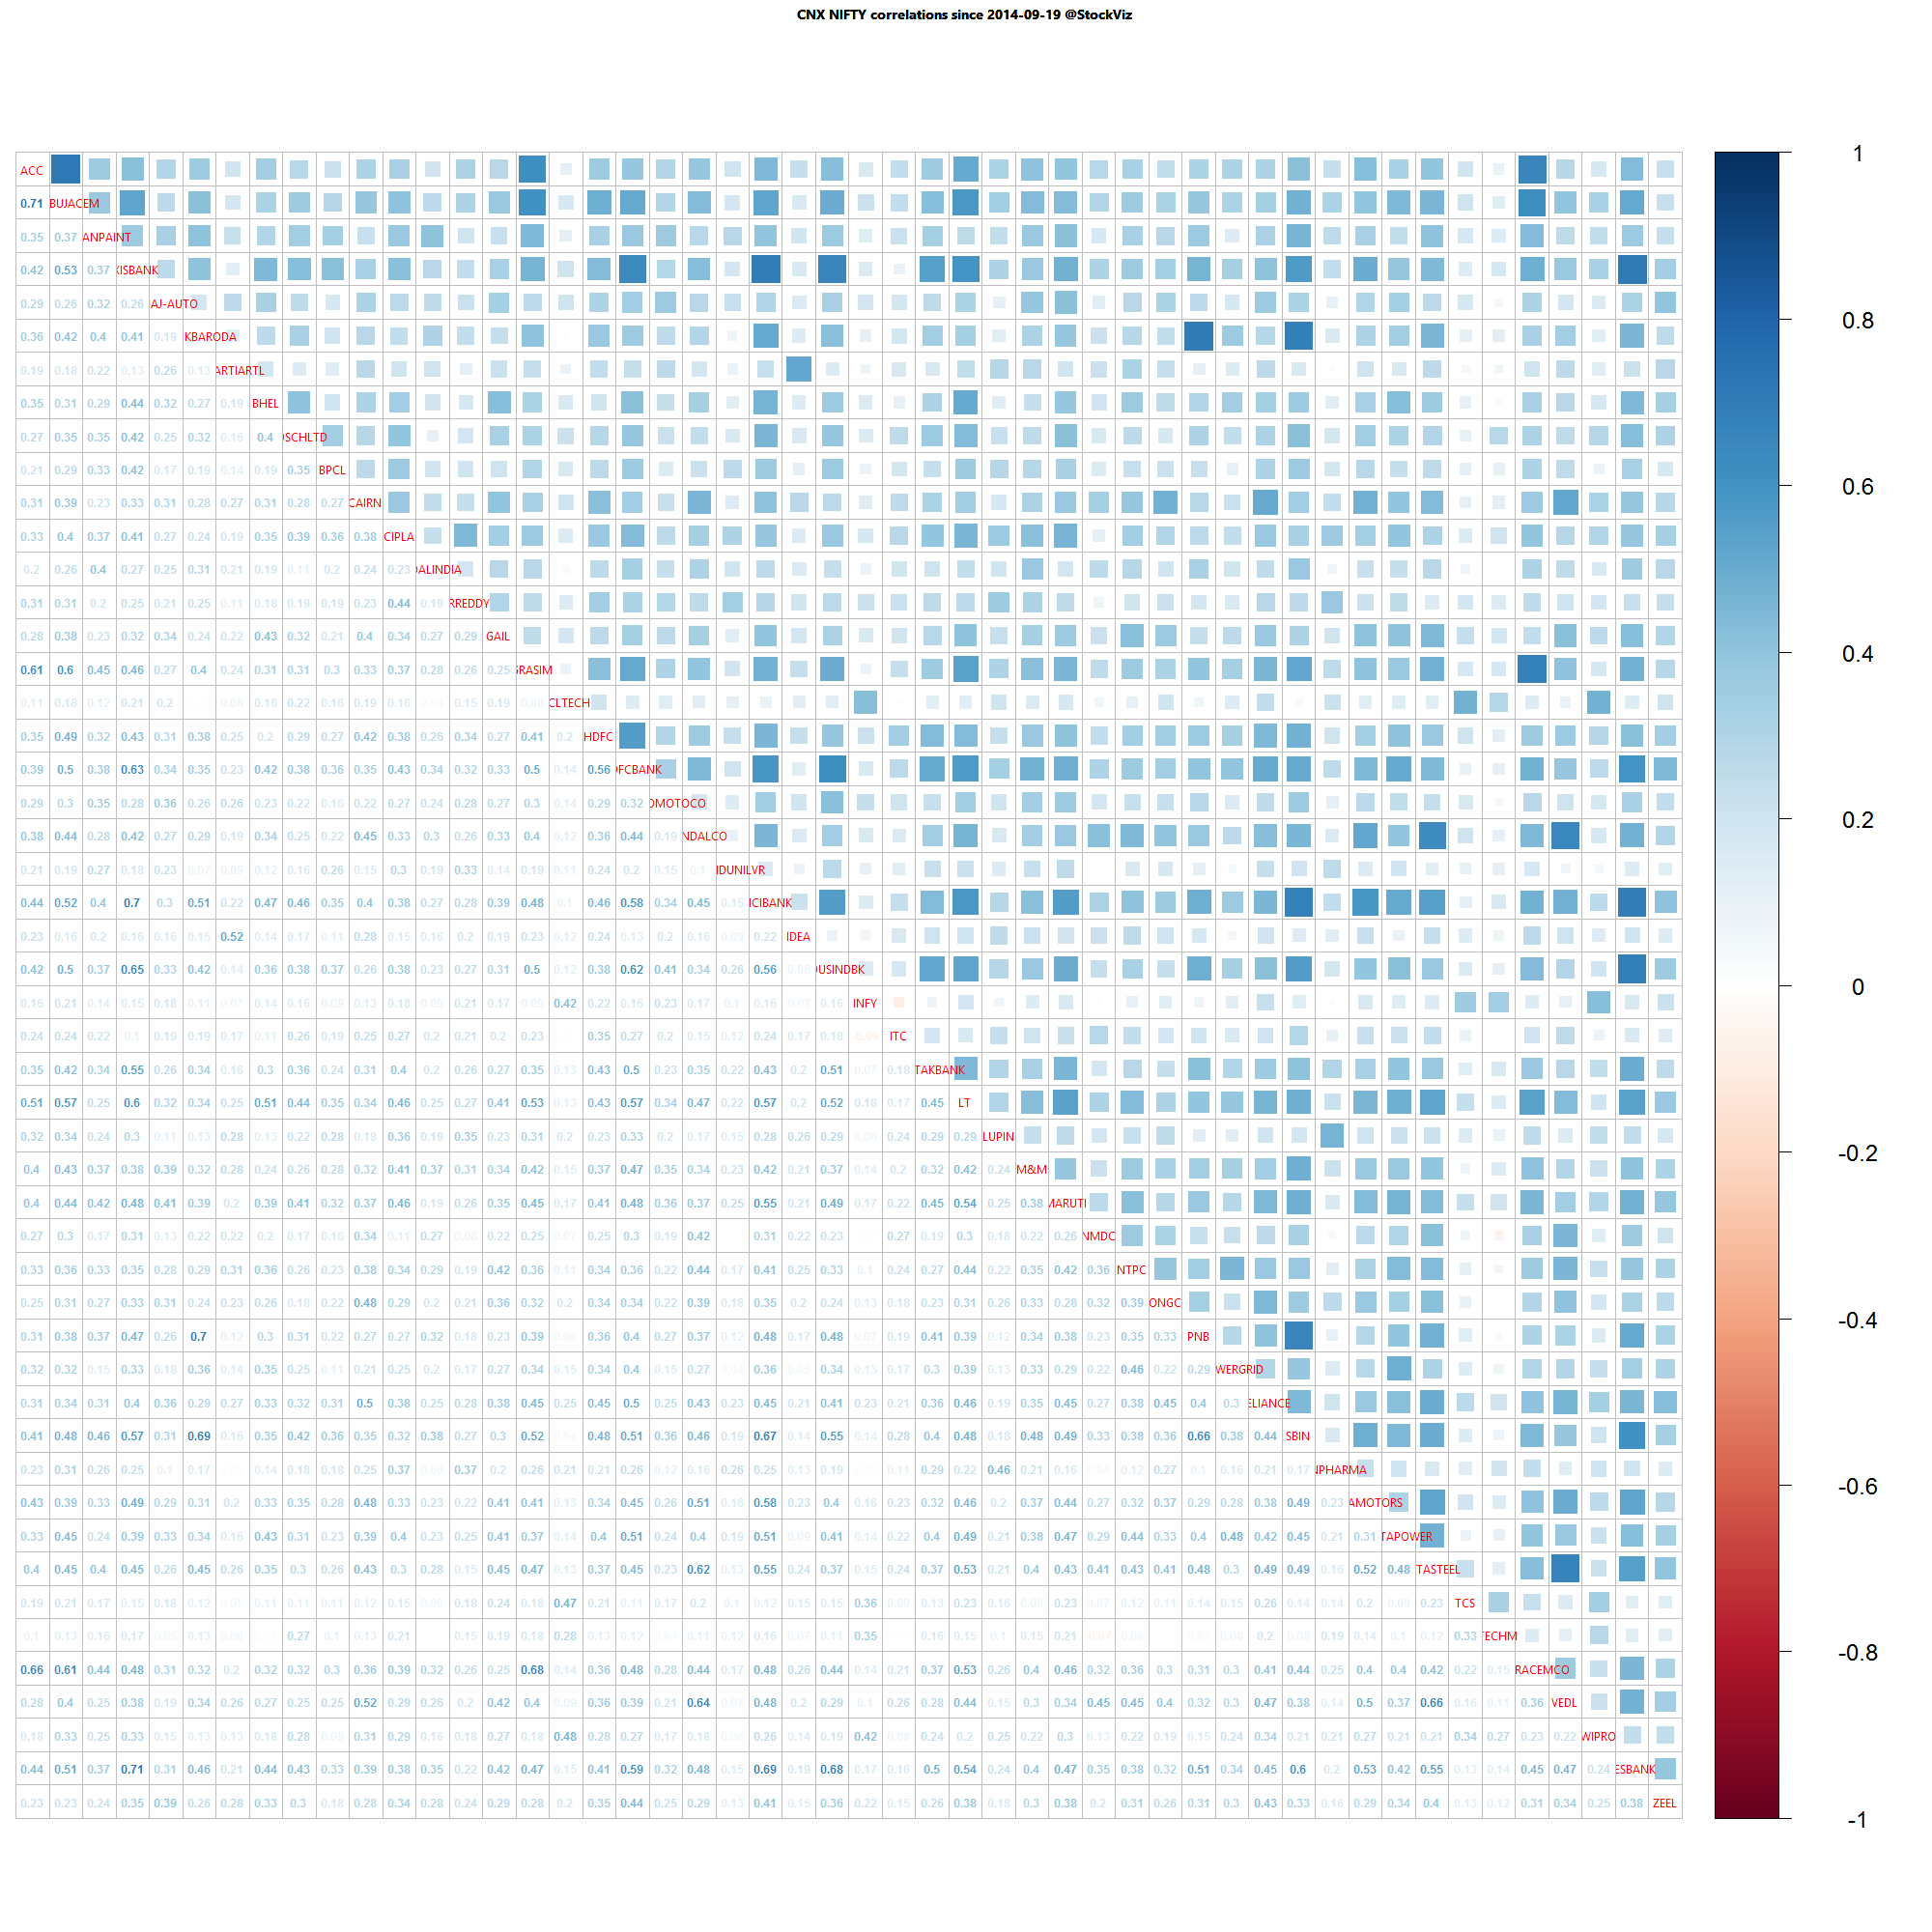
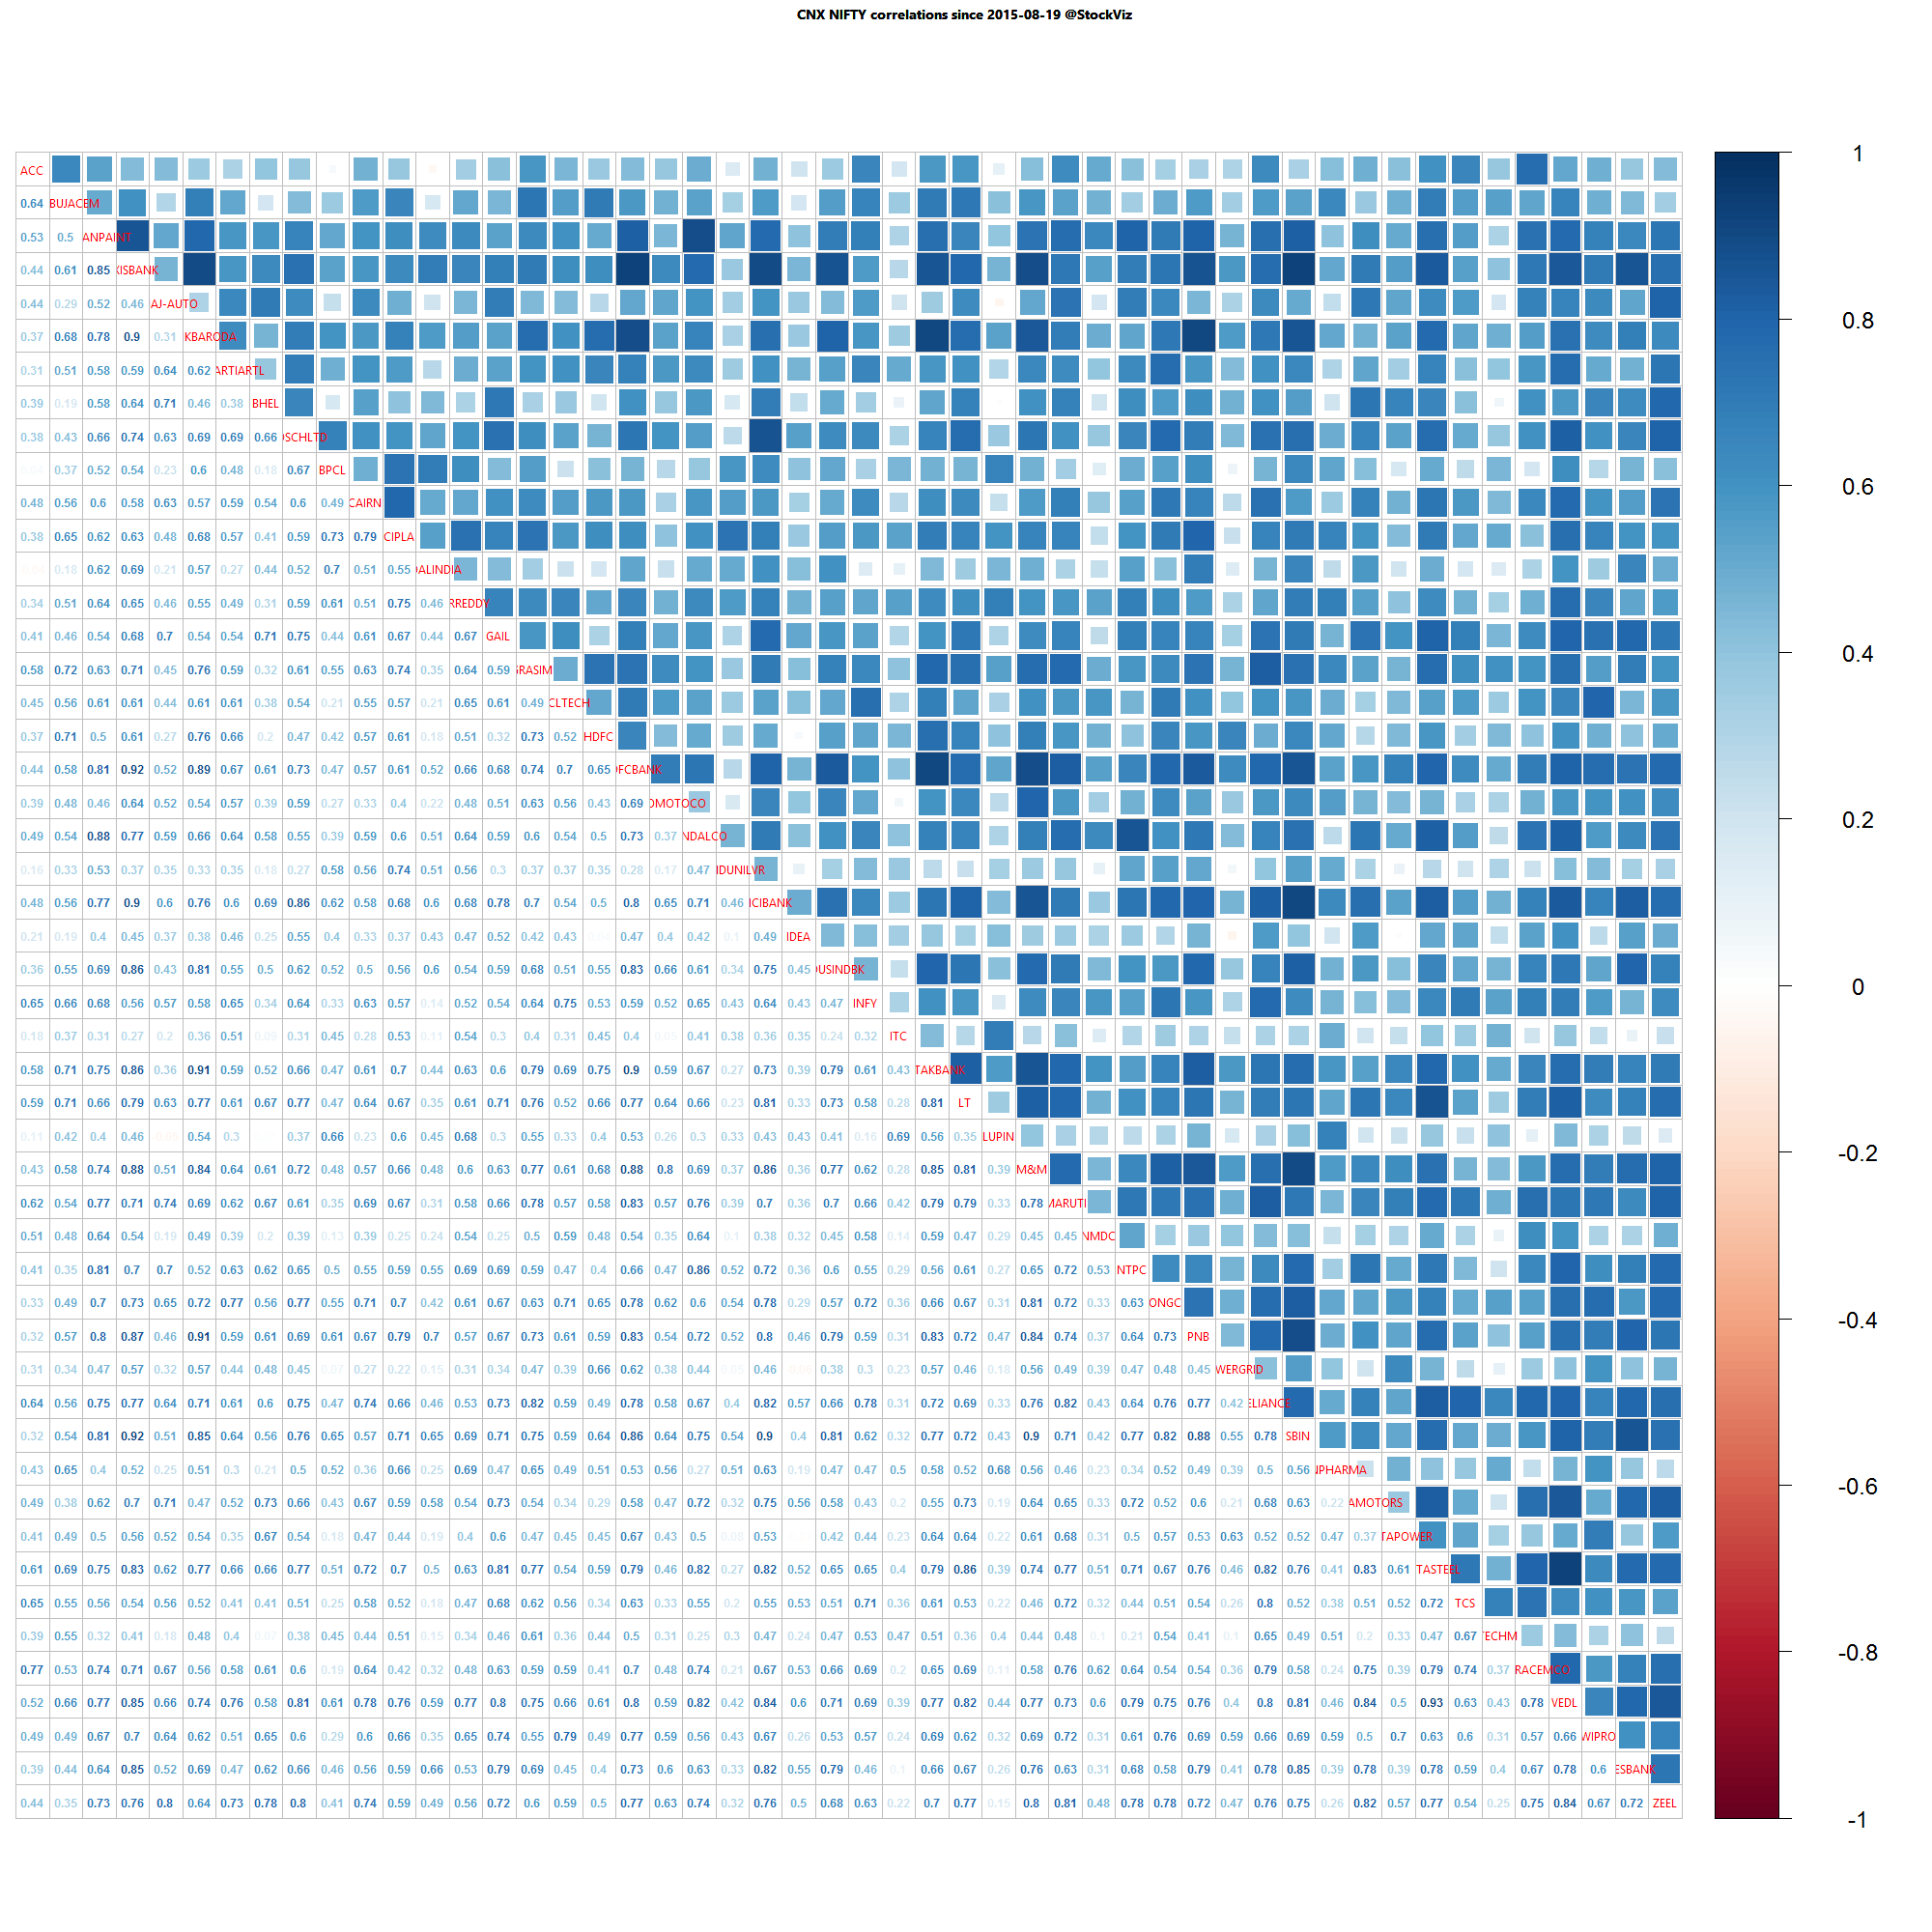
Nifty one year daily return correlations

Nifty one year daily return correlations

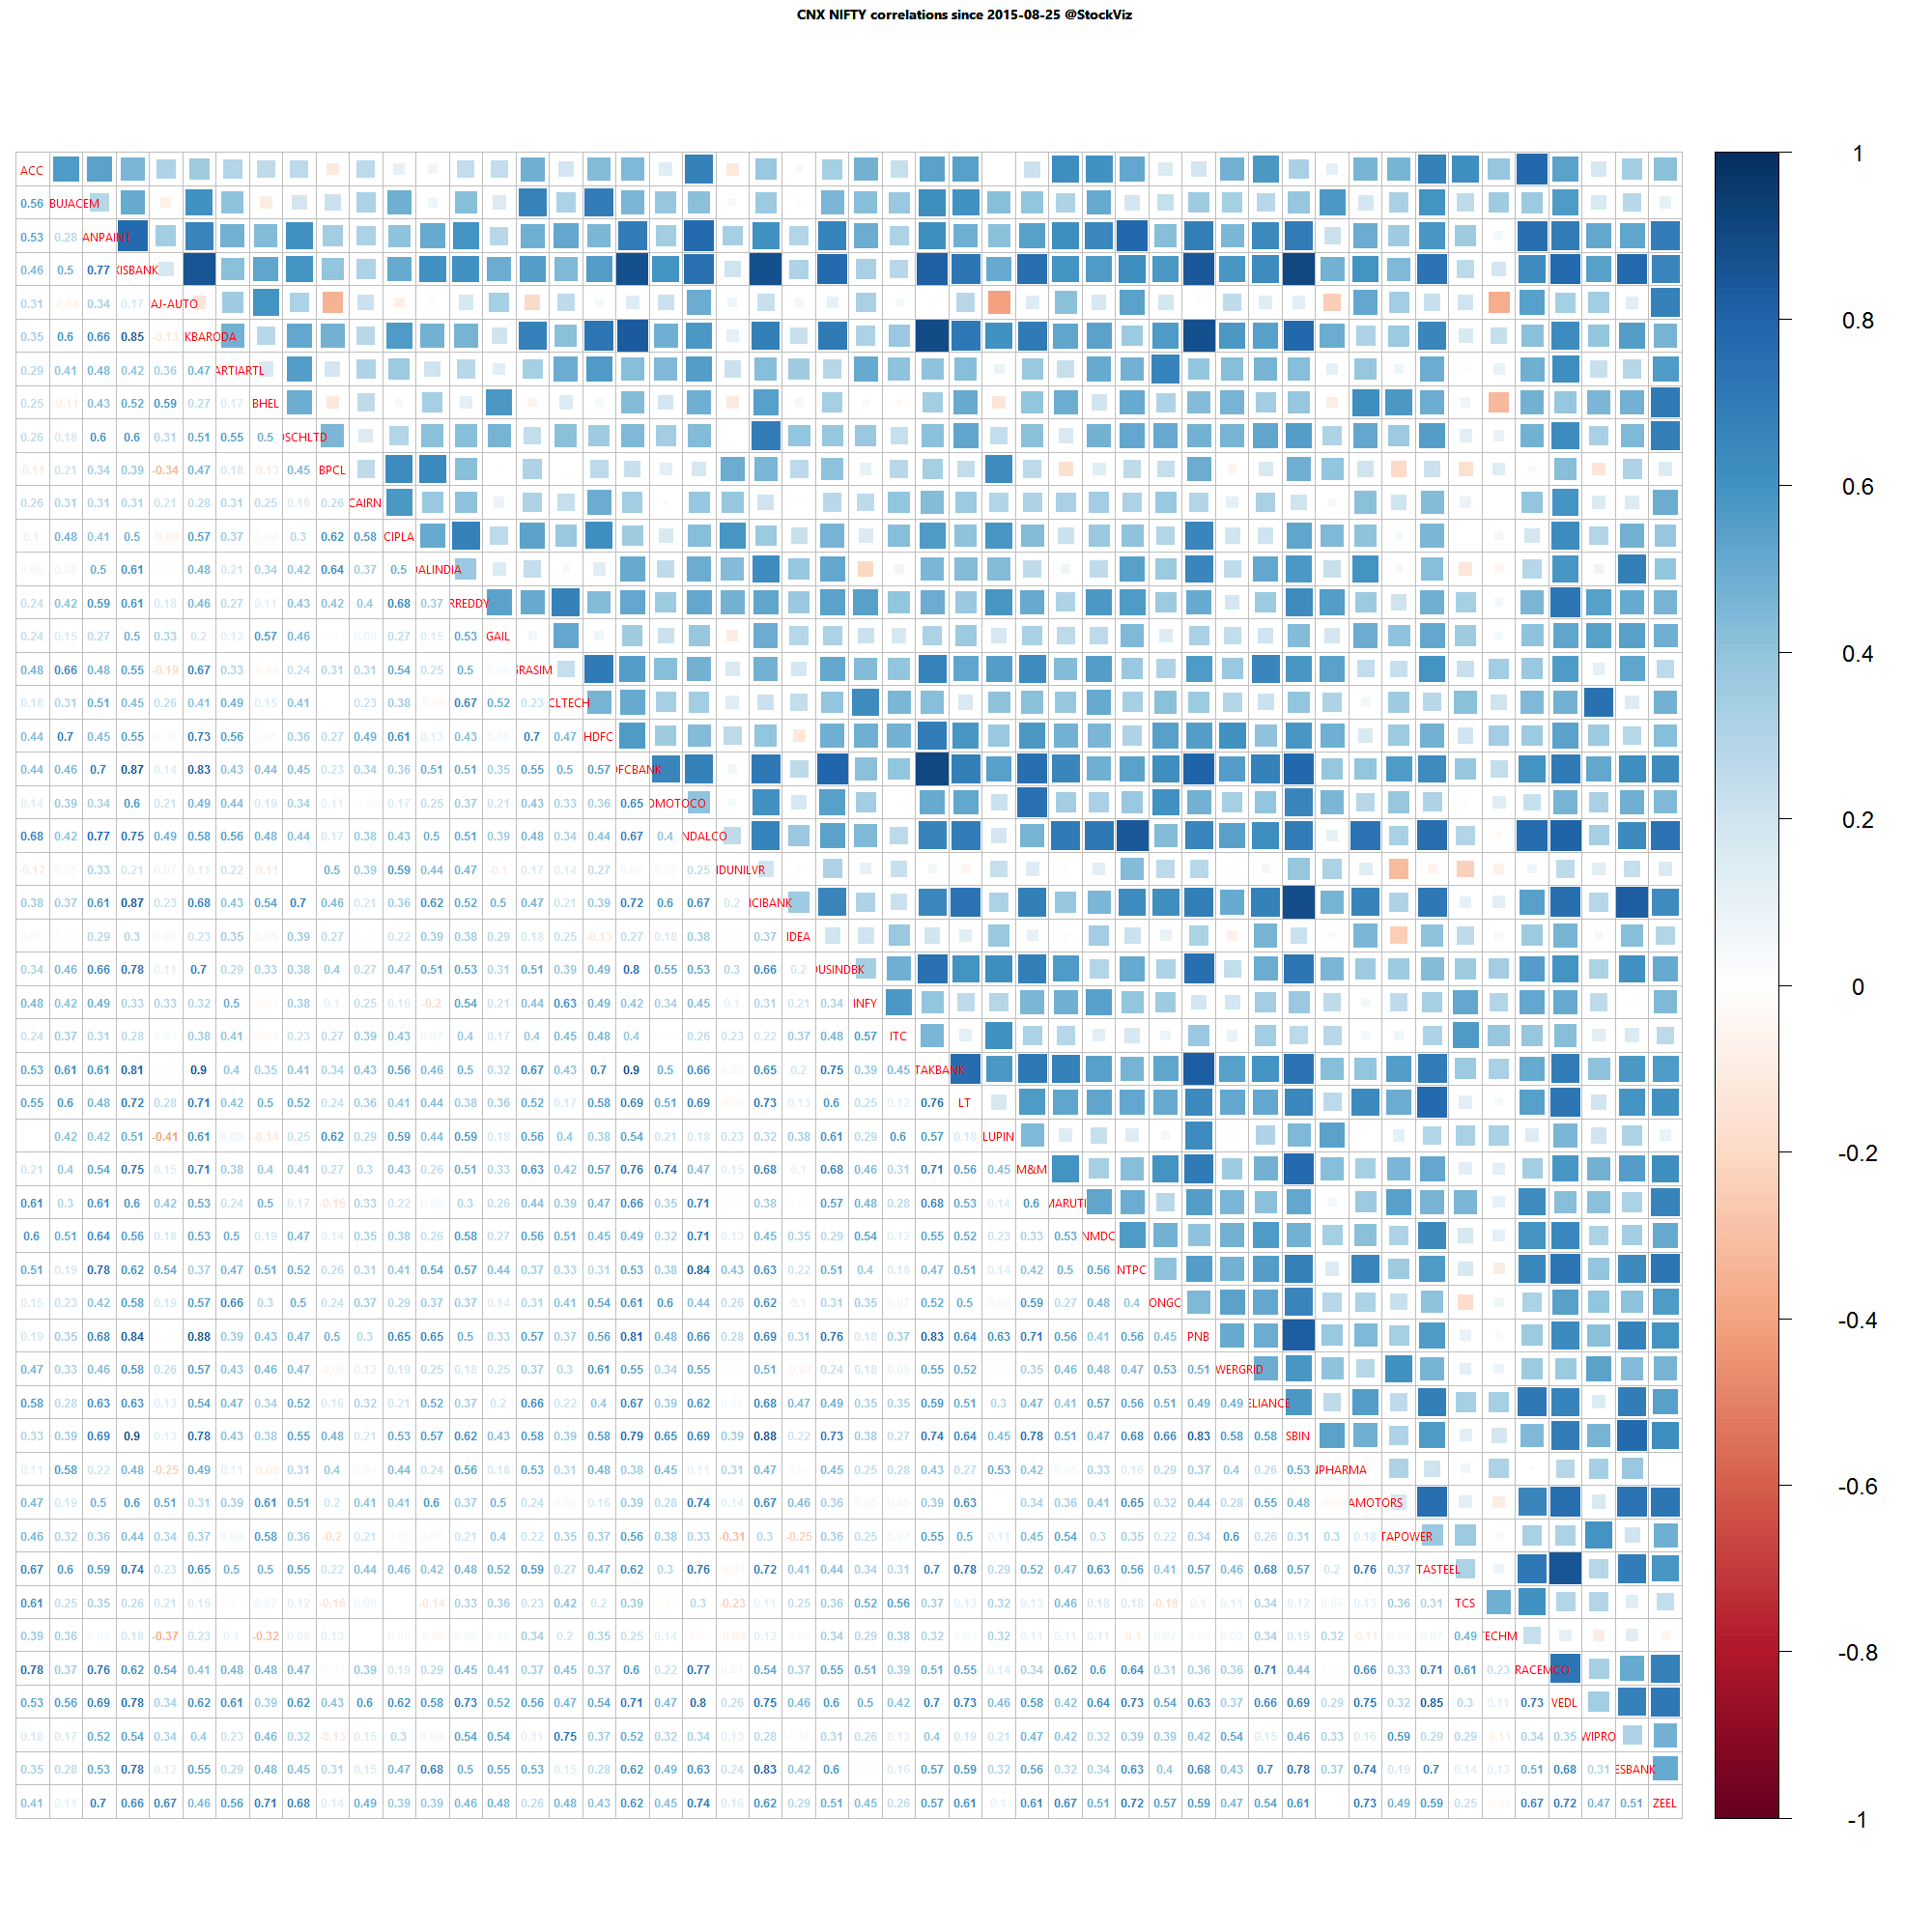
Nifty one month daily return correlations

Nifty one month daily return correlations

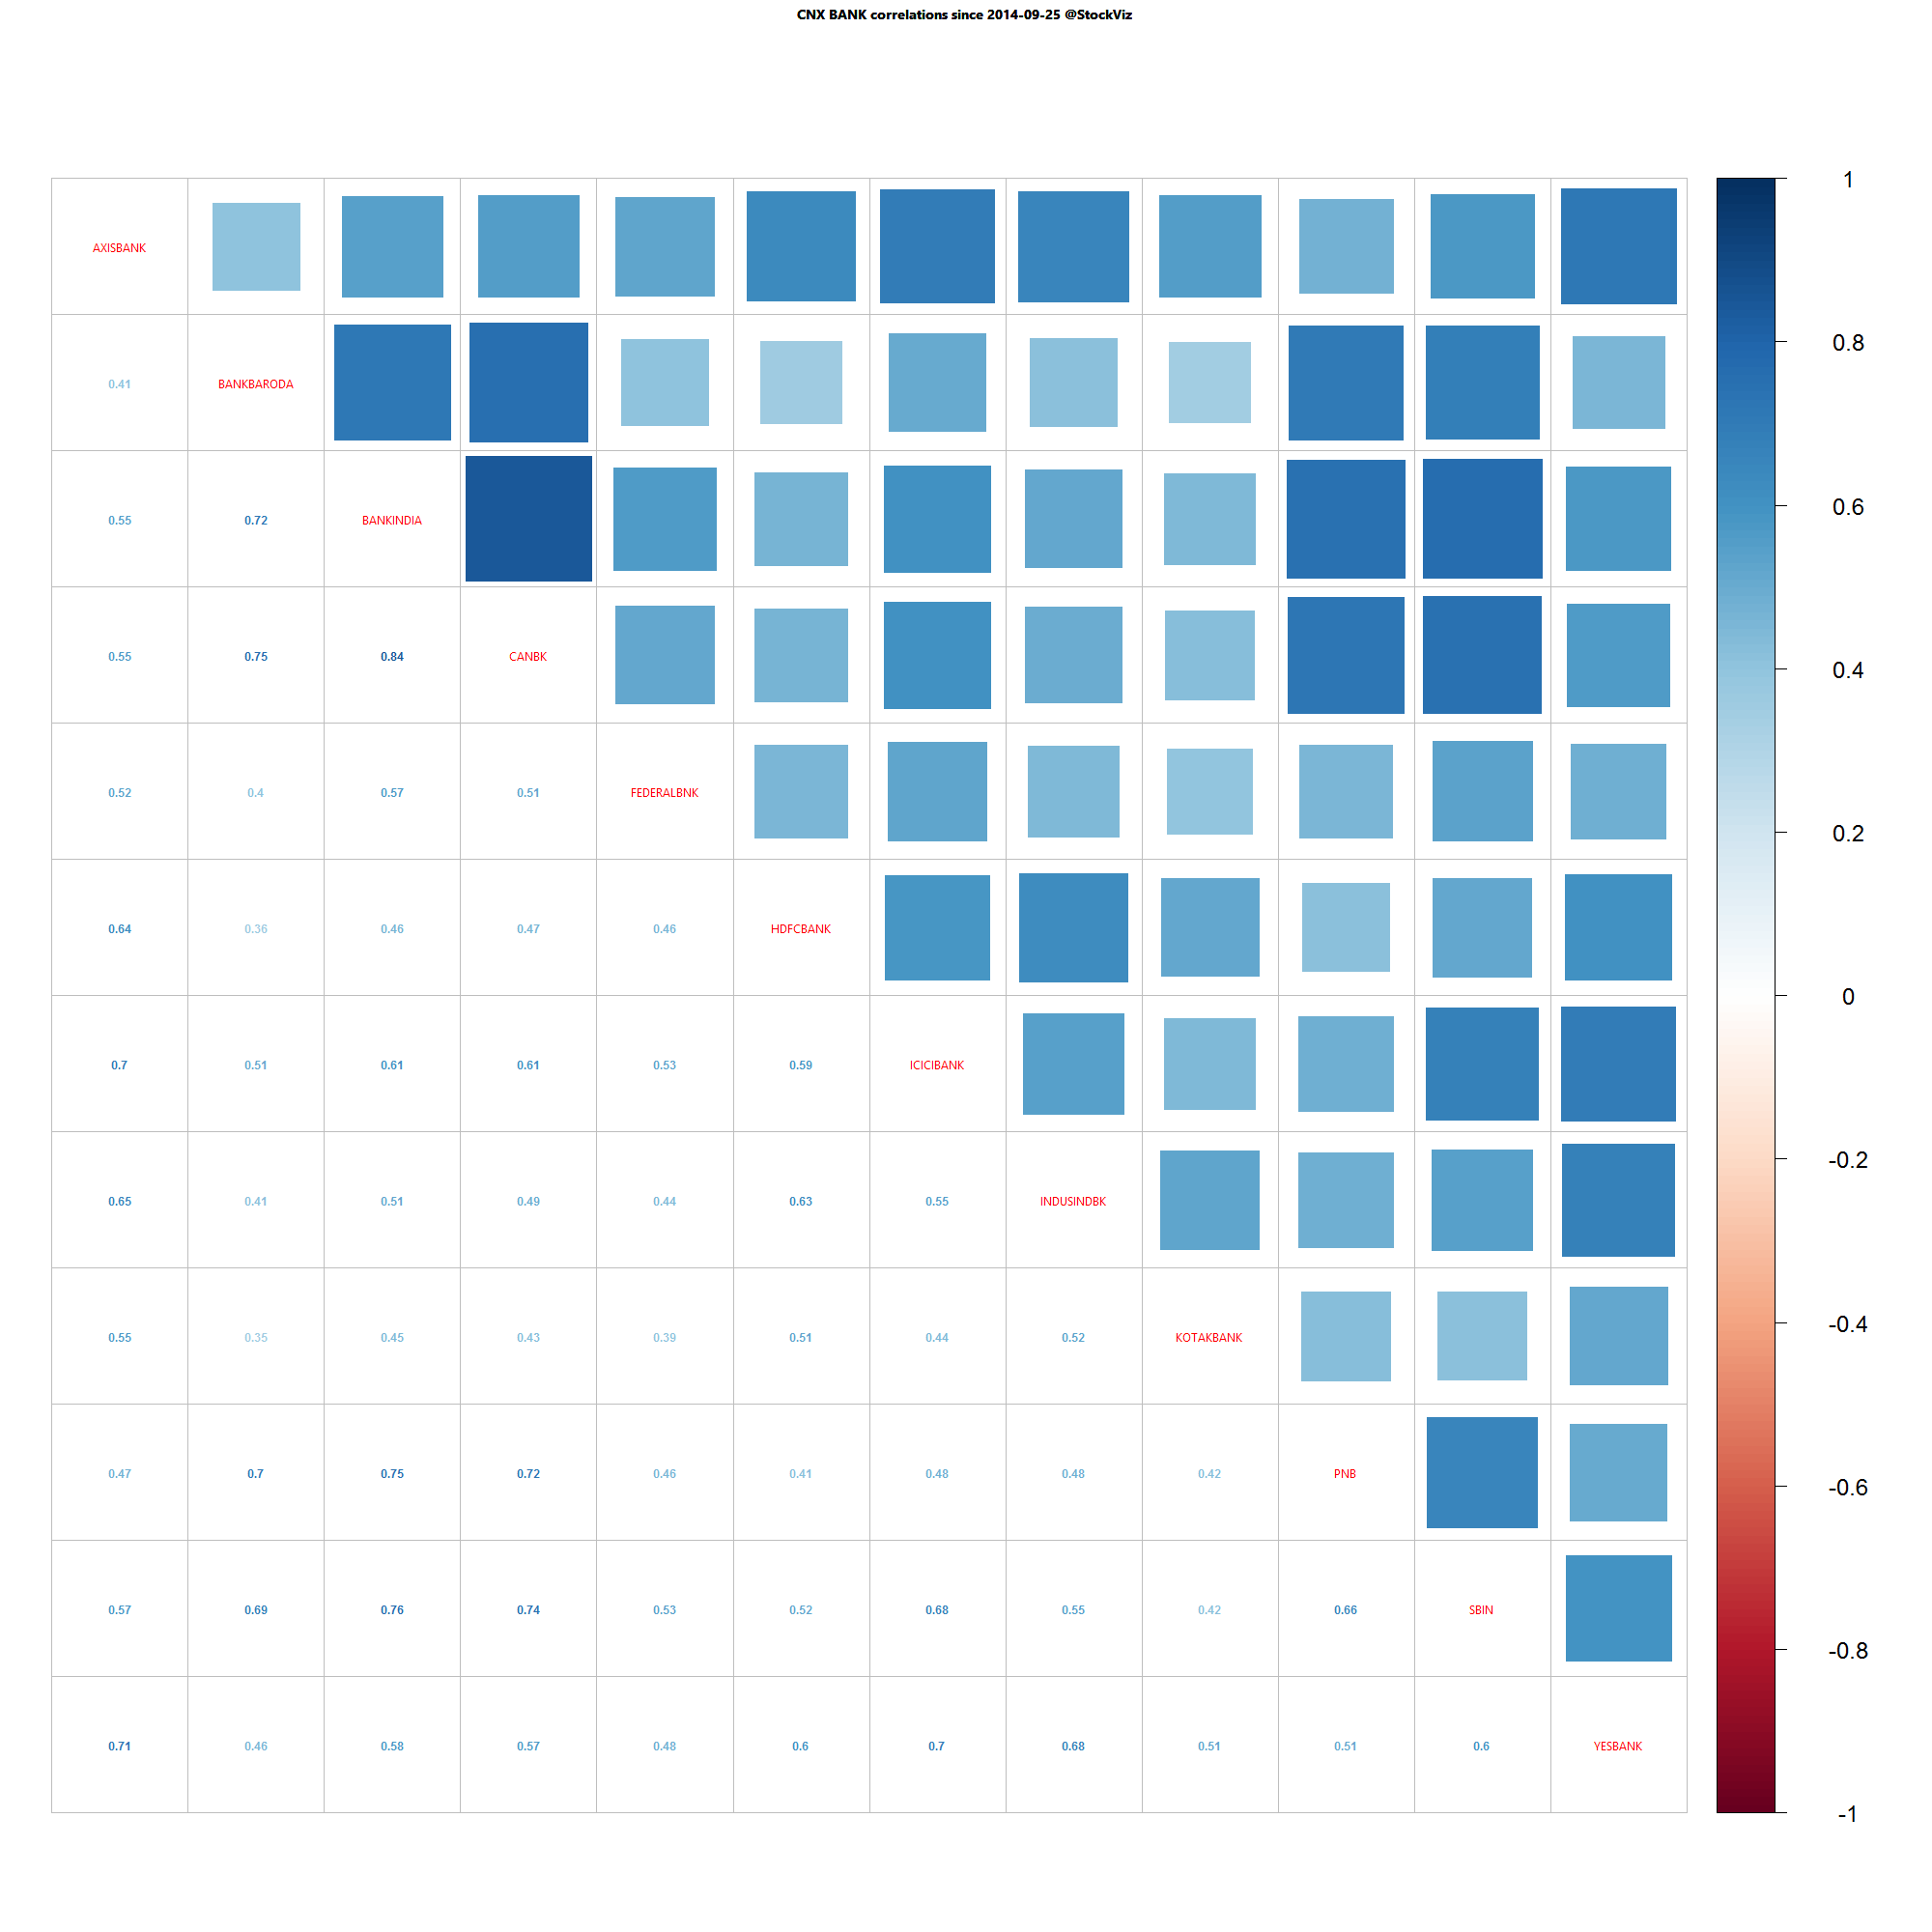
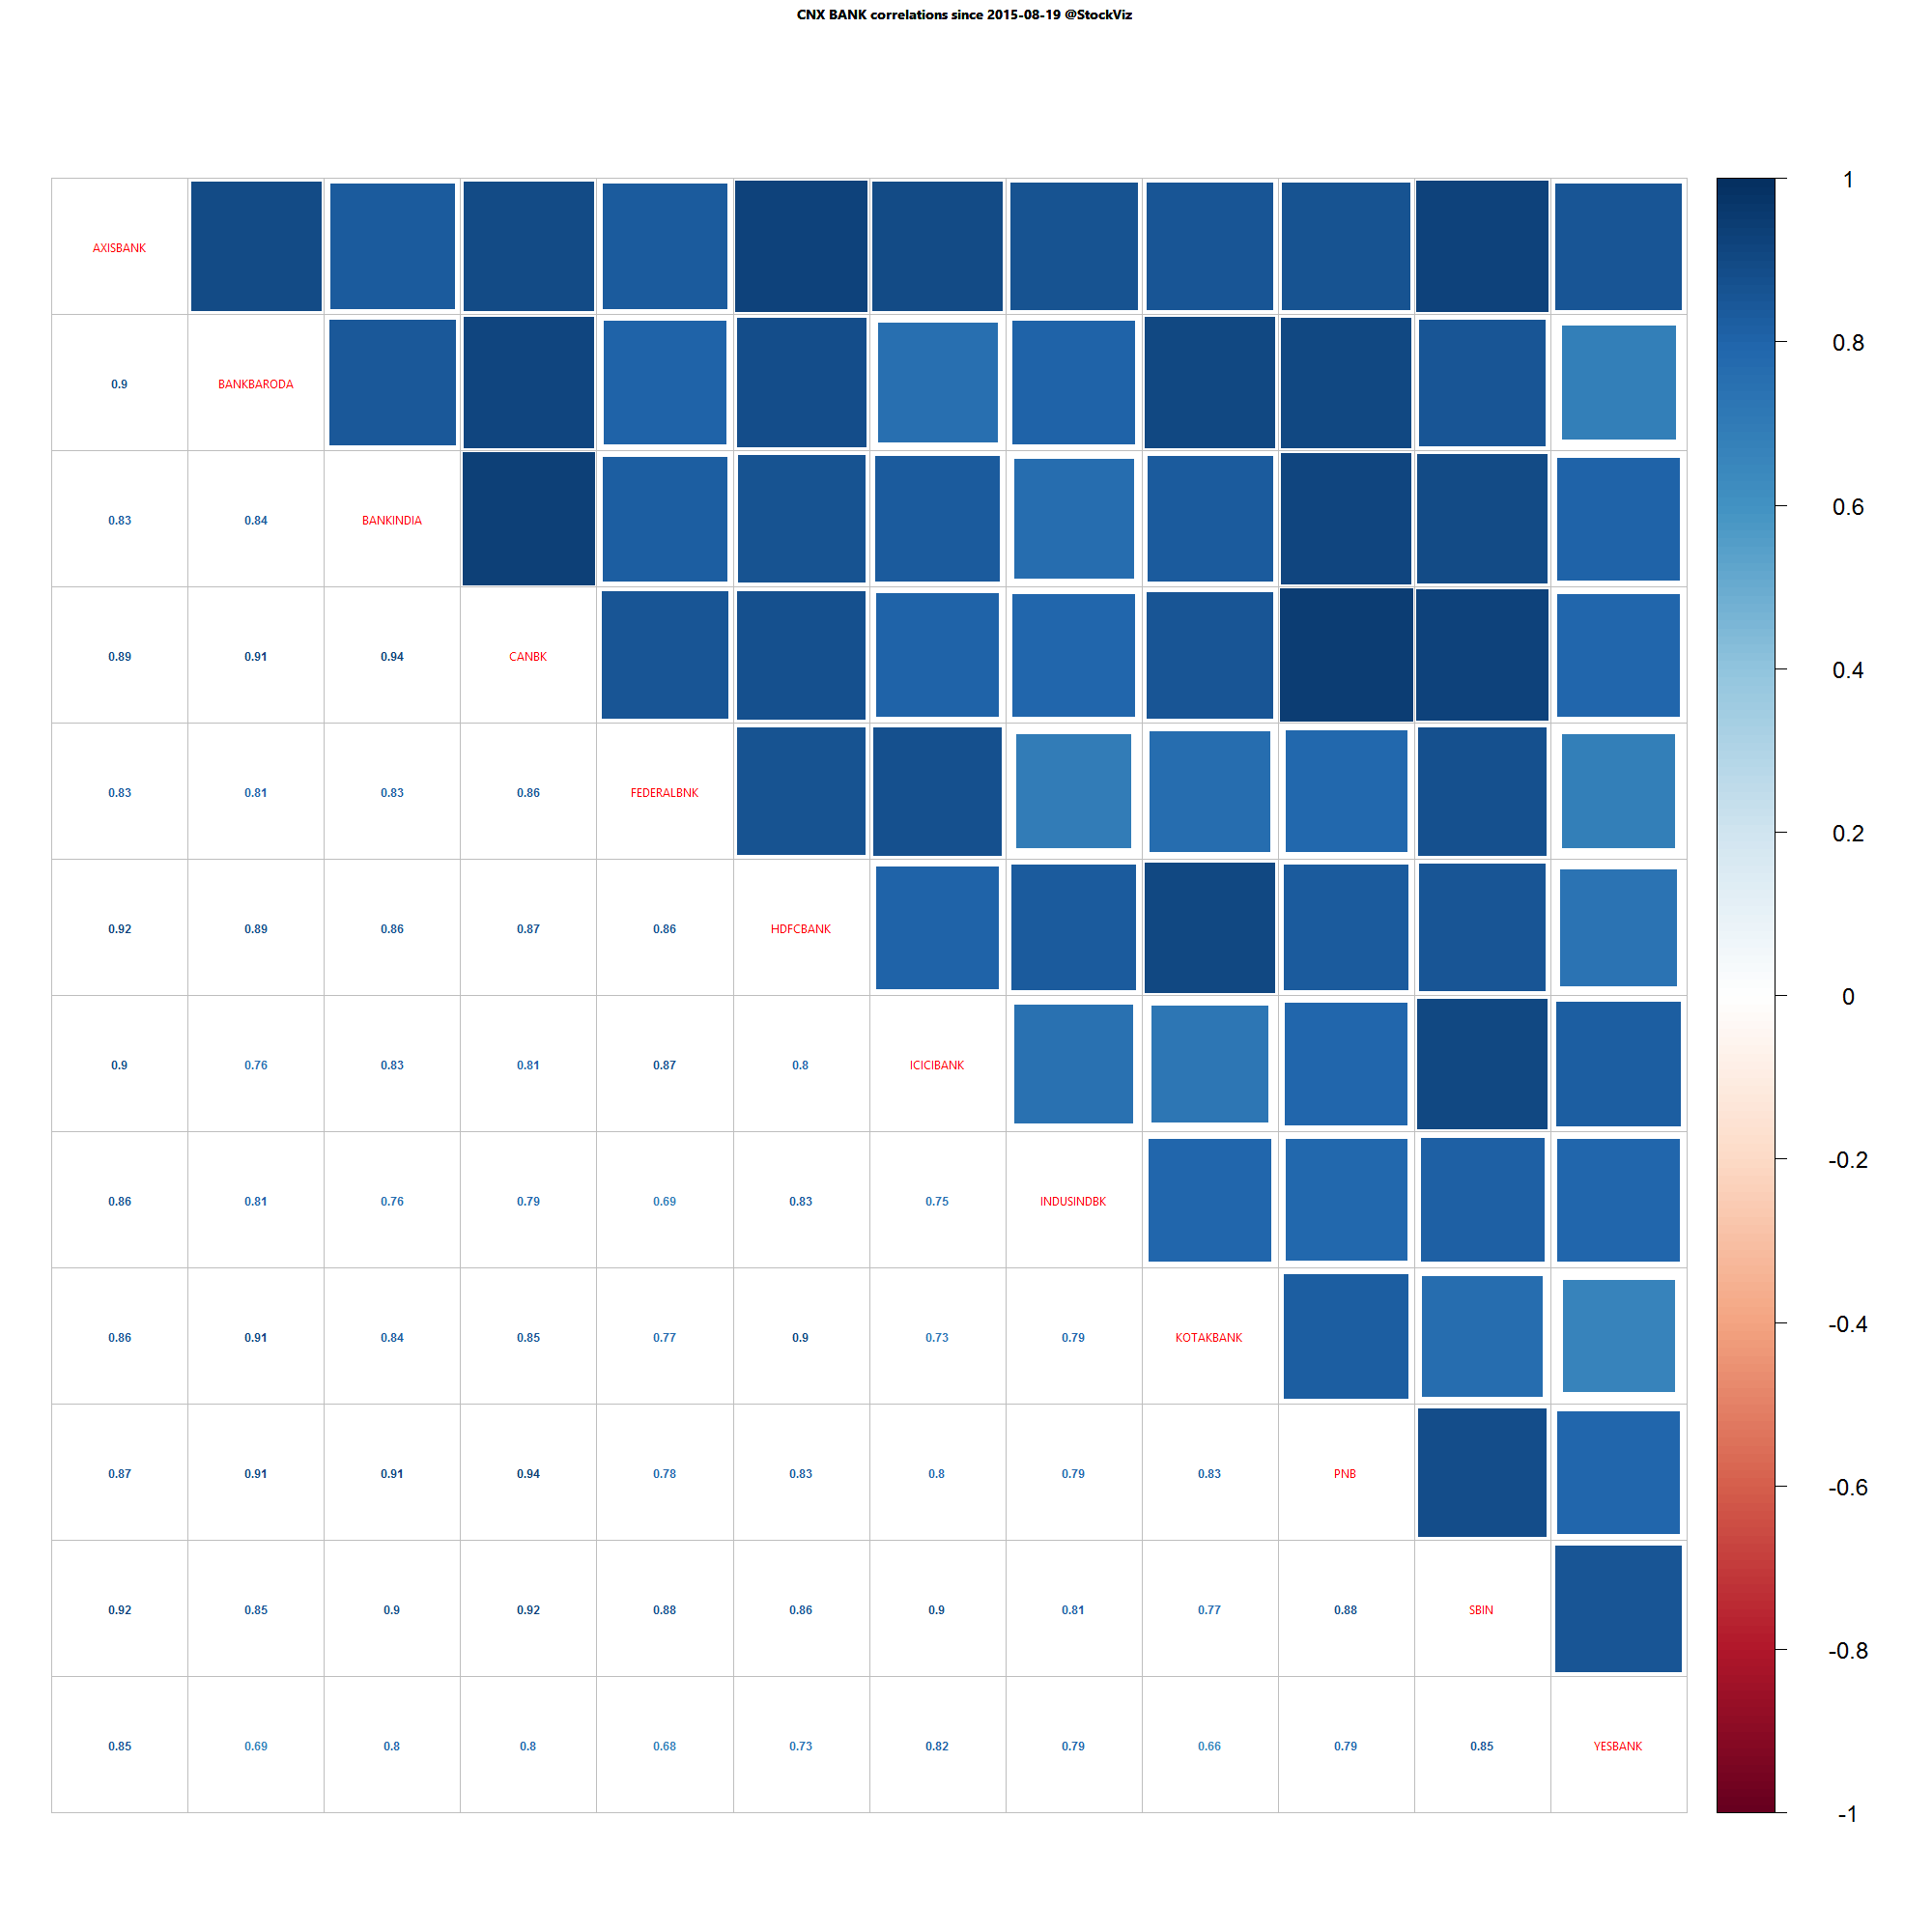
Bank Nifty one year daily return correlations

Bank Nifty one year daily return correlations

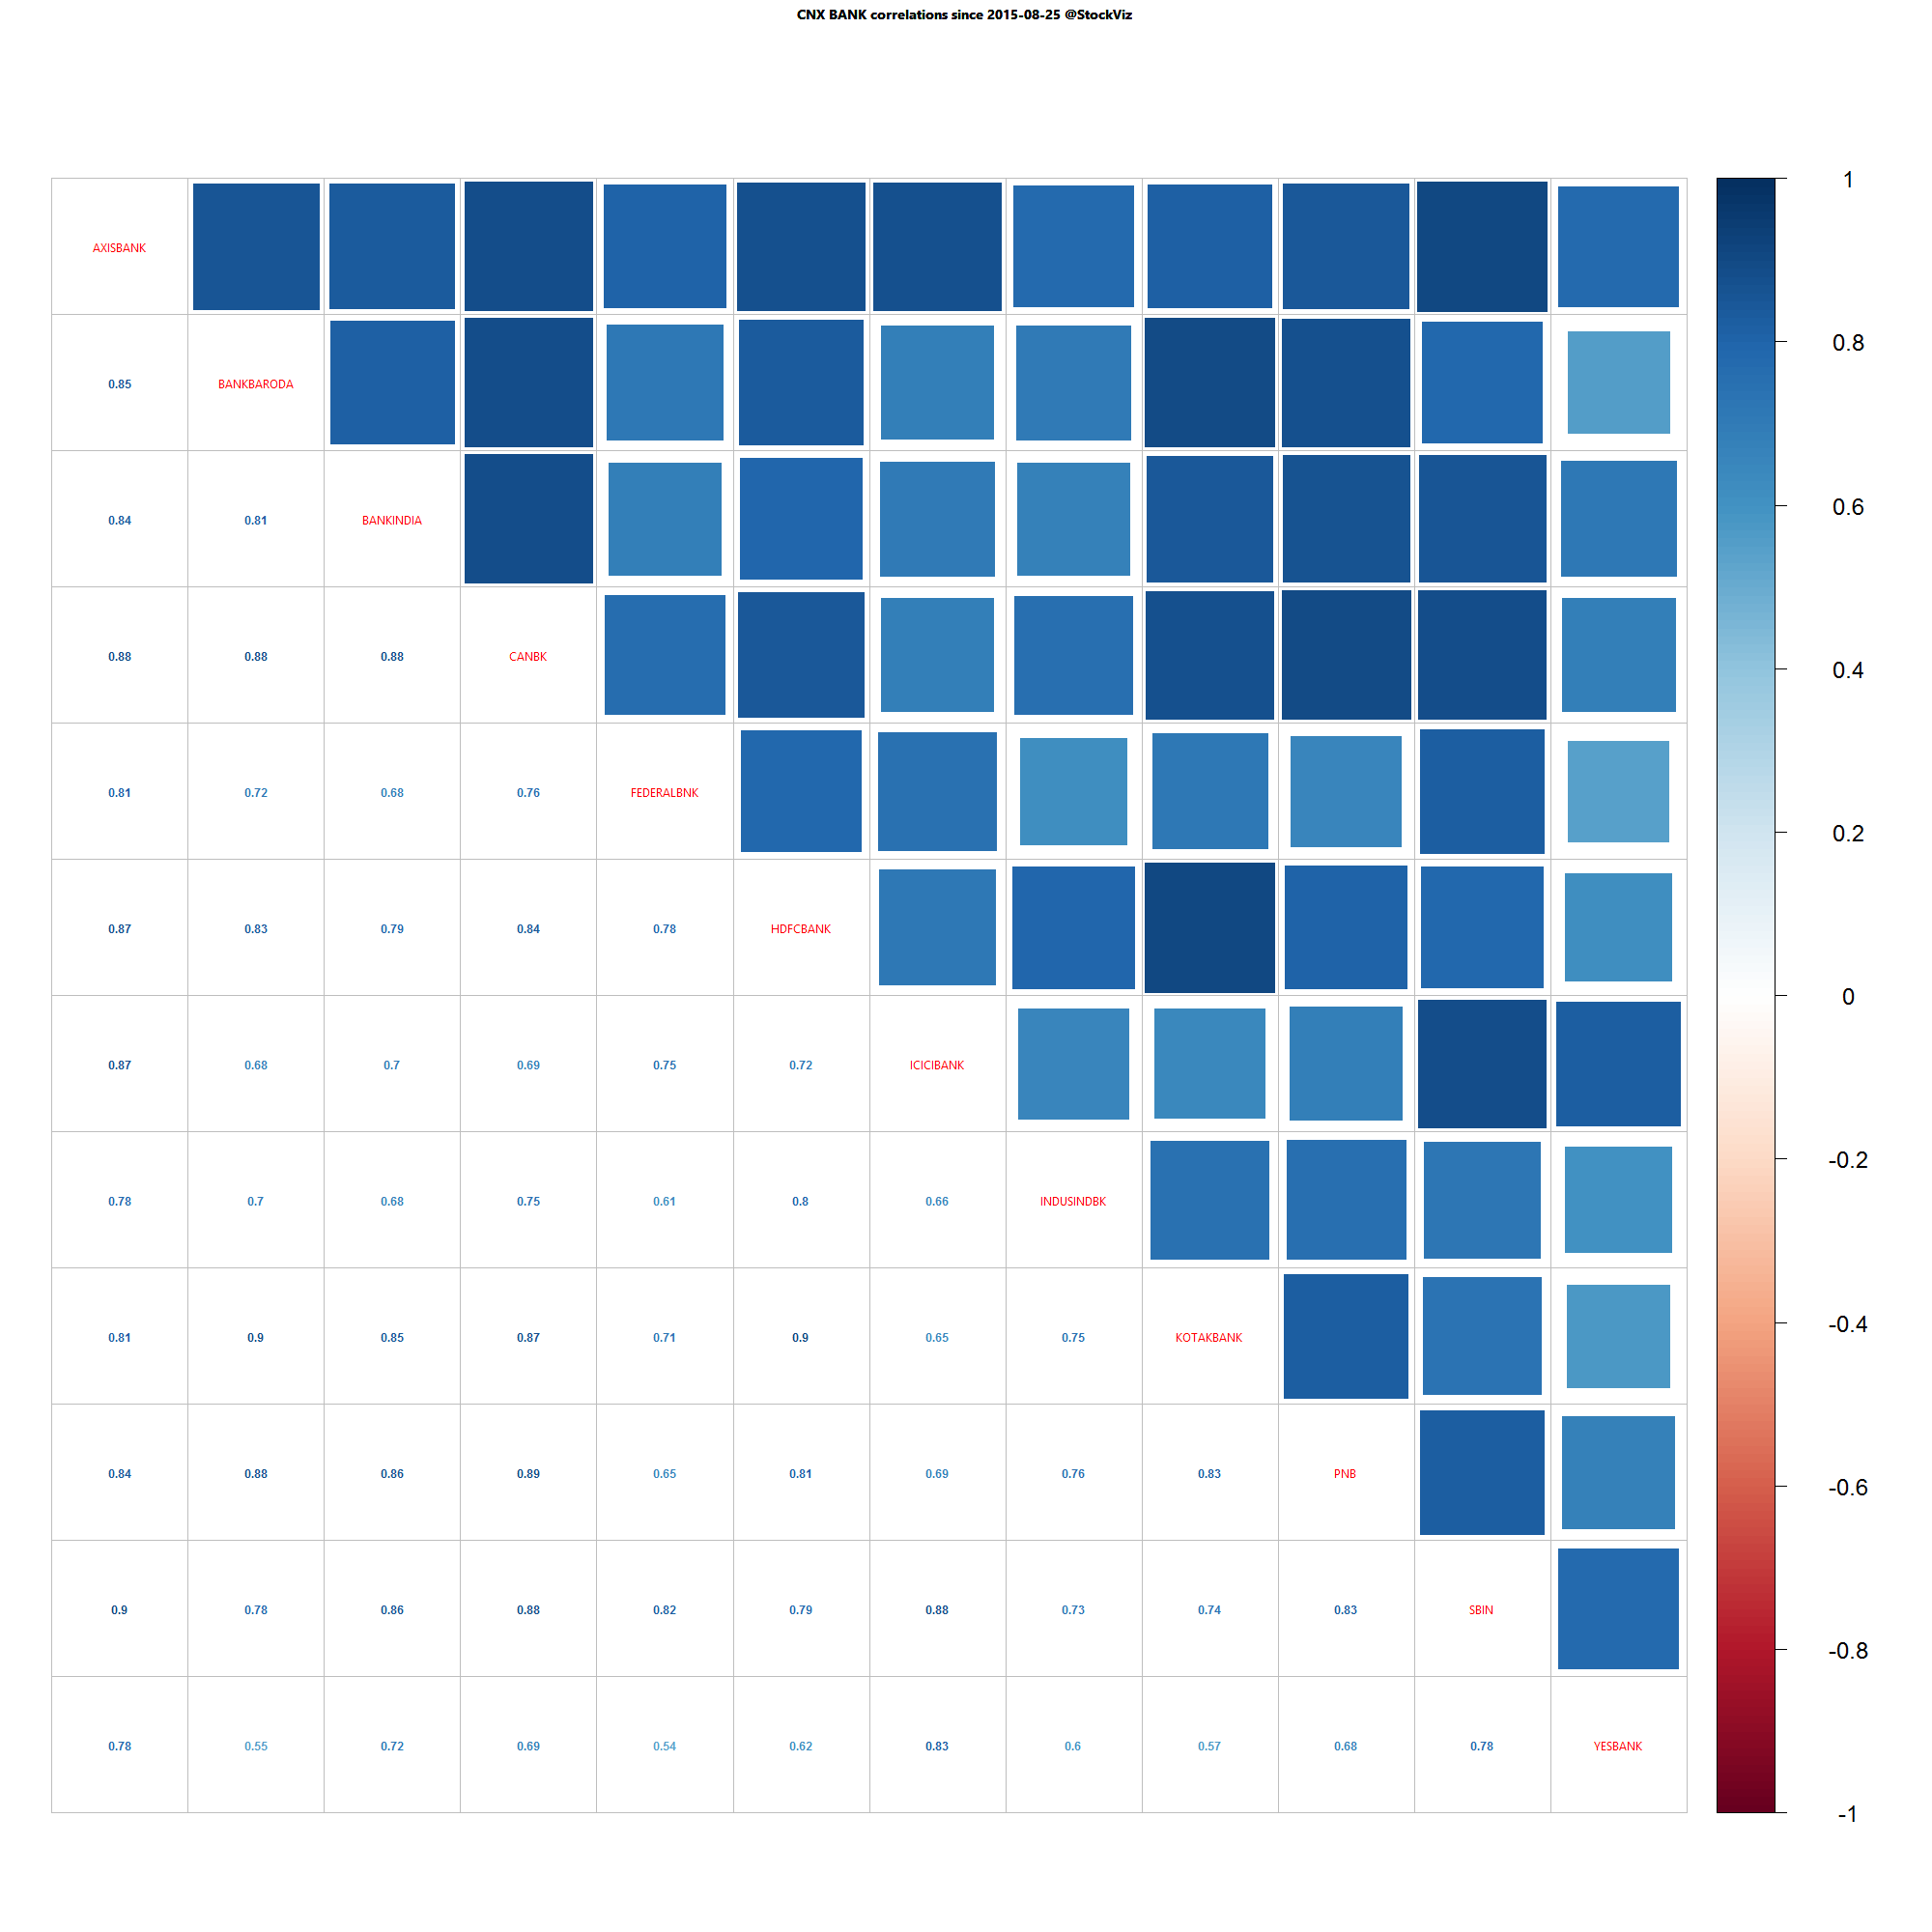
Bank Nifty one month daily return correlations

Bank Nifty one month daily return correlations

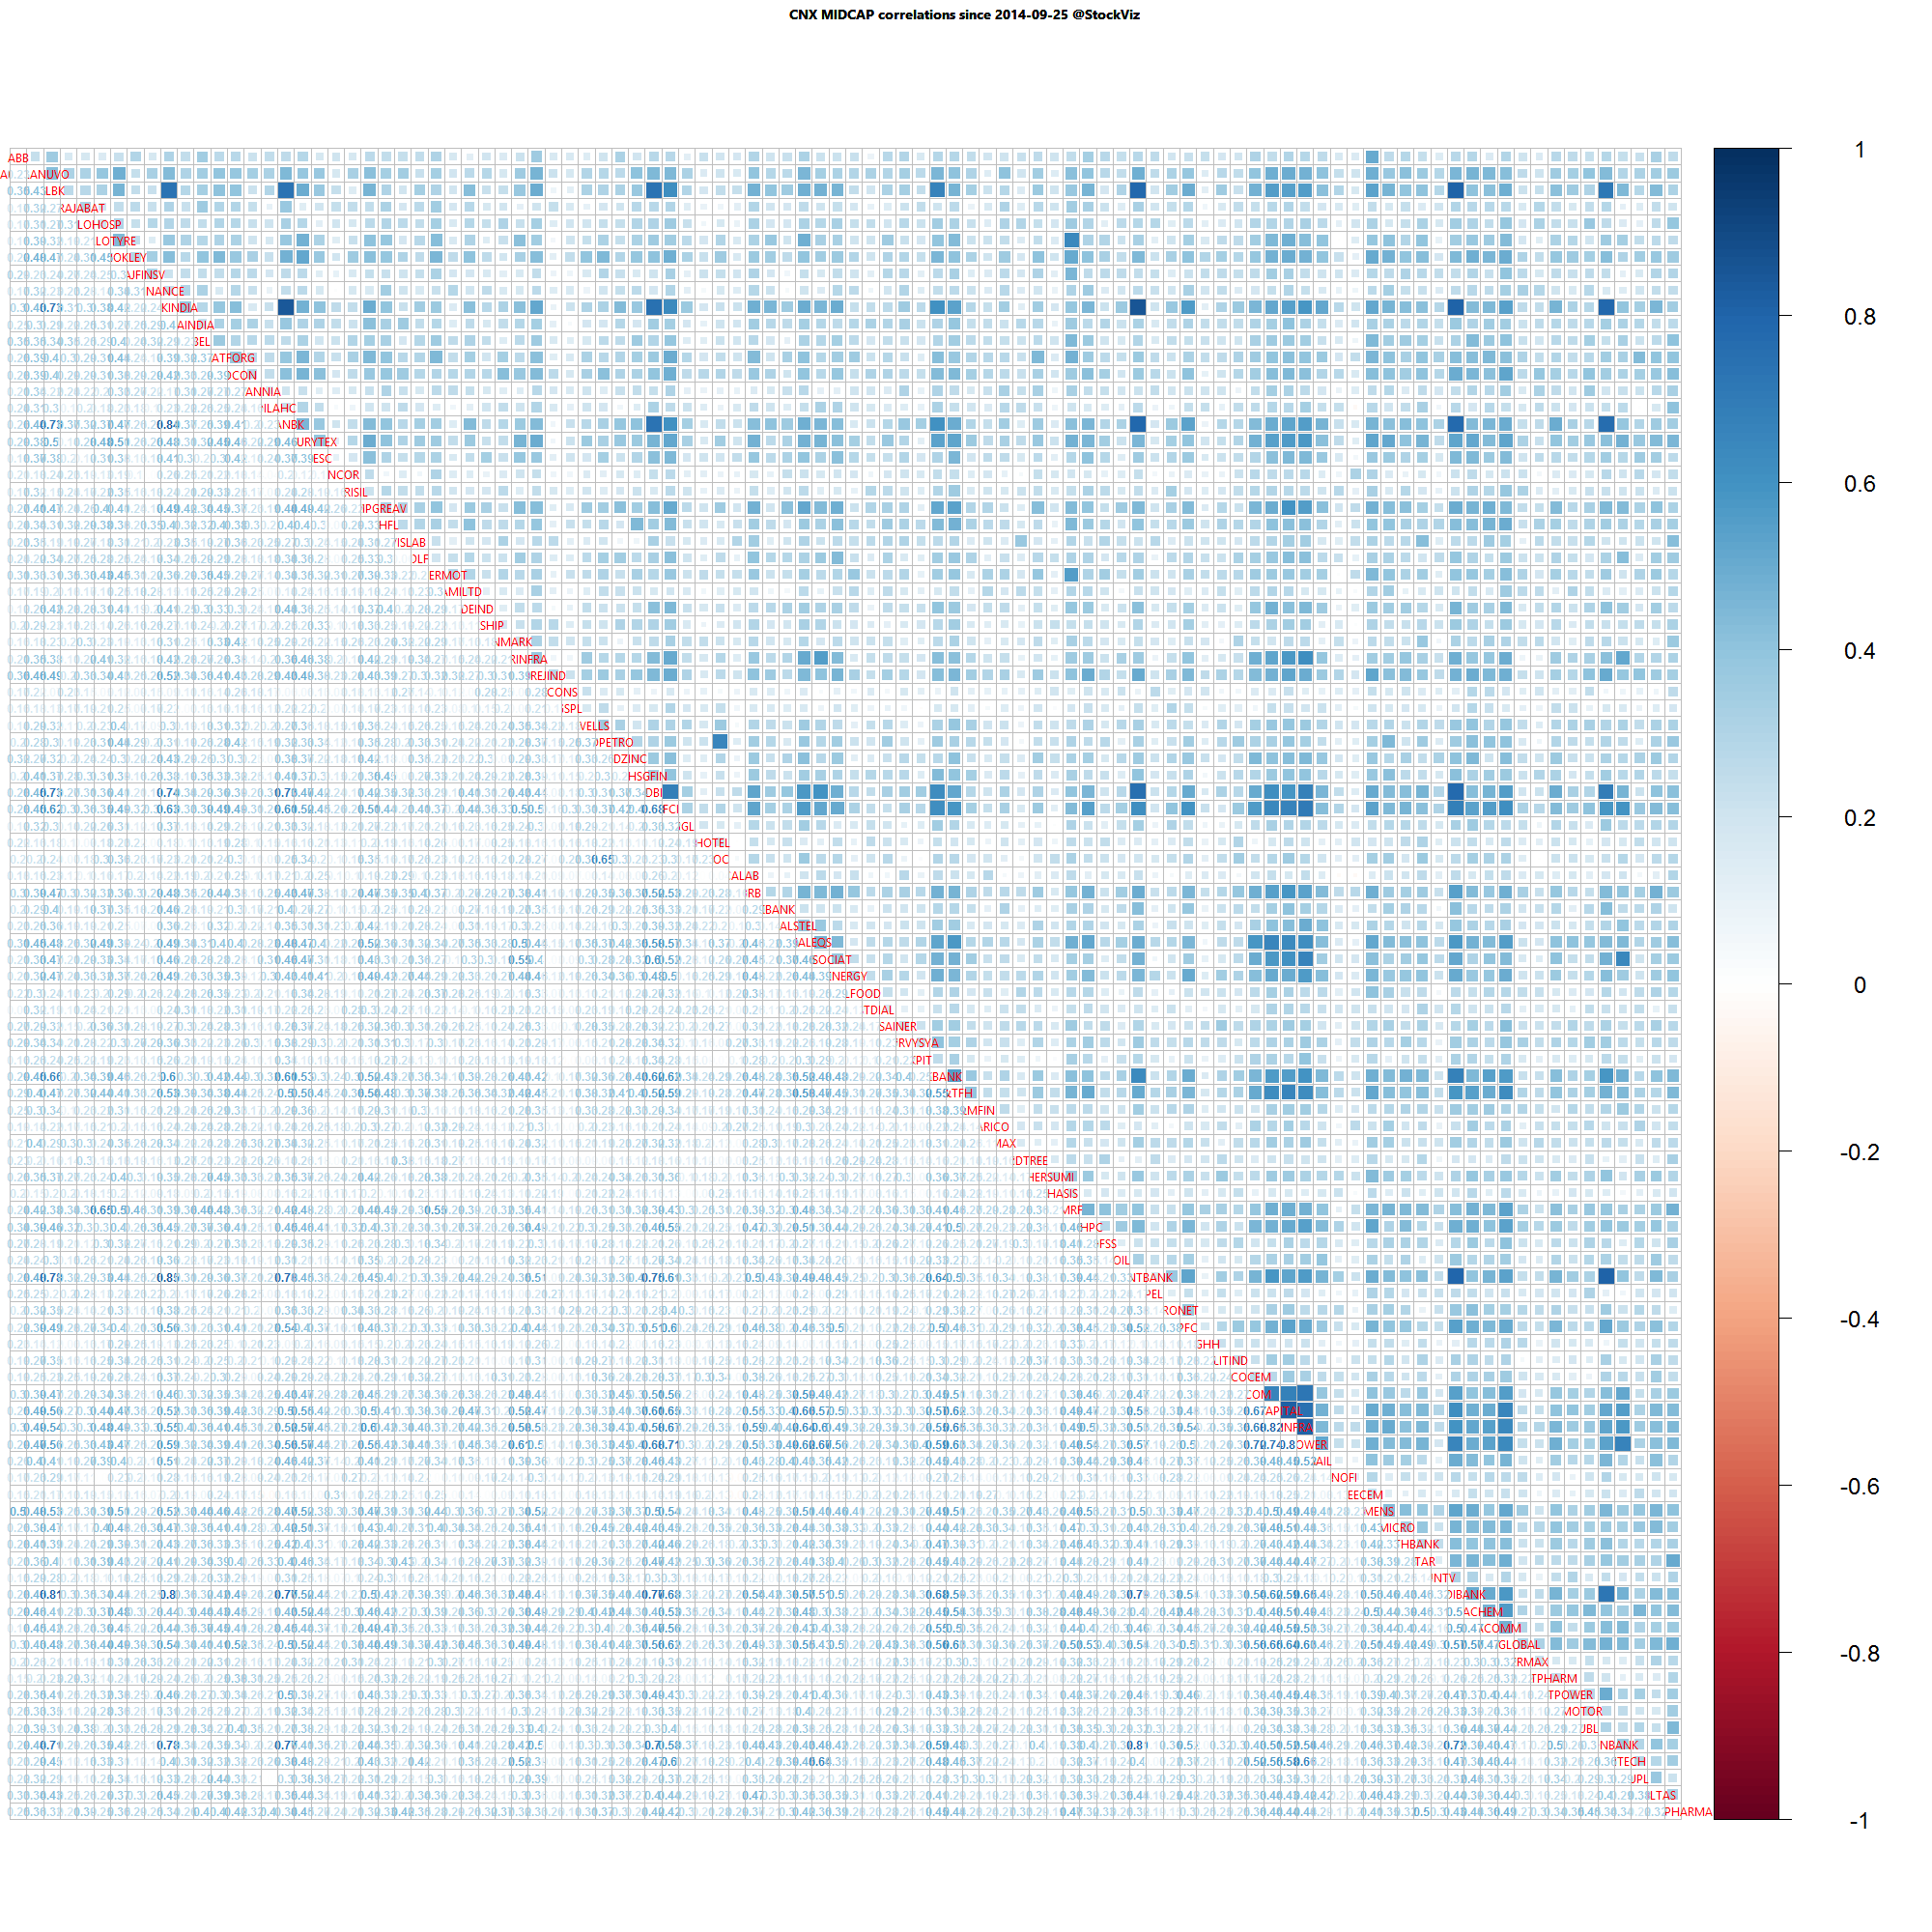
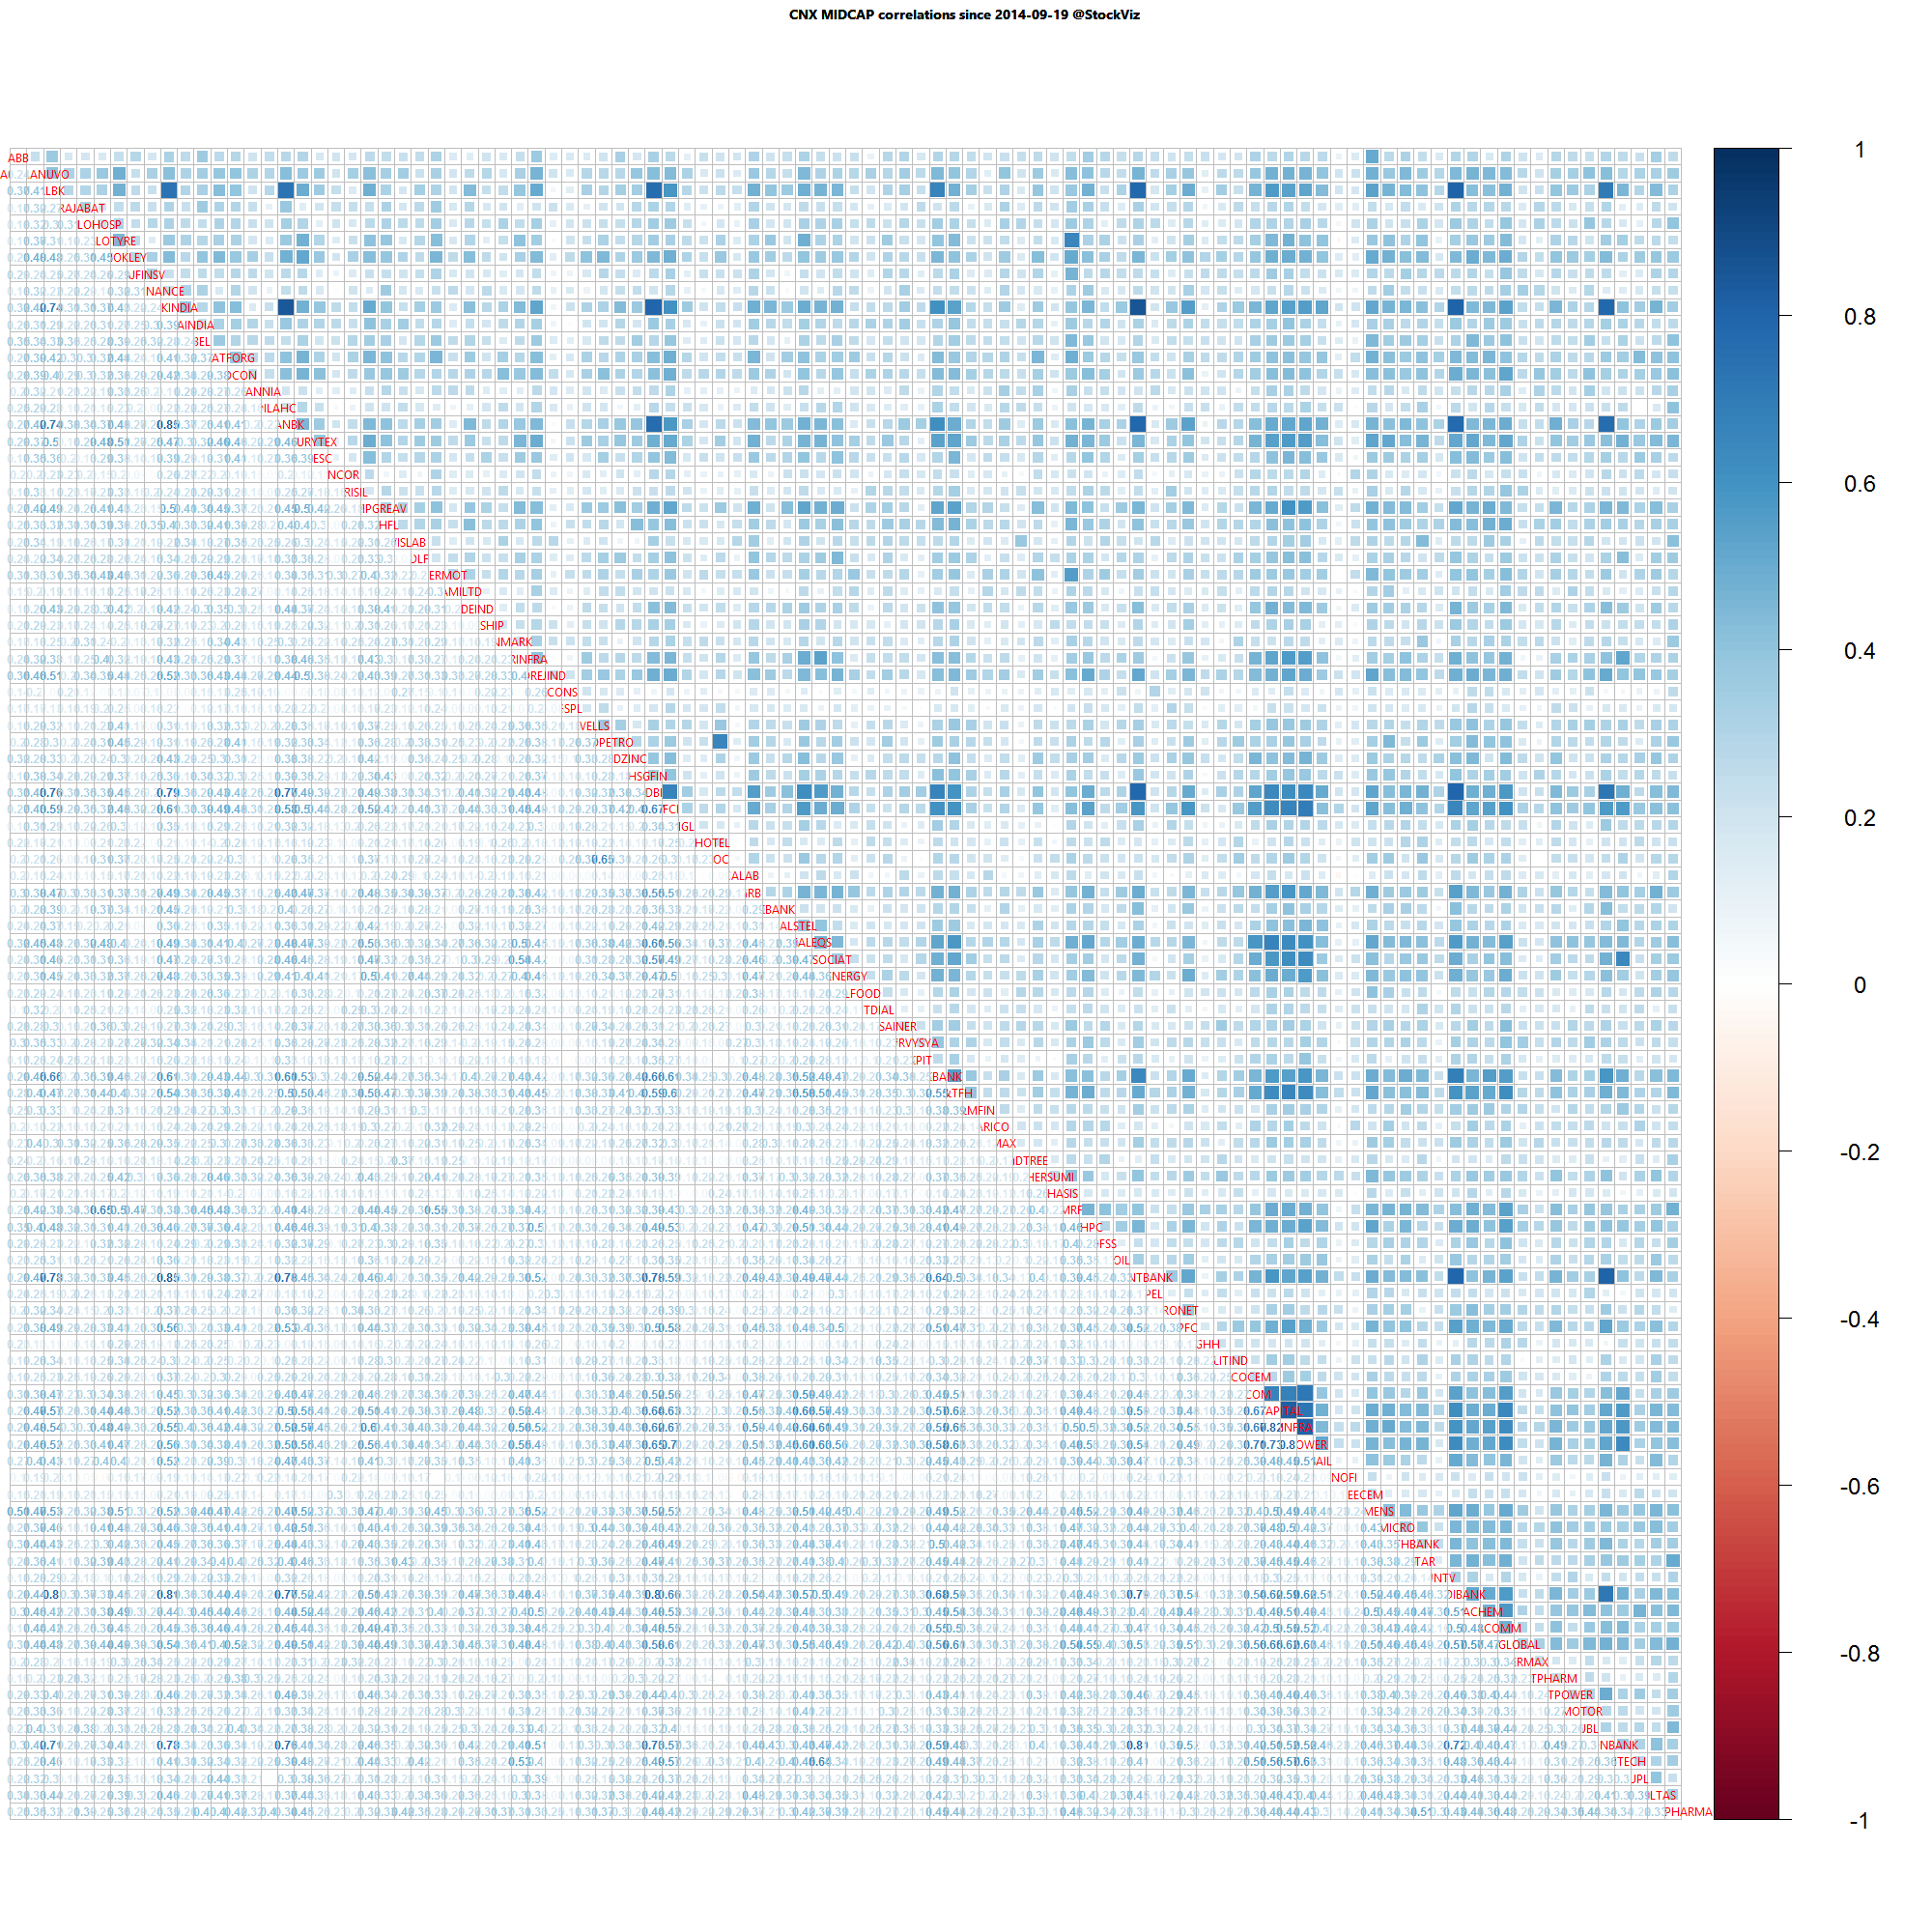
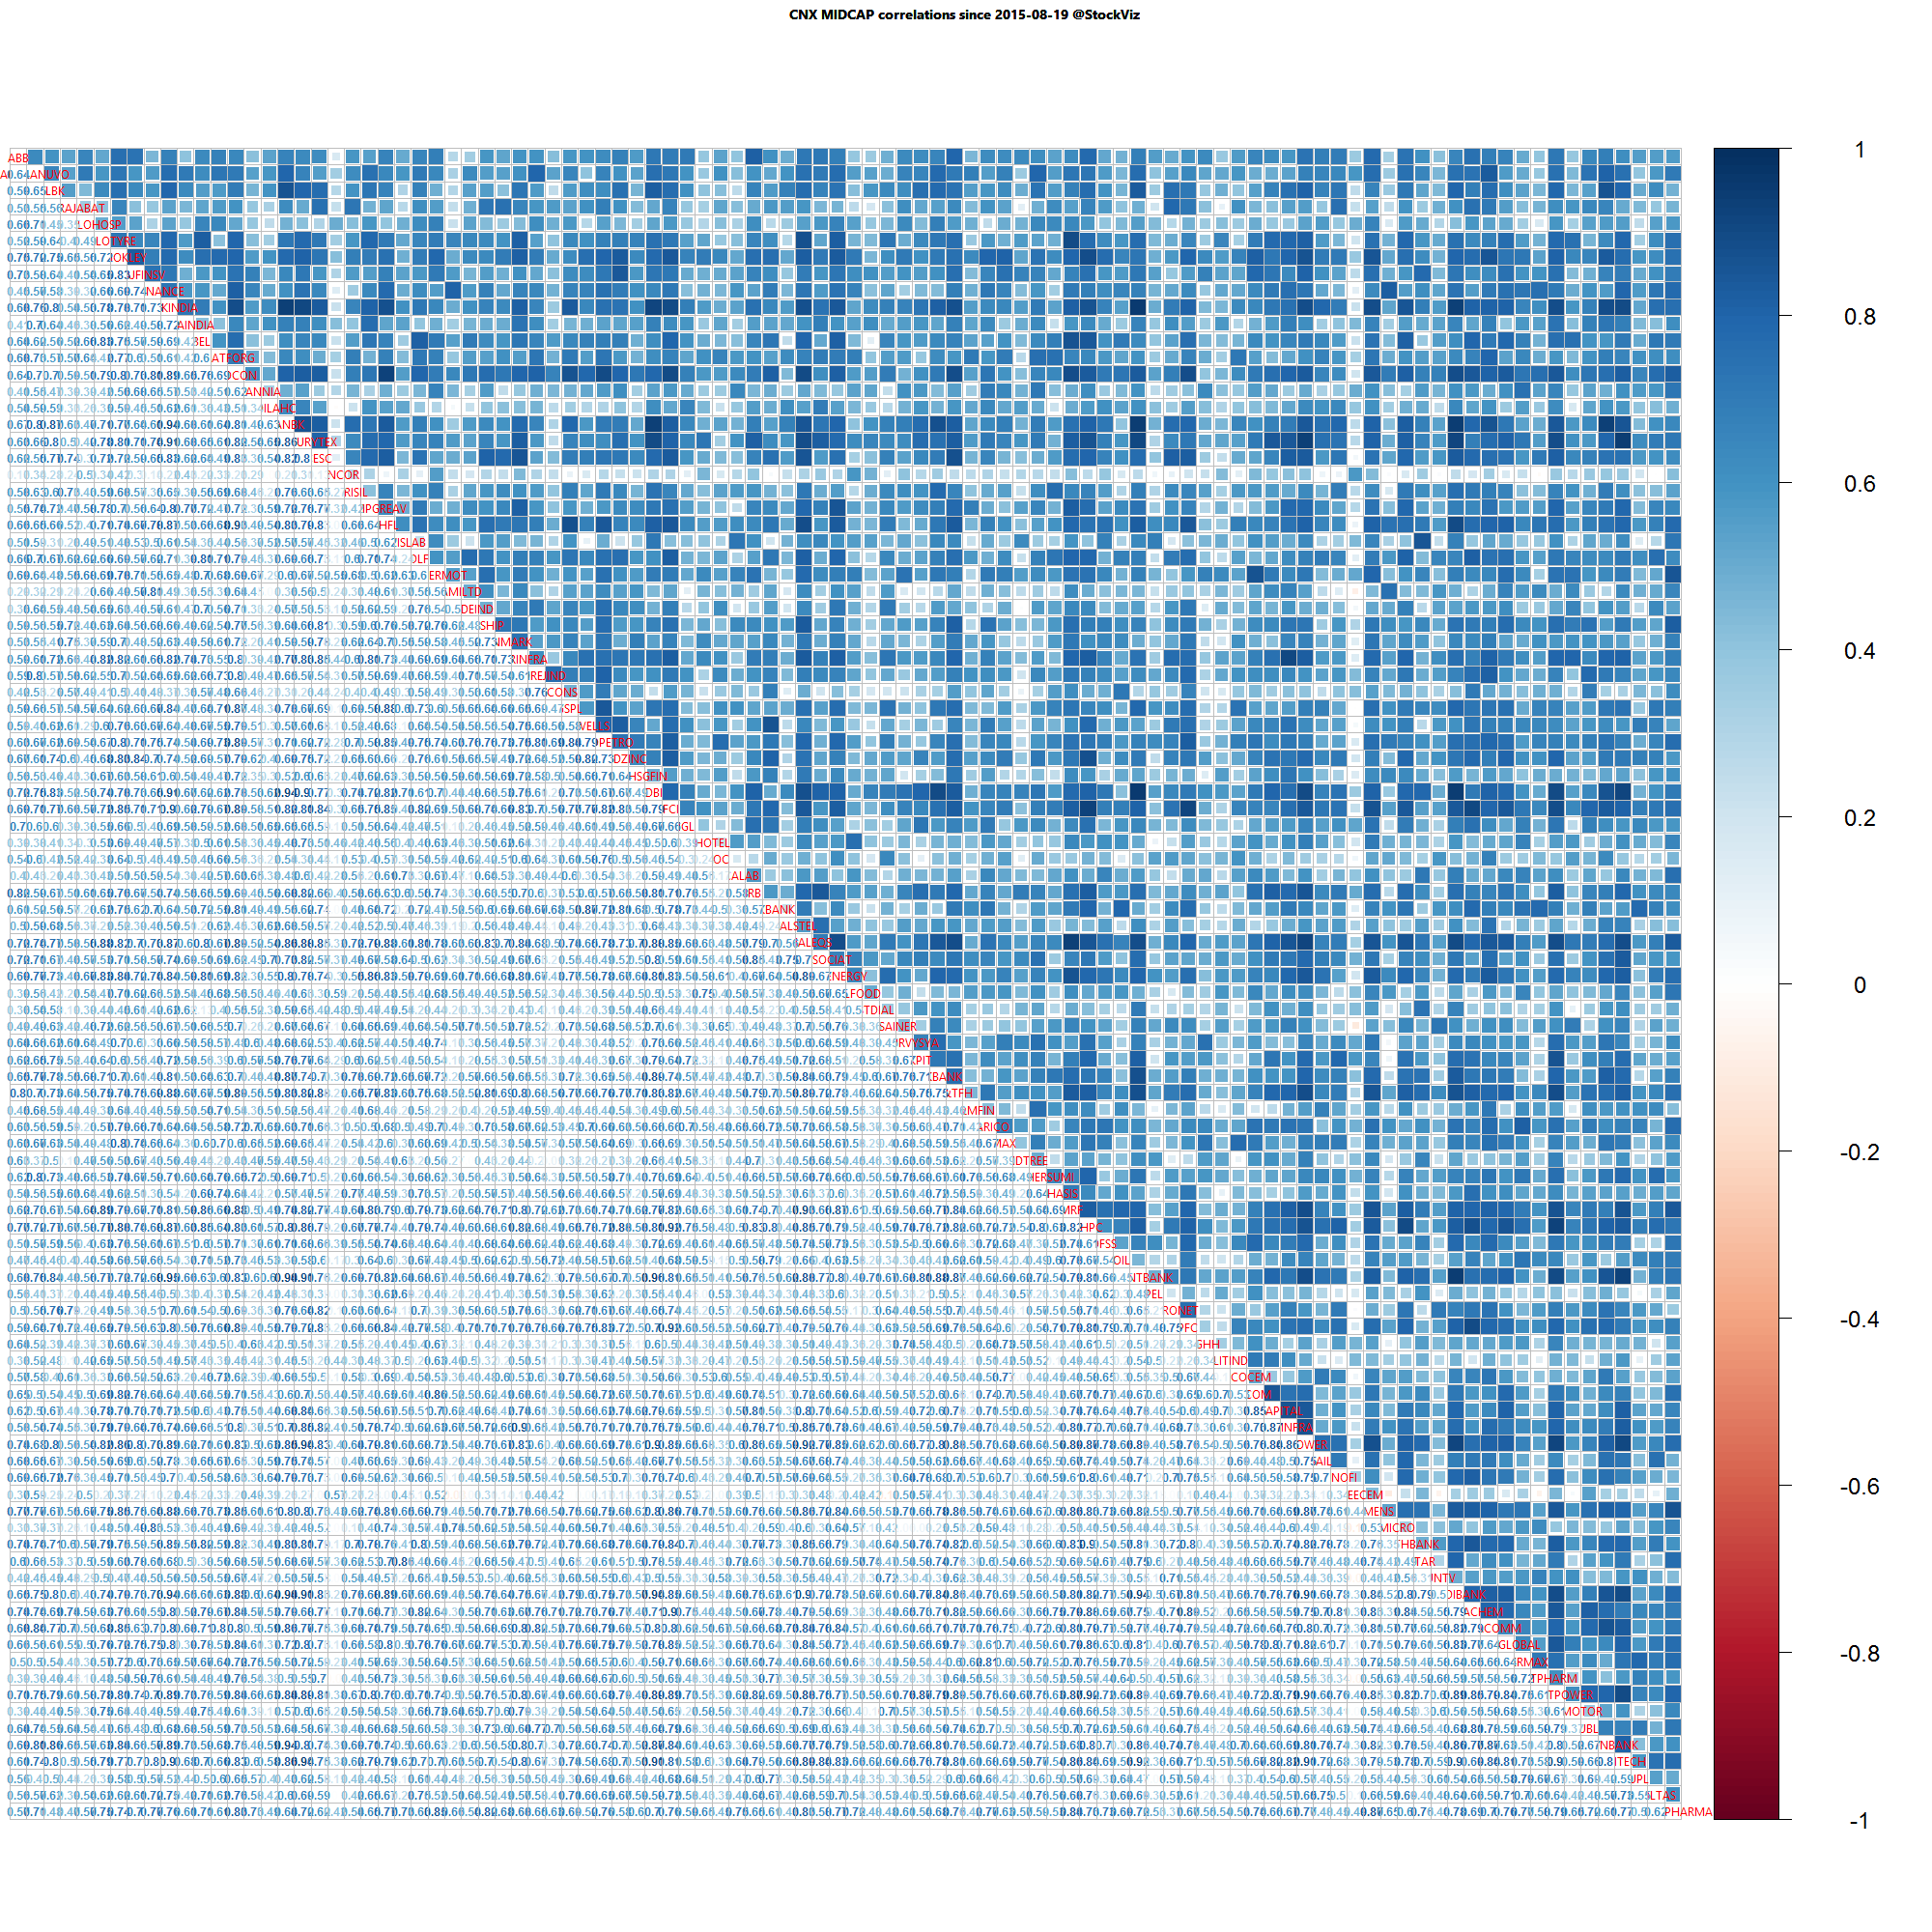
Midcap one year daily return correlations

Midcap one year daily return correlations

Midcap one month daily return correlations

Midcap one month daily return correlations

A lot of thick blue squares mean that positive correlations are high. Red squares mean negative correlations are high. Whites are the doldrums.

Index Update 19.09.2015

MOMENTUM

We run our proprietary momentum scoring algorithm on indices just like we do on stocks. You can use the momentum scores of sub-indices to get a sense for which sectors have the wind on their backs and those that are facing headwinds.

Traders can pick their longs in sectors with high short-term momentum and their shorts in sectors with low momentum. Investors can use the longer lookback scores to position themselves using our re-factored index Themes.

You can see how the momentum algorithm has performed on individual stocks here.

Here are the best and the worst sub-indices:
index momentum best 365 2015-09-18 png

index momentum best 50 2015-09-18 png

index momentum worst 365 2015-09-18 png

index momentum worst 50 2015-09-18 png

Relative Strength Spread

CNX_500 relative-spread-index 50 2015-09-18 png

Refactored Index Performance

50-day performance, from July 10, 2015 through September 18, 2015:

Trend Model Summary

Index Signal % From Peak Day of Peak
CNX AUTO SHORT
13.81
2015-Jan-27
CNX BANK LONG
15.31
2015-Jan-27
CNX COMMODITIES SHORT
36.65
2008-Jan-04
CNX CONSUMPTION LONG
8.85
2015-Aug-05
CNX ENERGY LONG
35.02
2008-Jan-14
CNX FMCG SHORT
12.55
2015-Feb-25
CNX INFRA LONG
53.46
2008-Jan-09
CNX IT LONG
87.72
2000-Feb-21
CNX MEDIA LONG
19.39
2008-Jan-04
CNX METAL SHORT
67.43
2008-Jan-04
CNX MNC LONG
9.58
2015-Aug-10
CNX NIFTY LONG
11.28
2015-Mar-03
CNX PHARMA SHORT
7.81
2015-Apr-08
CNX PSE SHORT
34.70
2008-Jan-04
CNX PSU BANK LONG
41.45
2010-Nov-05
CNX REALTY LONG
90.89
2008-Jan-14
CNX SERVICE LONG
10.94
2015-Mar-03
Momentum continued to be a train-wreck this week. All indices saw major drawdowns…

Correlation Update 19.09.2015

Nifty one year daily return correlations

Nifty one year daily return correlations

Nifty one month daily return correlations

Nifty one month daily return correlations

Bank Nifty one year daily return correlations

Bank Nifty one year daily return correlations

Bank Nifty one month daily return correlations

Bank Nifty one month daily return correlations

Midcap one year daily return correlations

Midcap one year daily return correlations

Midcap one month daily return correlations

Midcap one month daily return correlations

A lot of thick blue squares mean that positive correlations are high. Red squares mean negative correlations are high. Whites are the doldrums.

Index Update 12.09.2015

MOMENTUM

We run our proprietary momentum scoring algorithm on indices just like we do on stocks. You can use the momentum scores of sub-indices to get a sense for which sectors have the wind on their backs and those that are facing headwinds.

Traders can pick their longs in sectors with high short-term momentum and their shorts in sectors with low momentum. Investors can use the longer lookback scores to position themselves using our re-factored index Themes.

You can see how the momentum algorithm has performed on individual stocks here.

Here are the best and the worst sub-indices:
index momentum best 365 2015-09-11 png

index momentum best 50 2015-09-11 png

index momentum worst 365 2015-09-11 png

index momentum worst 50 2015-09-11 png

Relative Strength Spread

CNX_500 relative-spread-index 50 2015-09-11 png

Refactored Index Performance

50-day performance, from July 06, 2015 through September 11, 2015:

Trend Model Summary

Index Signal % From Peak Day of Peak
CNX AUTO SHORT
13.65
2015-Jan-27
CNX BANK LONG
19.18
2015-Jan-27
CNX COMMODITIES SHORT
37.69
2008-Jan-04
CNX CONSUMPTION LONG
9.96
2015-Aug-05
CNX ENERGY LONG
37.47
2008-Jan-14
CNX FMCG LONG
12.93
2015-Feb-25
CNX INFRA LONG
53.86
2008-Jan-09
CNX IT SHORT
88.03
2000-Feb-21
CNX MEDIA SHORT
20.45
2008-Jan-04
CNX METAL SHORT
67.83
2008-Jan-04
CNX MNC LONG
10.38
2015-Aug-10
CNX NIFTY SHORT
13.42
2015-Mar-03
CNX PHARMA SHORT
10.77
2015-Apr-08
CNX PSE LONG
36.23
2008-Jan-04
CNX PSU BANK LONG
44.30
2010-Nov-05
CNX REALTY SHORT
91.21
2008-Jan-14
CNX SERVICE LONG
13.95
2015-Mar-03
Has the momentum crash run its course? Seems like the pendulum has swung too far out…