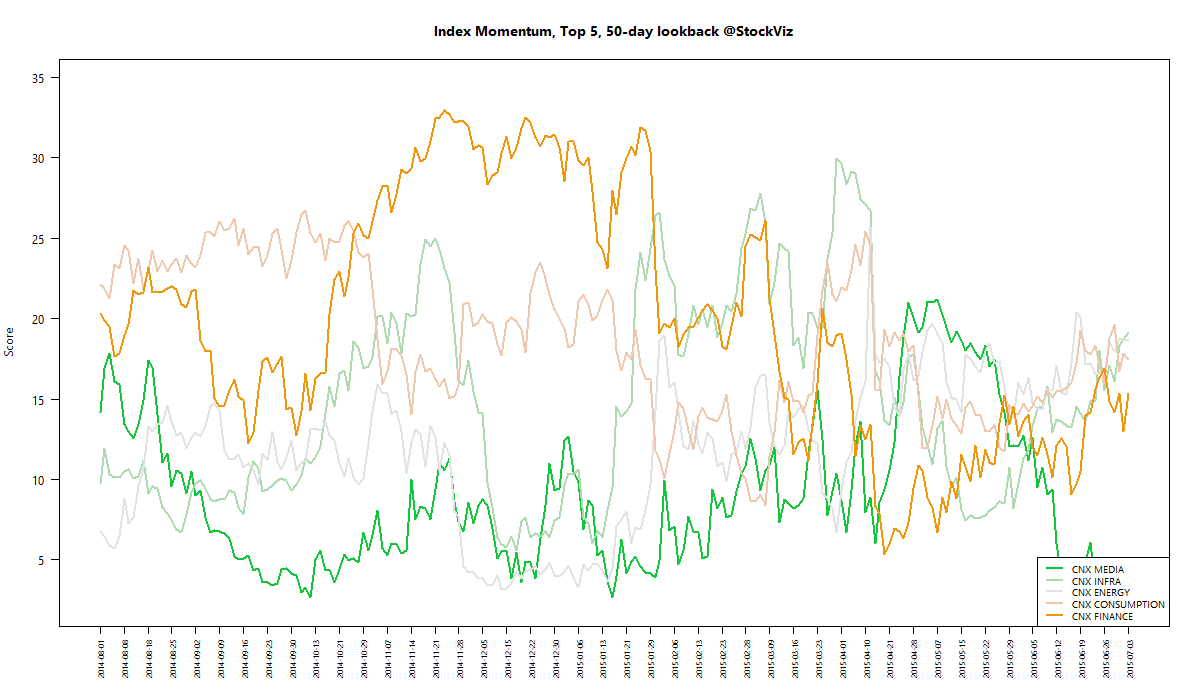
MOMENTUM
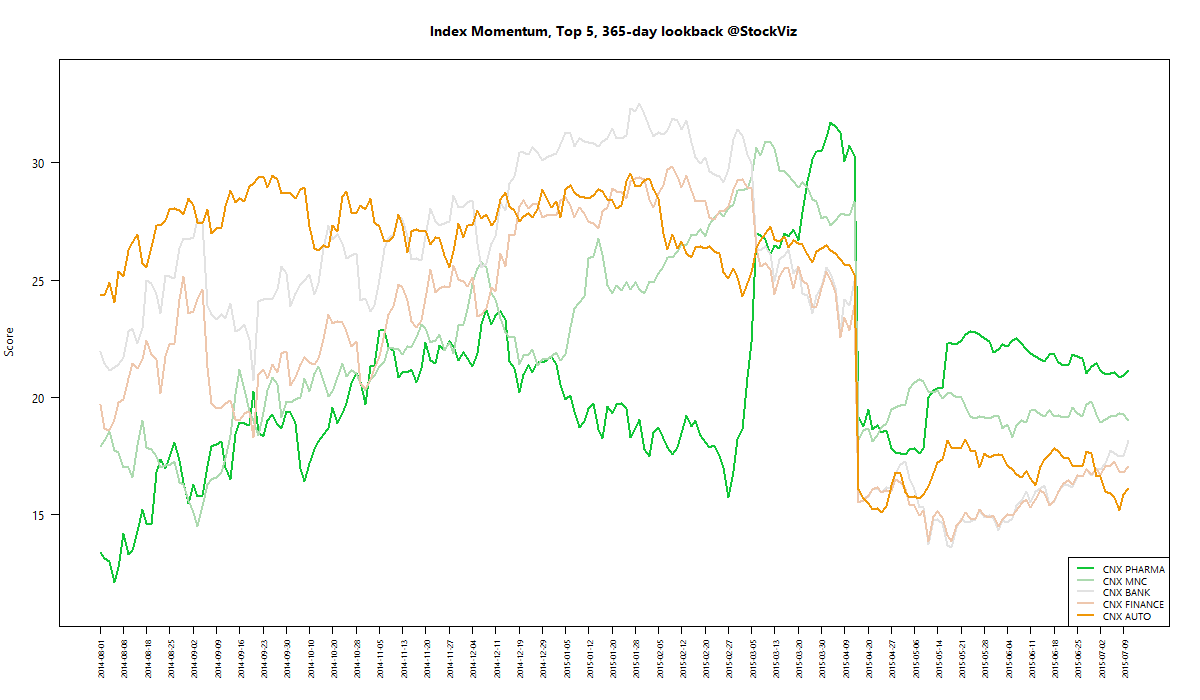
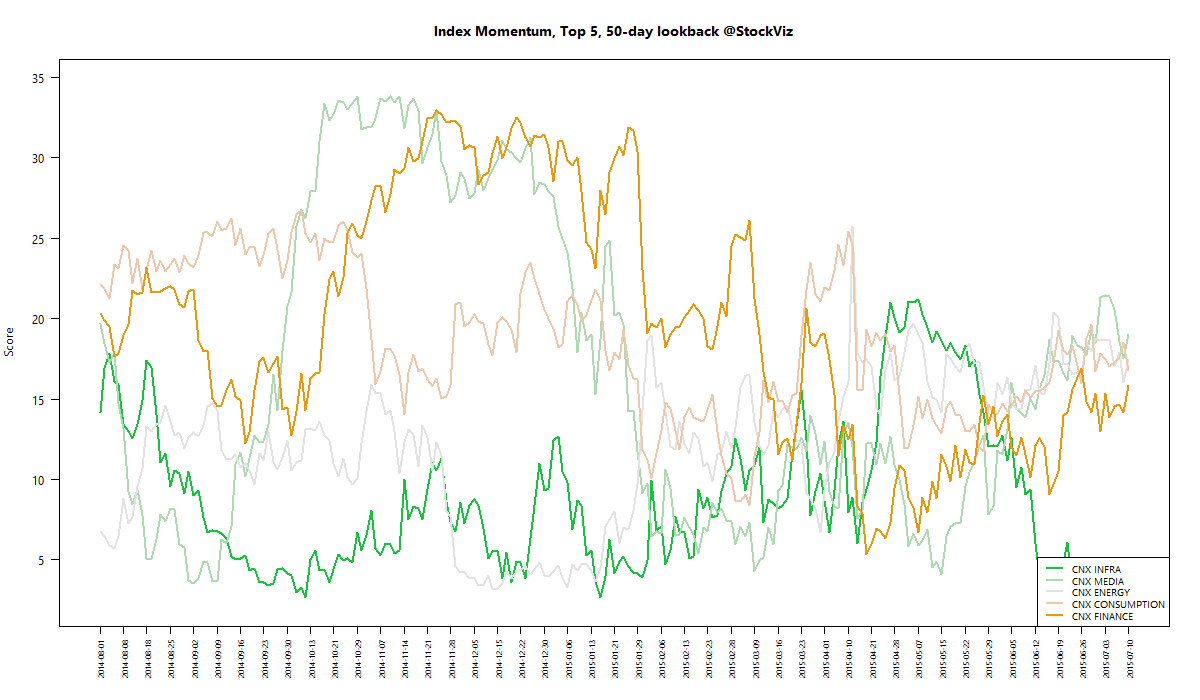
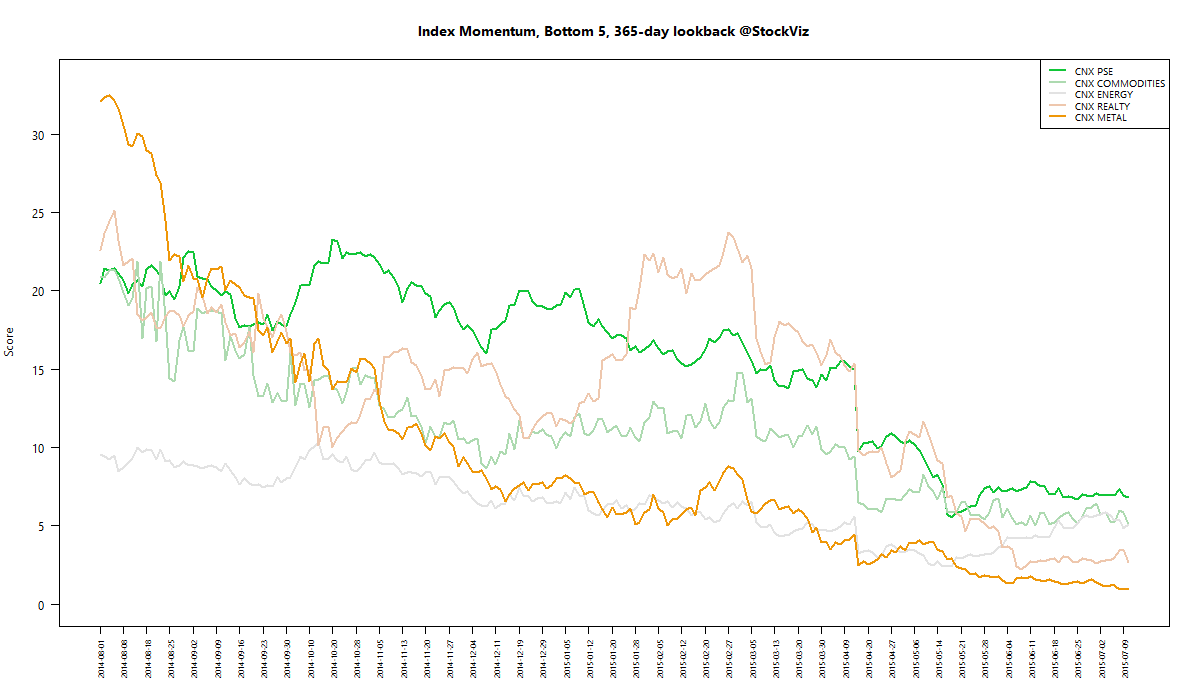
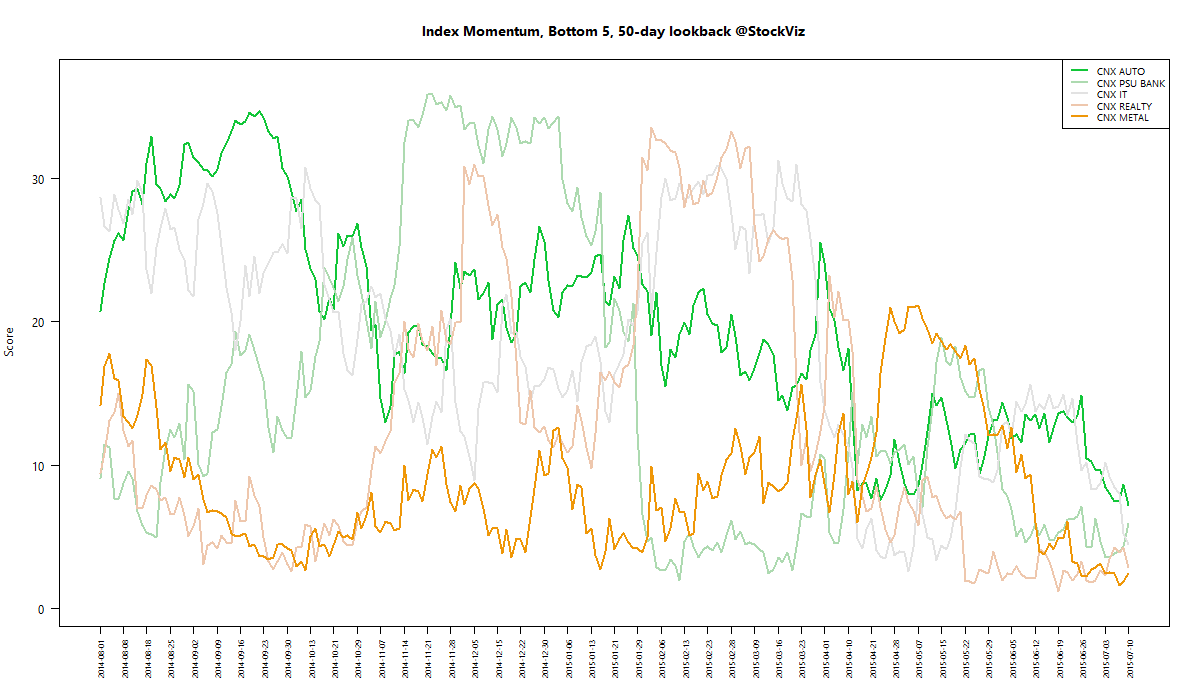
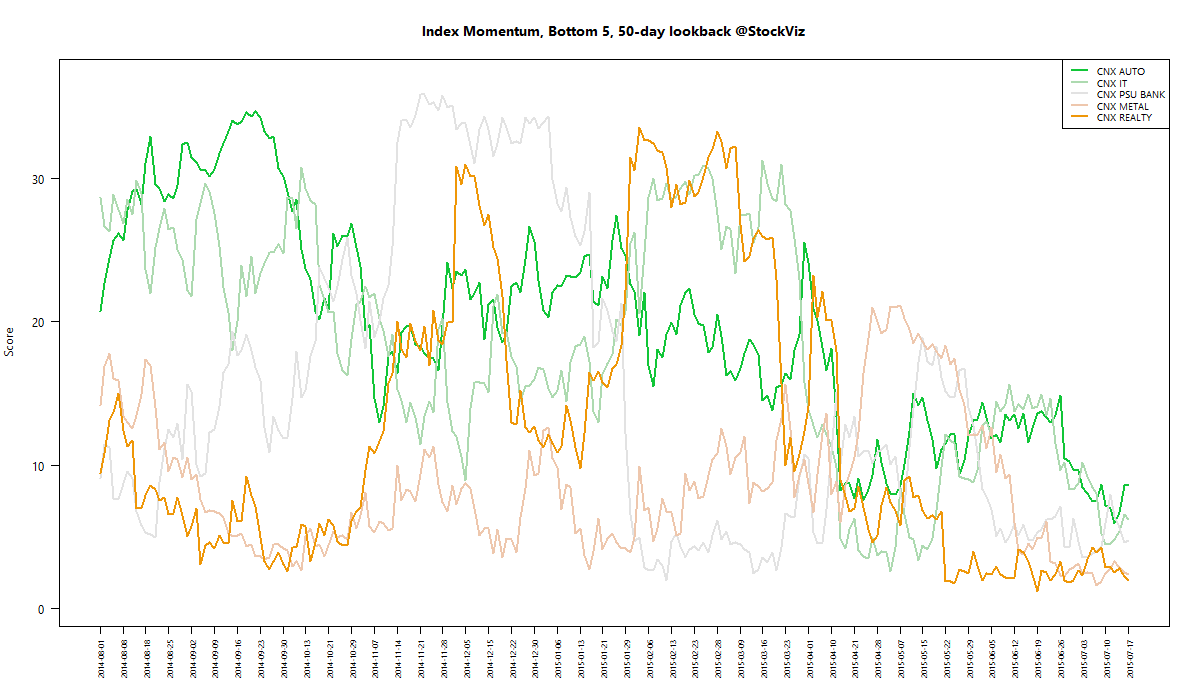
We run our proprietary momentum scoring algorithm on indices just like we do on stocks. You can use the momentum scores of sub-indices to get a sense for which sectors have the wind on their backs and those that are facing headwinds.
Traders can pick their longs in sectors with high short-term momentum and their shorts in sectors with low momentum. Investors can use the longer lookback scores to position themselves using our re-factored index Themes.
You can see how the momentum algorithm has performed on individual stocks here.
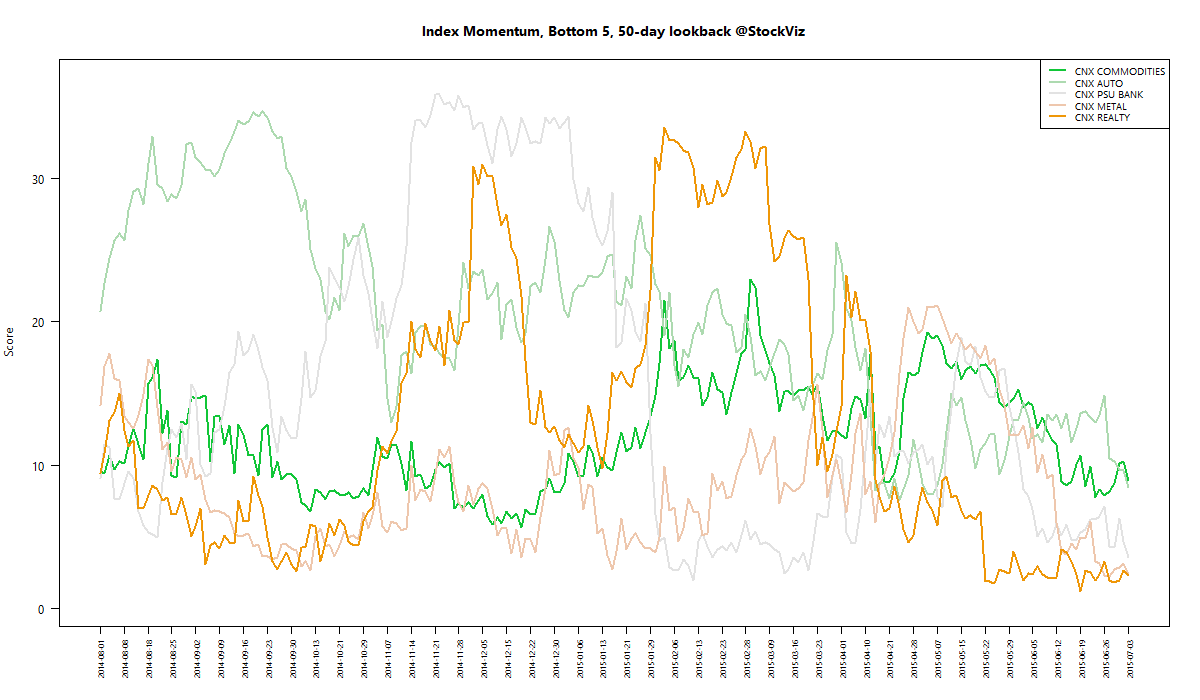
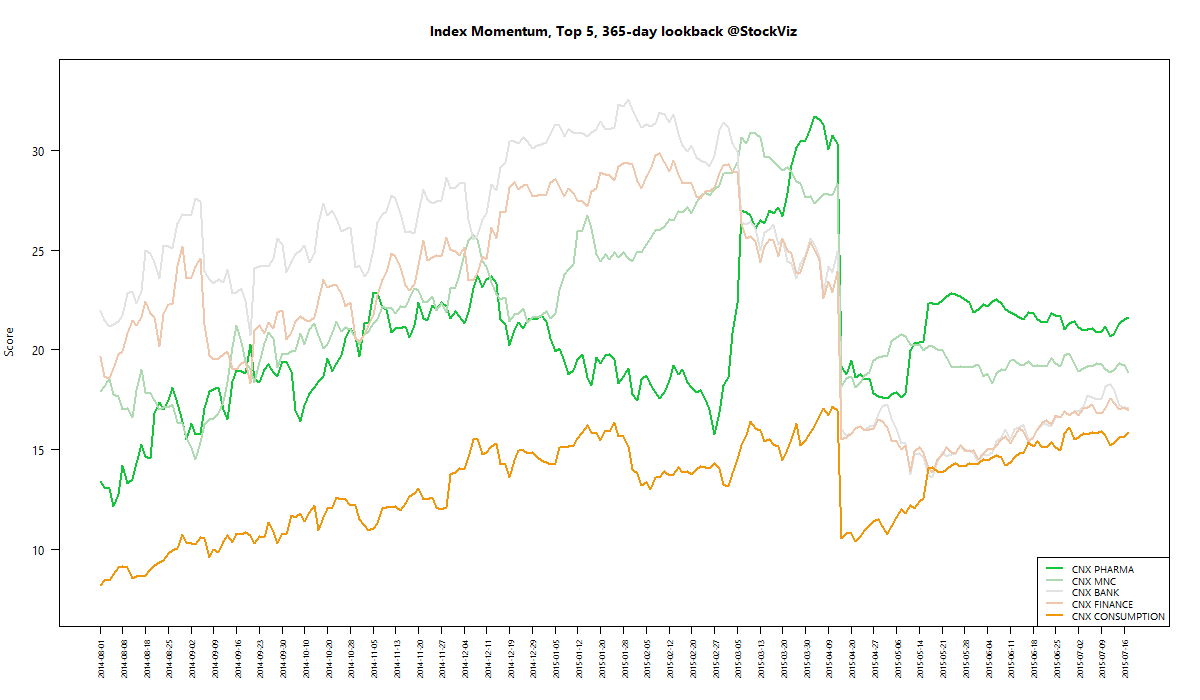
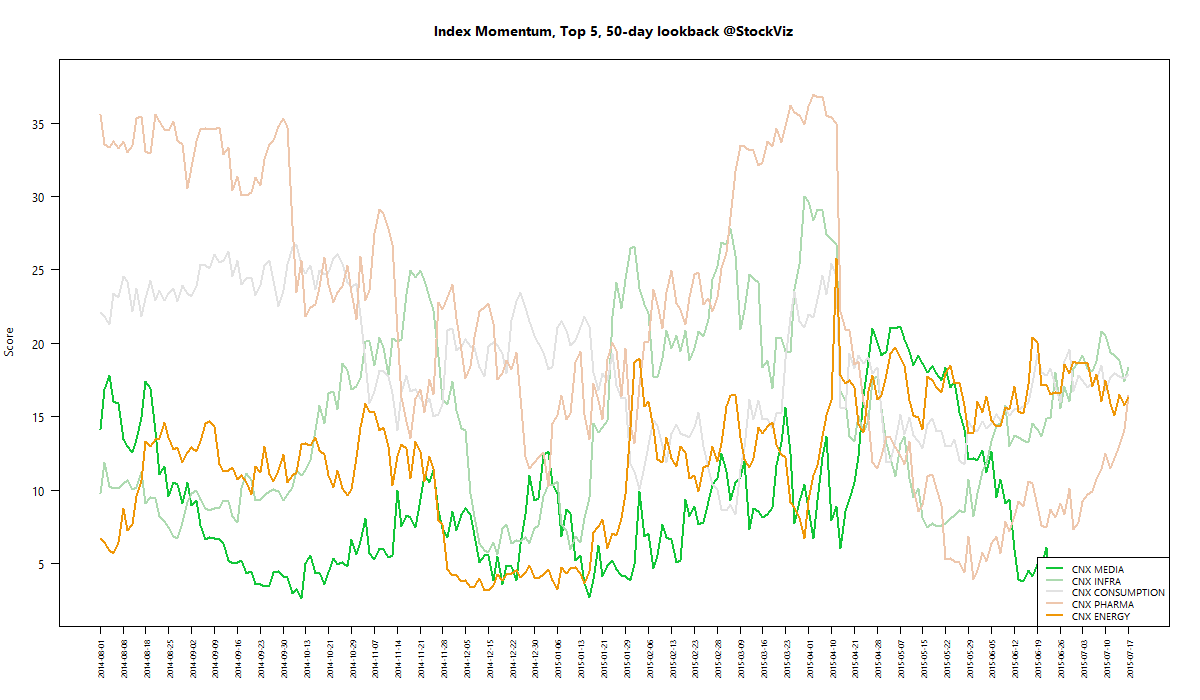
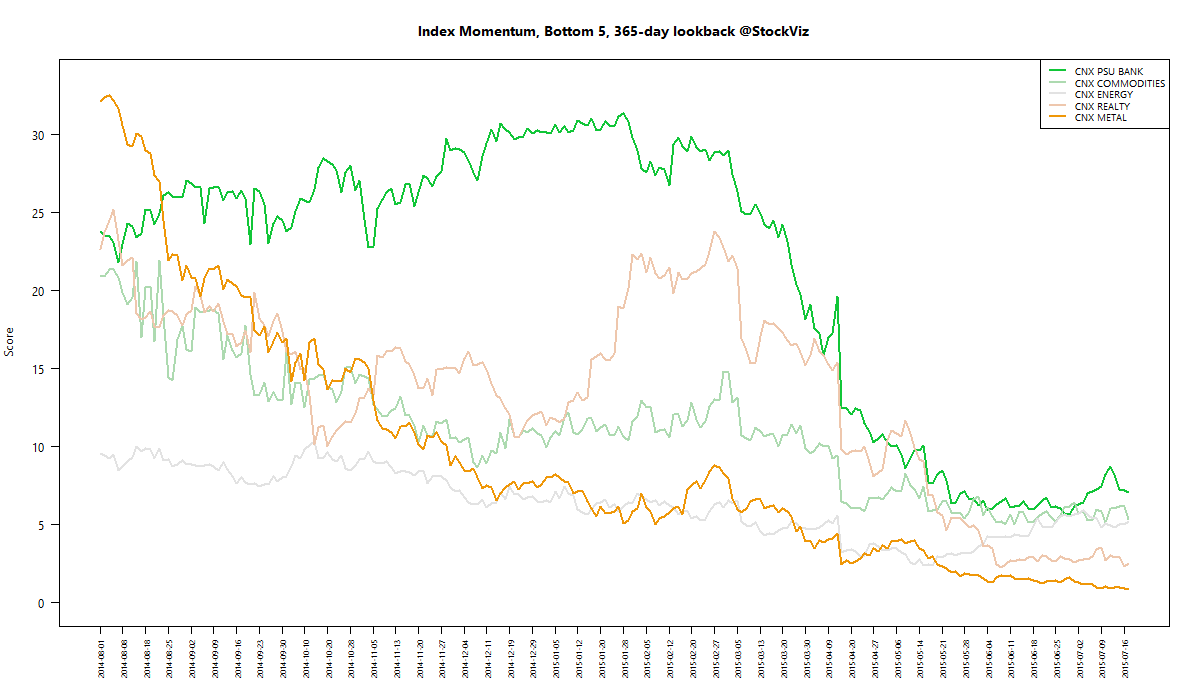
Here are the best and the worst sub-indices:
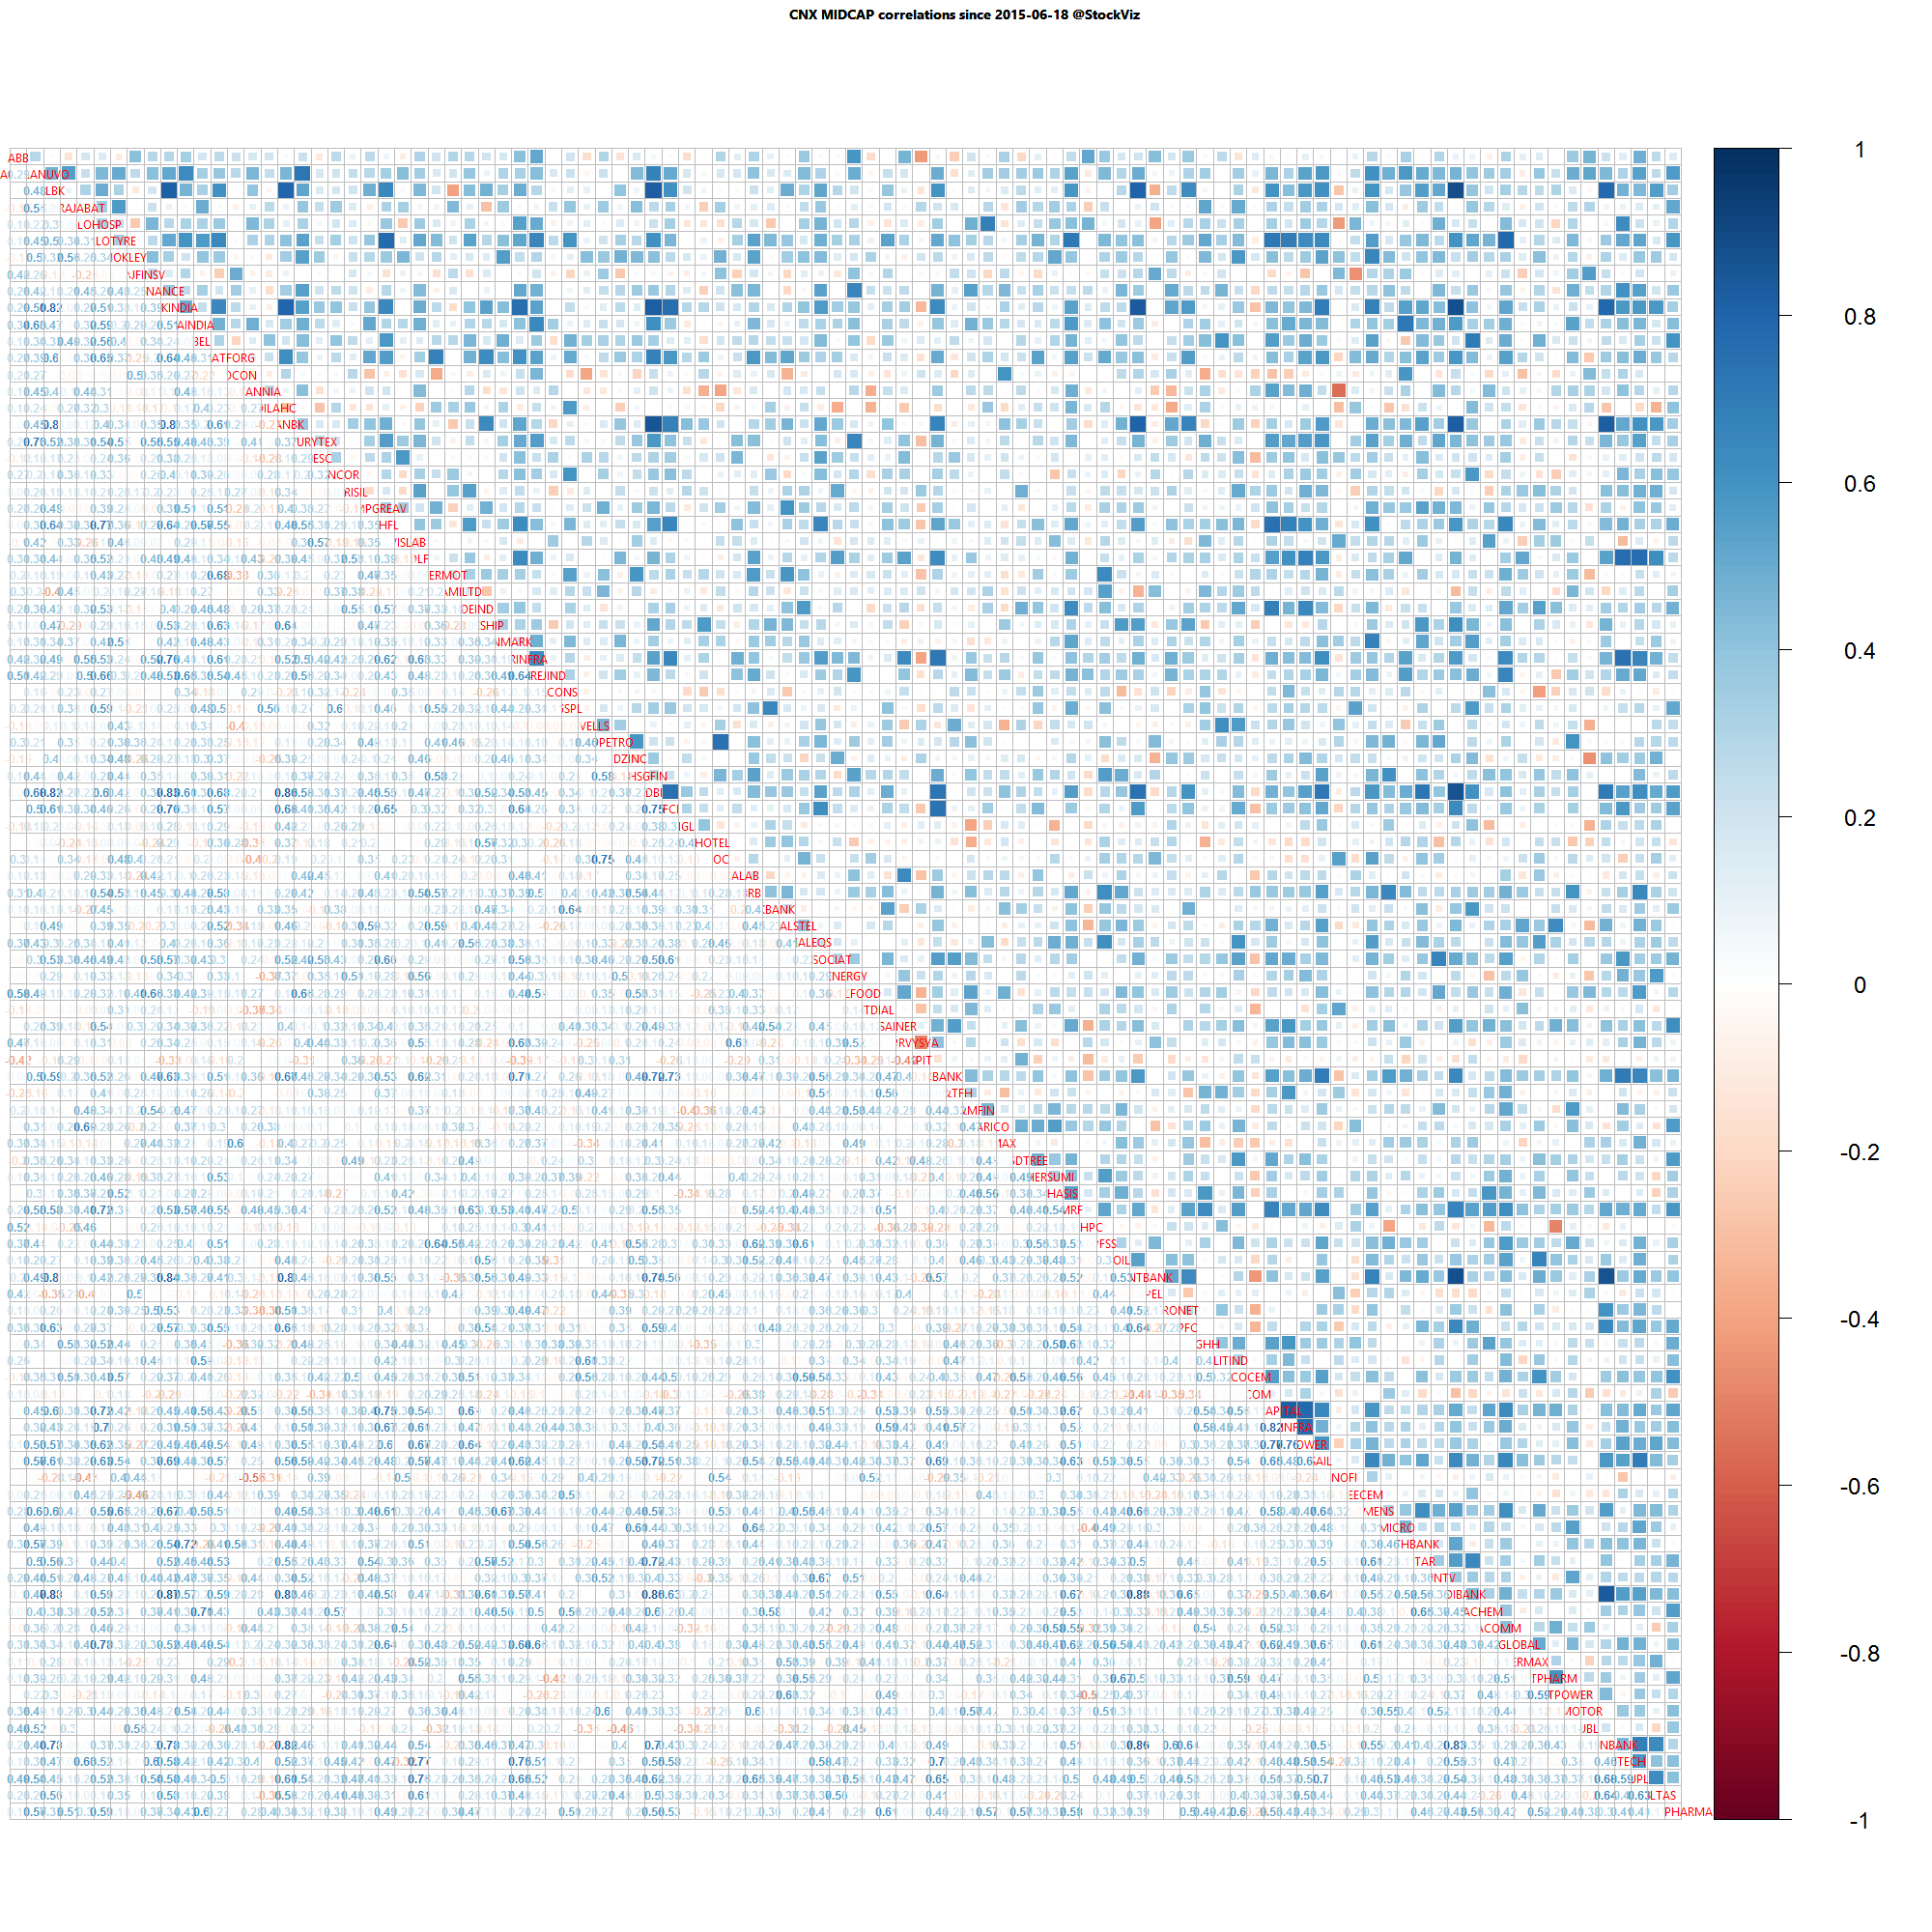
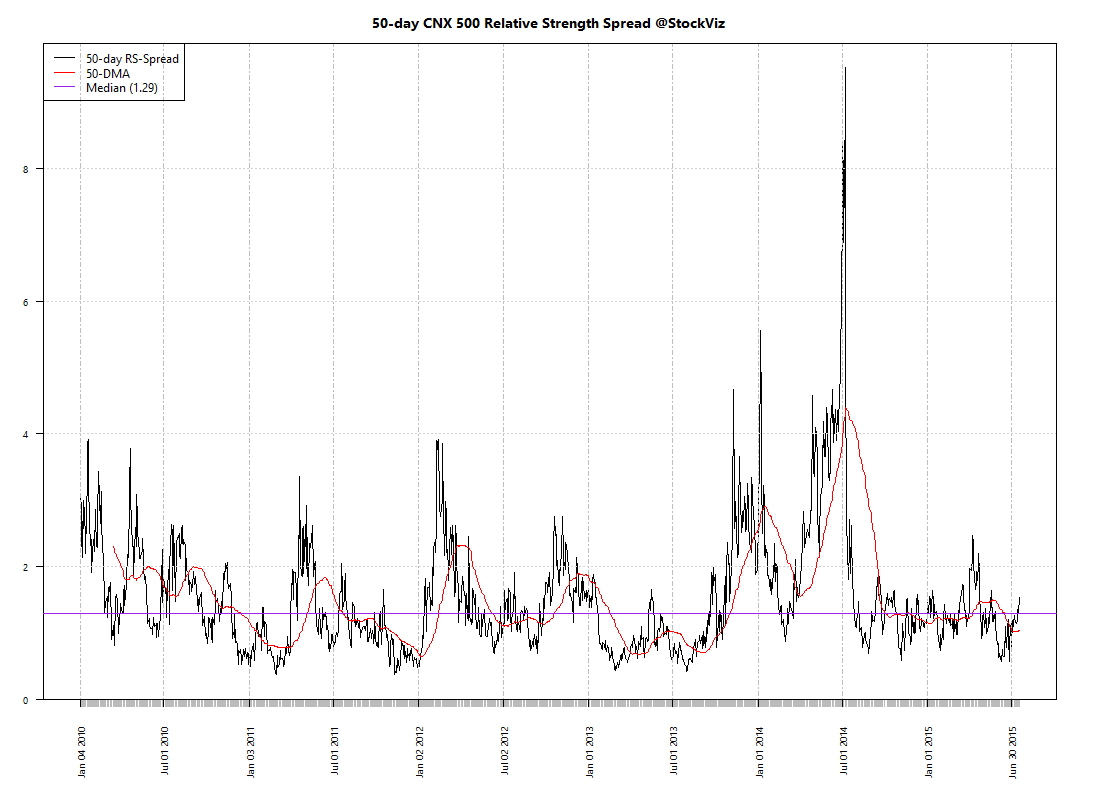
Relative Strength Spread
Refactored Index Performance
50-day performance, from May 11, 2015 through July 17, 2015:
Trend Model Summary
| Index | Signal | % From Peak | Day of Peak |
|---|---|---|---|
| CNX AUTO | SHORT |
6.88
|
2015-Jan-27
|
| CNX BANK | SHORT |
7.11
|
2015-Jan-27
|
| CNX COMMODITIES | SHORT |
27.00
|
2008-Jan-04
|
| CNX CONSUMPTION | LONG |
0.00
|
2015-Jul-17
|
| CNX ENERGY | SHORT |
25.49
|
2008-Jan-14
|
| CNX FMCG | SHORT |
7.71
|
2015-Feb-25
|
| CNX INFRA | LONG |
45.57
|
2008-Jan-09
|
| CNX IT | LONG |
88.20
|
2000-Feb-21
|
| CNX MEDIA | LONG |
20.59
|
2008-Jan-04
|
| CNX METAL | LONG |
59.82
|
2008-Jan-04
|
| CNX MNC | LONG |
0.04
|
2015-Jul-16
|
| CNX PHARMA | LONG |
5.00
|
2015-Apr-08
|
| CNX PSE | LONG |
23.04
|
2008-Jan-04
|
| CNX PSU BANK | SHORT |
37.11
|
2010-Nov-05
|
| CNX REALTY | SHORT |
90.41
|
2008-Jan-14
|
| CNX SERVICE | LONG |
6.13
|
2015-Mar-03
|
MNCs and FMCGs have recouped their drawdowns. PHARMA is not far behind. Its the old economy stocks that are still trying to digest their “India Shining” debt binge.