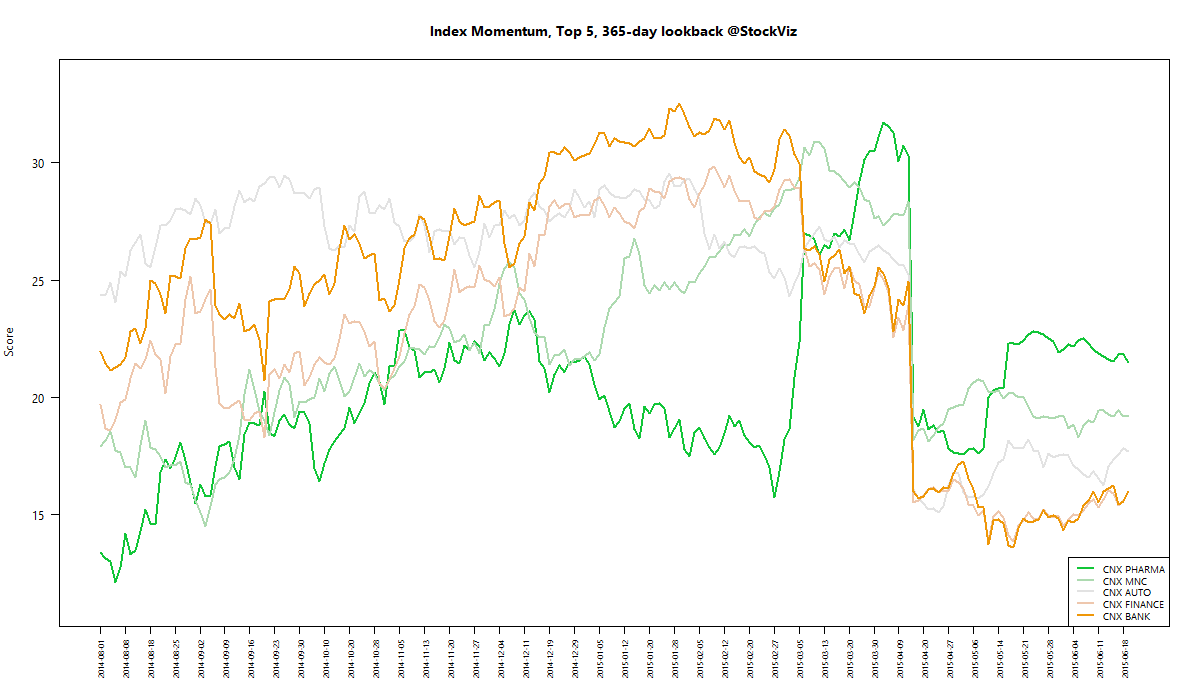
MOMENTUM
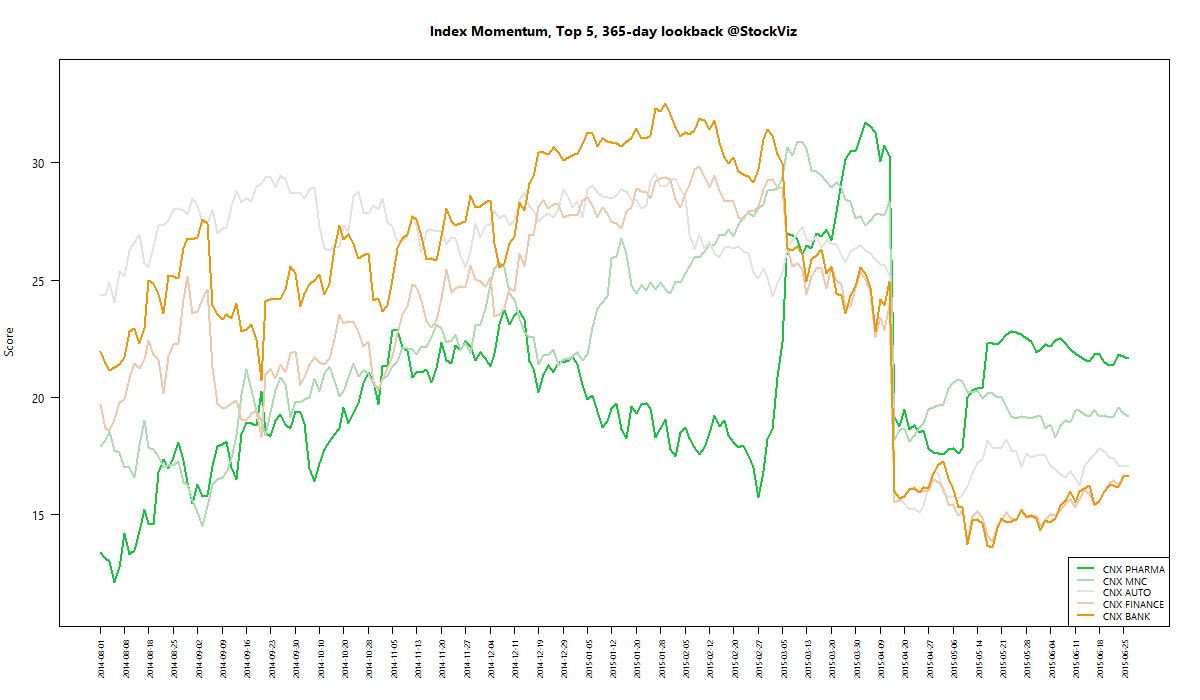
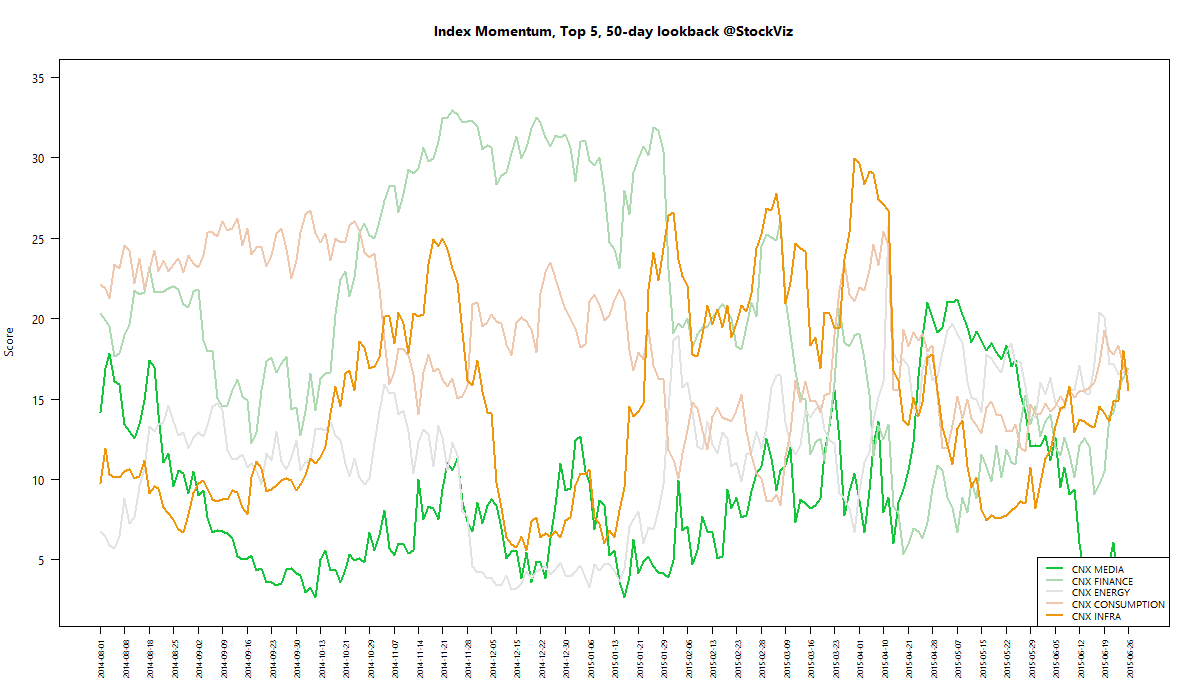
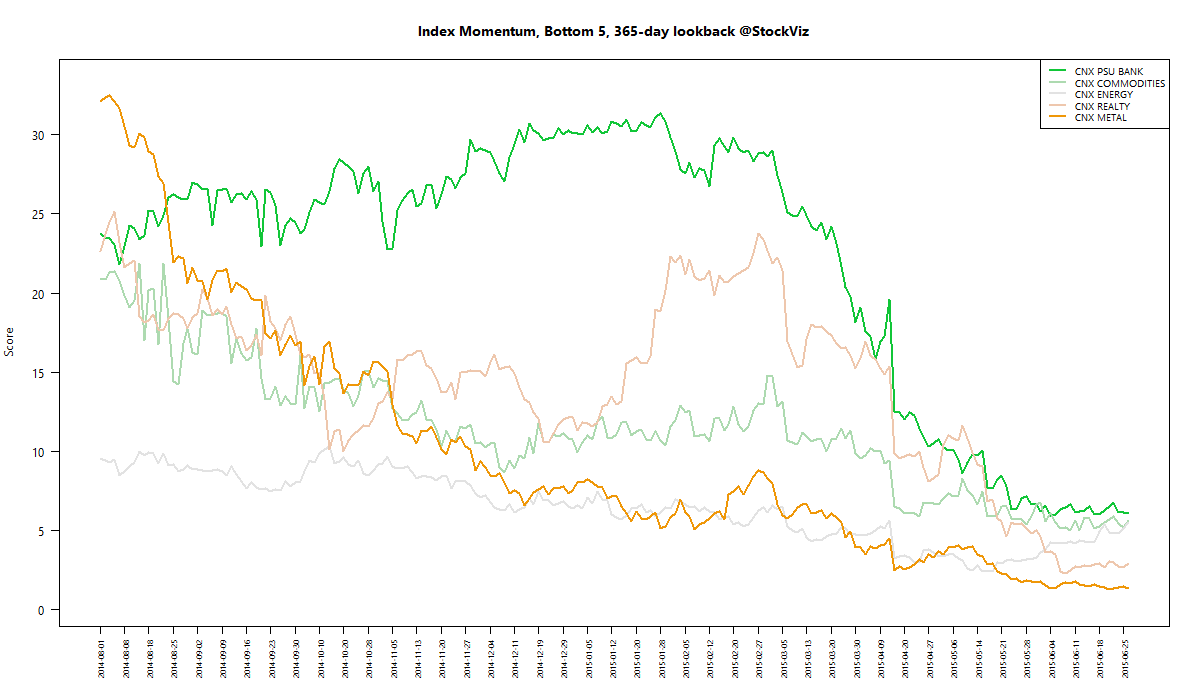
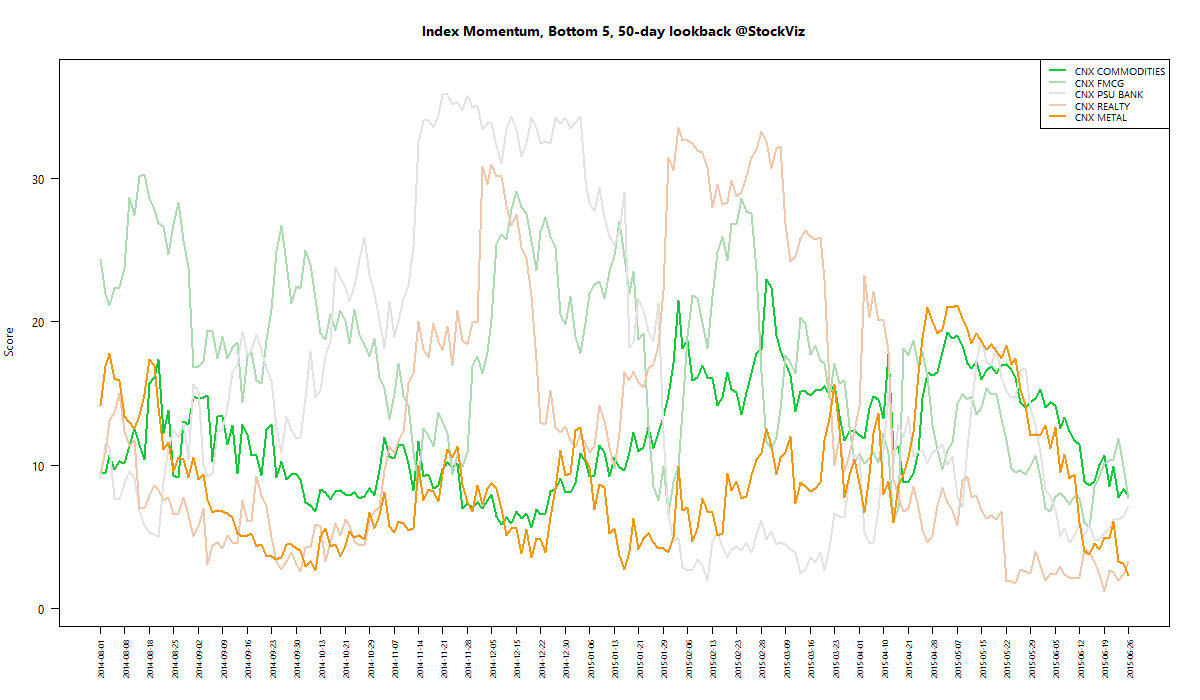
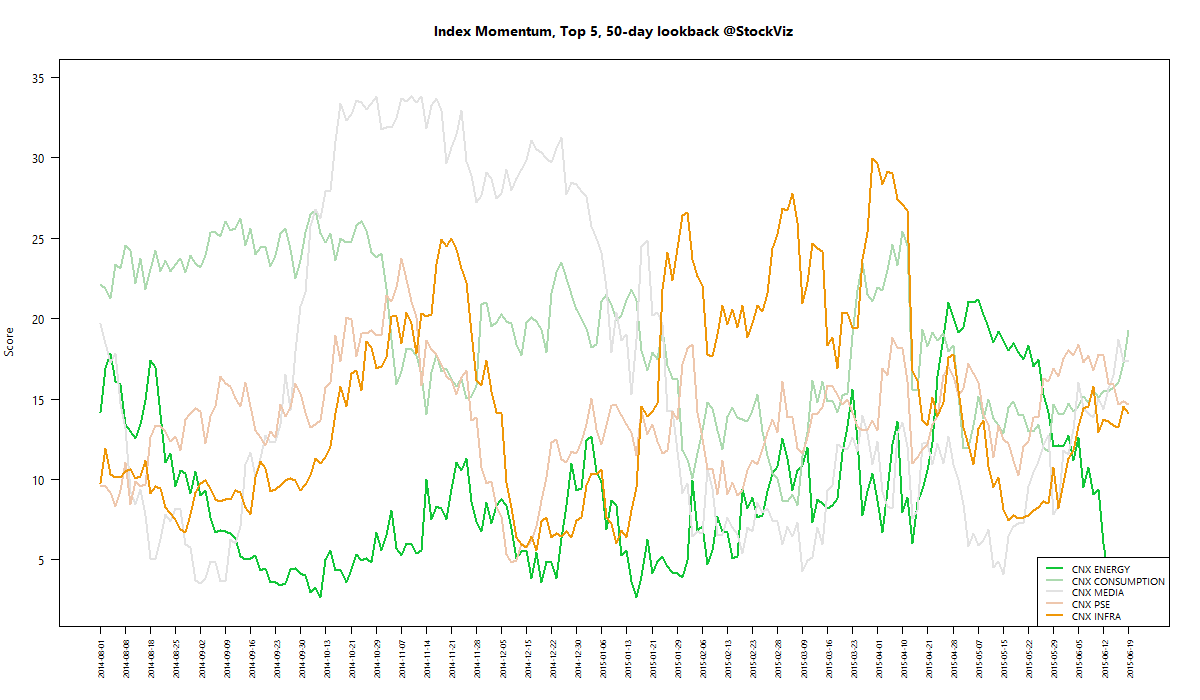
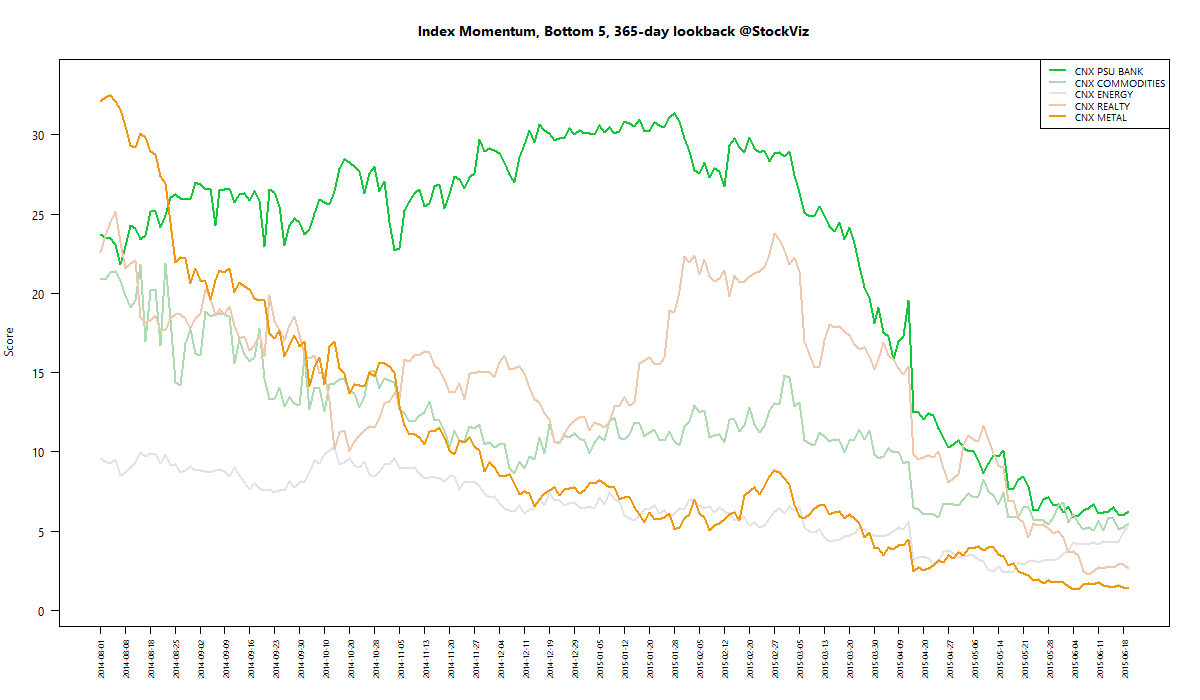
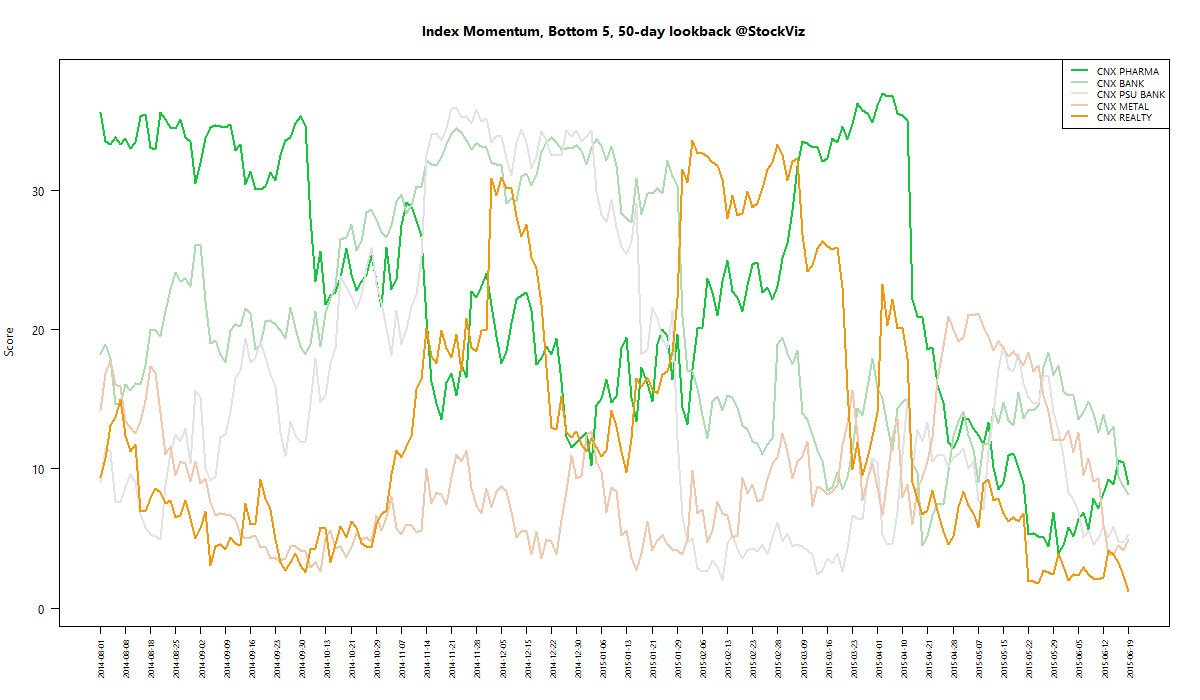
We run our proprietary momentum scoring algorithm on indices just like we do on stocks. You can use the momentum scores of sub-indices to get a sense for which sectors have the wind on their backs and those that are facing headwinds.
Traders can pick their longs in sectors with high short-term momentum and their shorts in sectors with low momentum. Investors can use the longer lookback scores to position themselves using our re-factored index Themes.
You can see how the momentum algorithm has performed on individual stocks here.
Here are the best and the worst sub-indices:
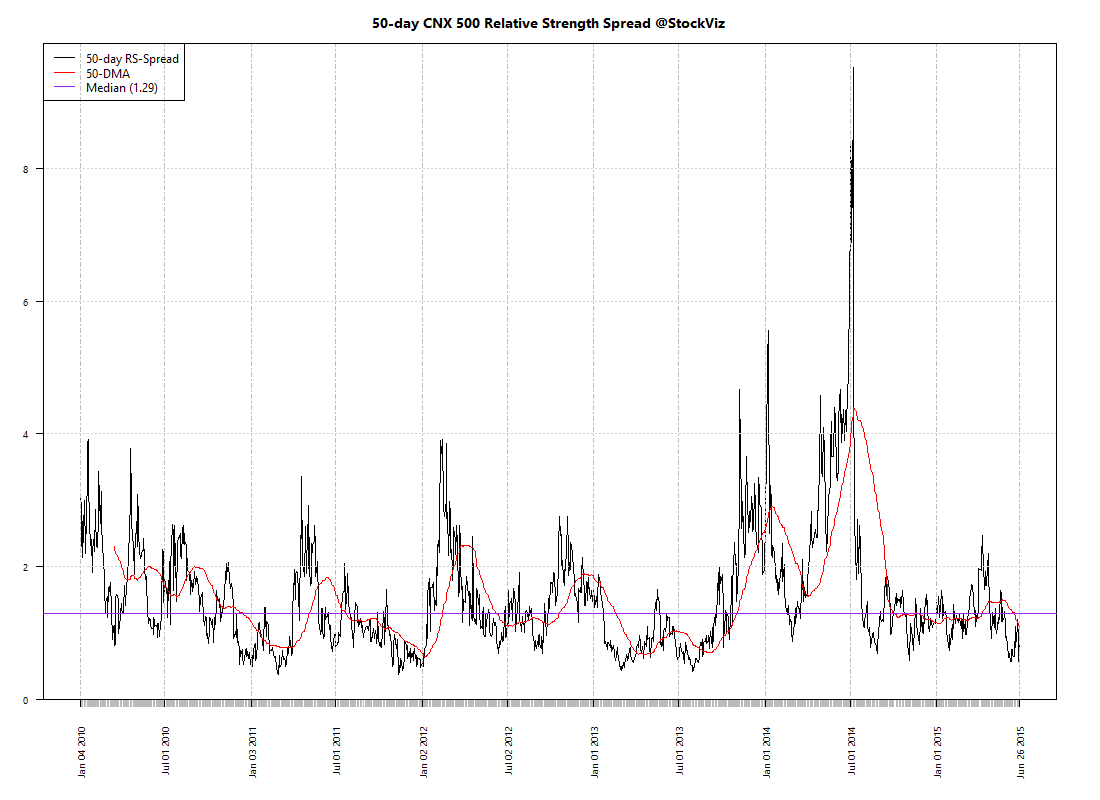
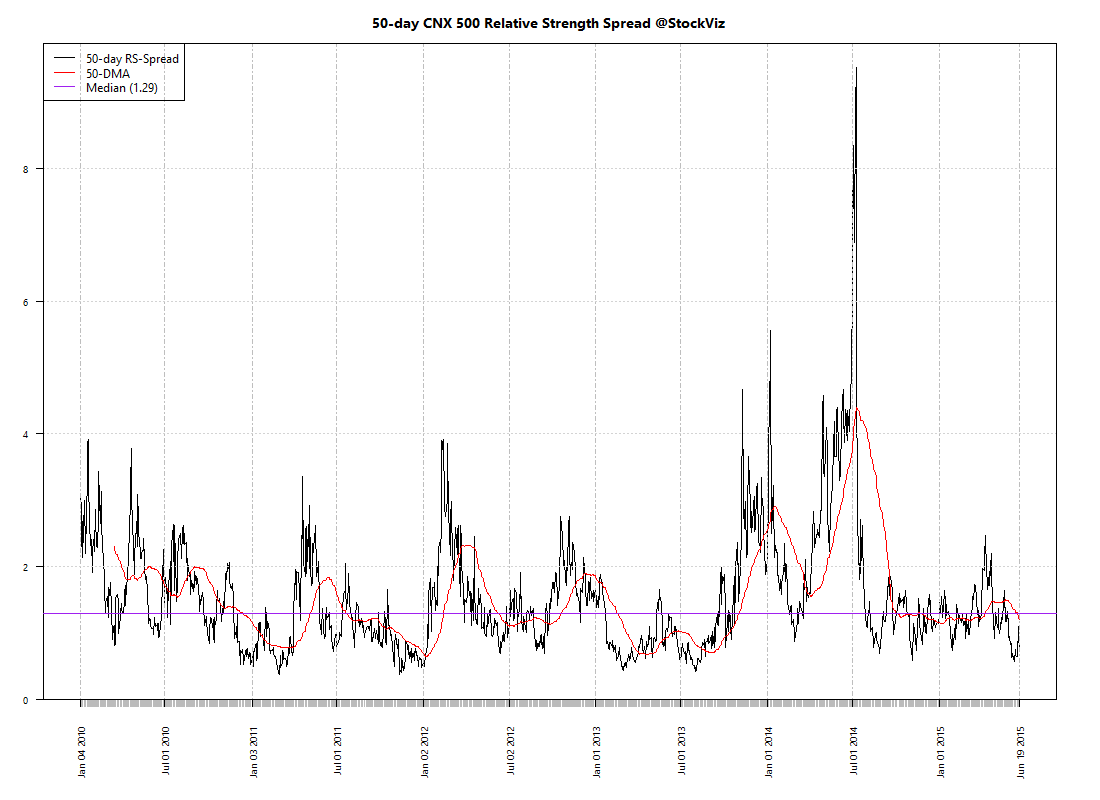
Relative Strength Spread
Refactored Index Performance
50-day performance, from April 09, 2015 through June 19, 2015:
Trend Model Summary
| Index |
Signal |
% From Peak |
Day of Peak |
| CNX AUTO |
LONG |
8.73
|
2015-Jan-27
|
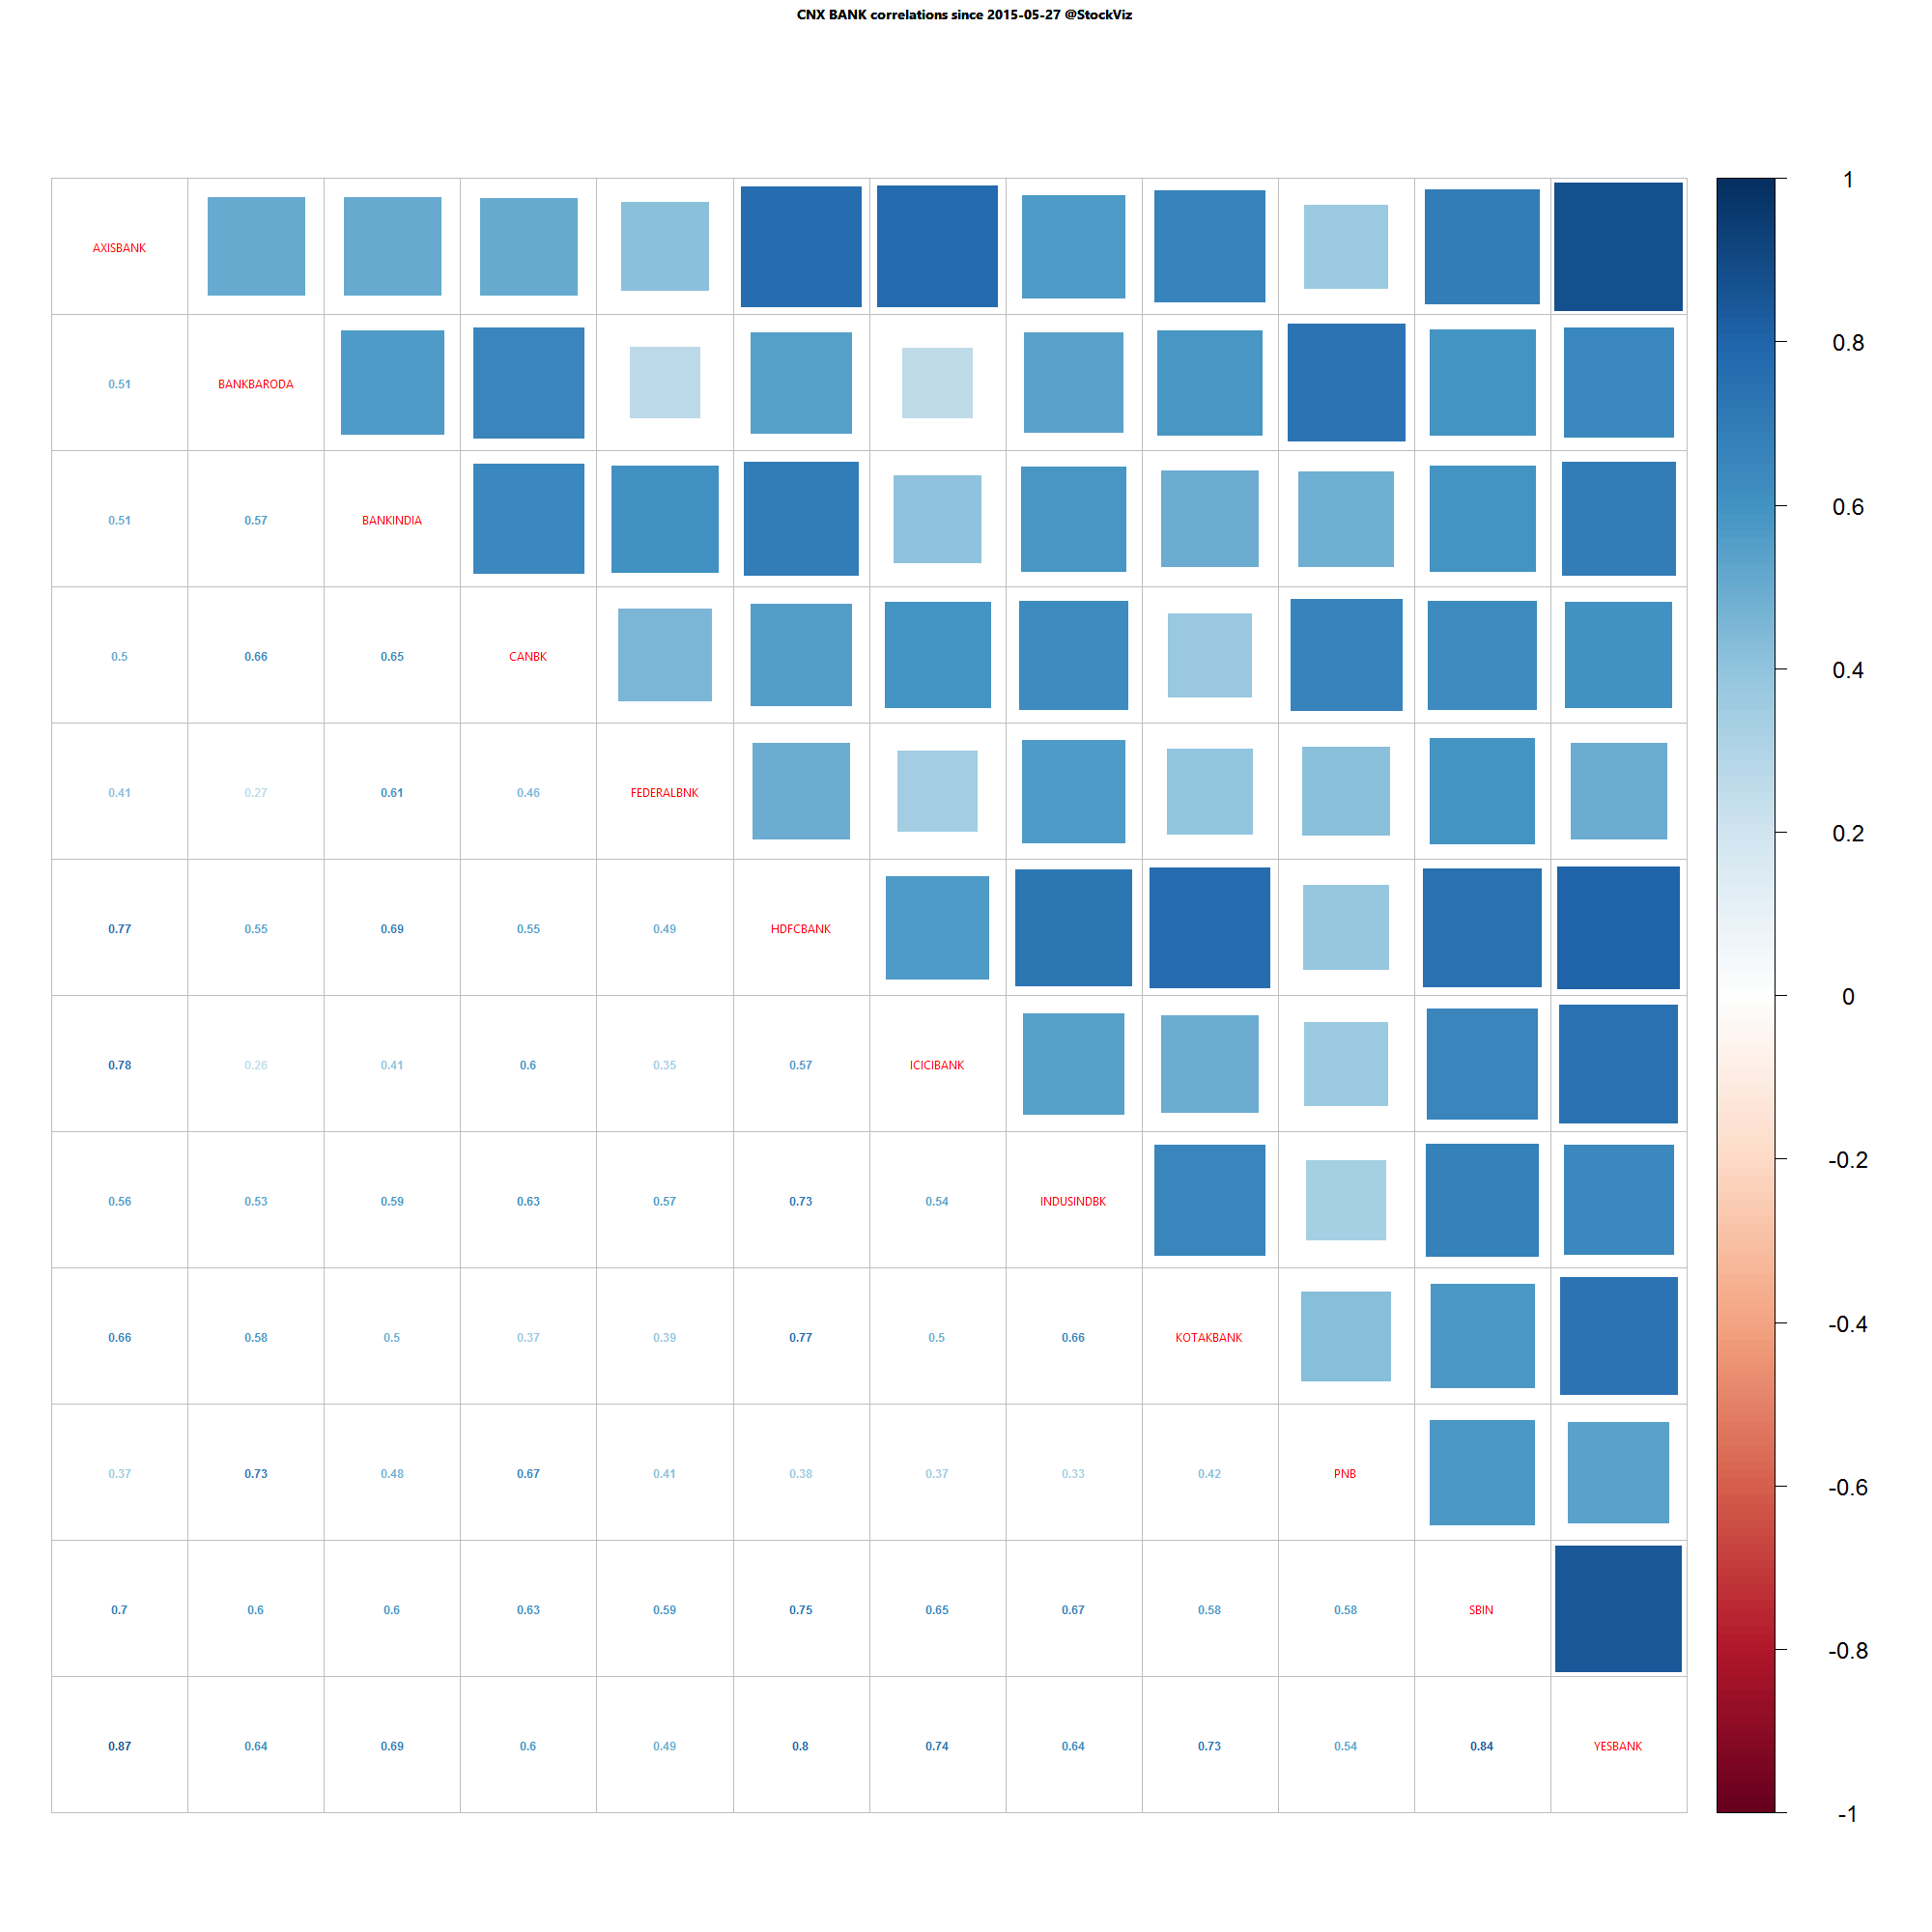
| CNX BANK |
SHORT |
13.01
|
2015-Jan-27
|
| CNX ENERGY |
LONG |
26.08
|
2008-Jan-14
|
| CNX FMCG |
SHORT |
13.23
|
2015-Feb-25
|
| CNX INFRA |
SHORT |
48.68
|
2008-Jan-09
|
| CNX IT |
SHORT |
88.23
|
2000-Feb-21
|
| CNX MEDIA |
LONG |
26.66
|
2008-Jan-04
|
| CNX METAL |
SHORT |
58.84
|
2008-Jan-04
|
| CNX MNC |
SHORT |
5.41
|
2015-Mar-12
|
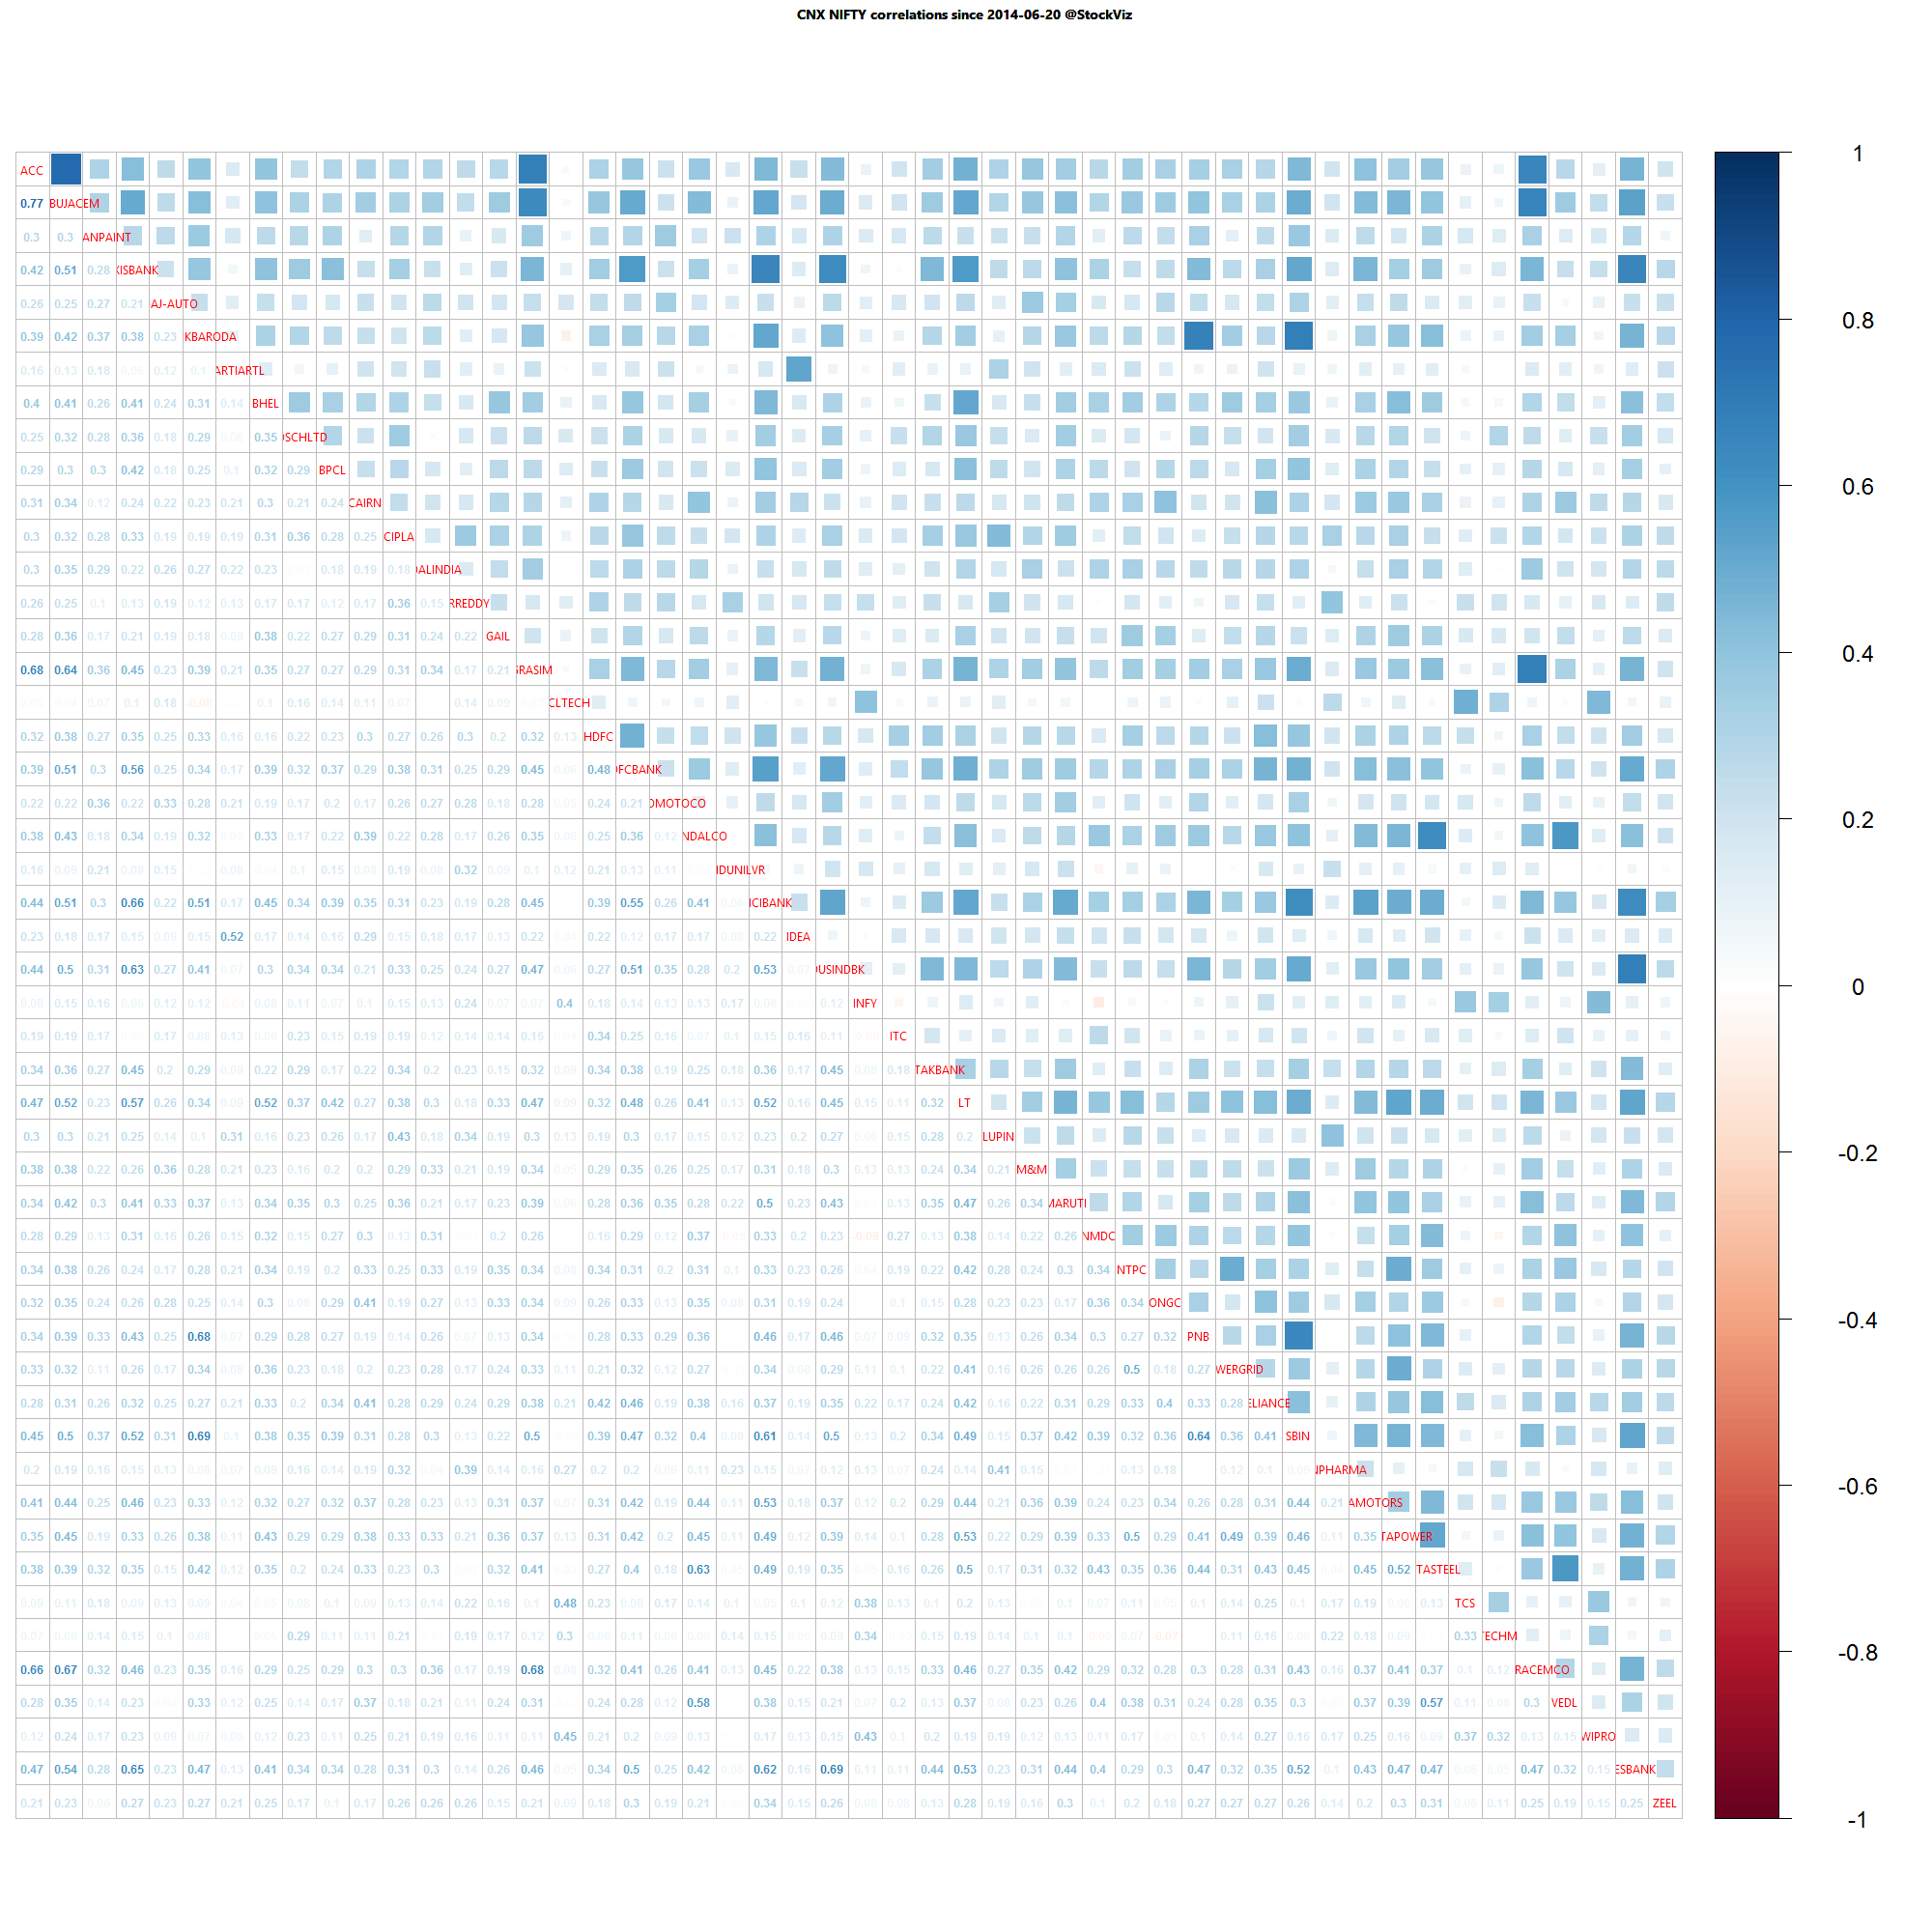
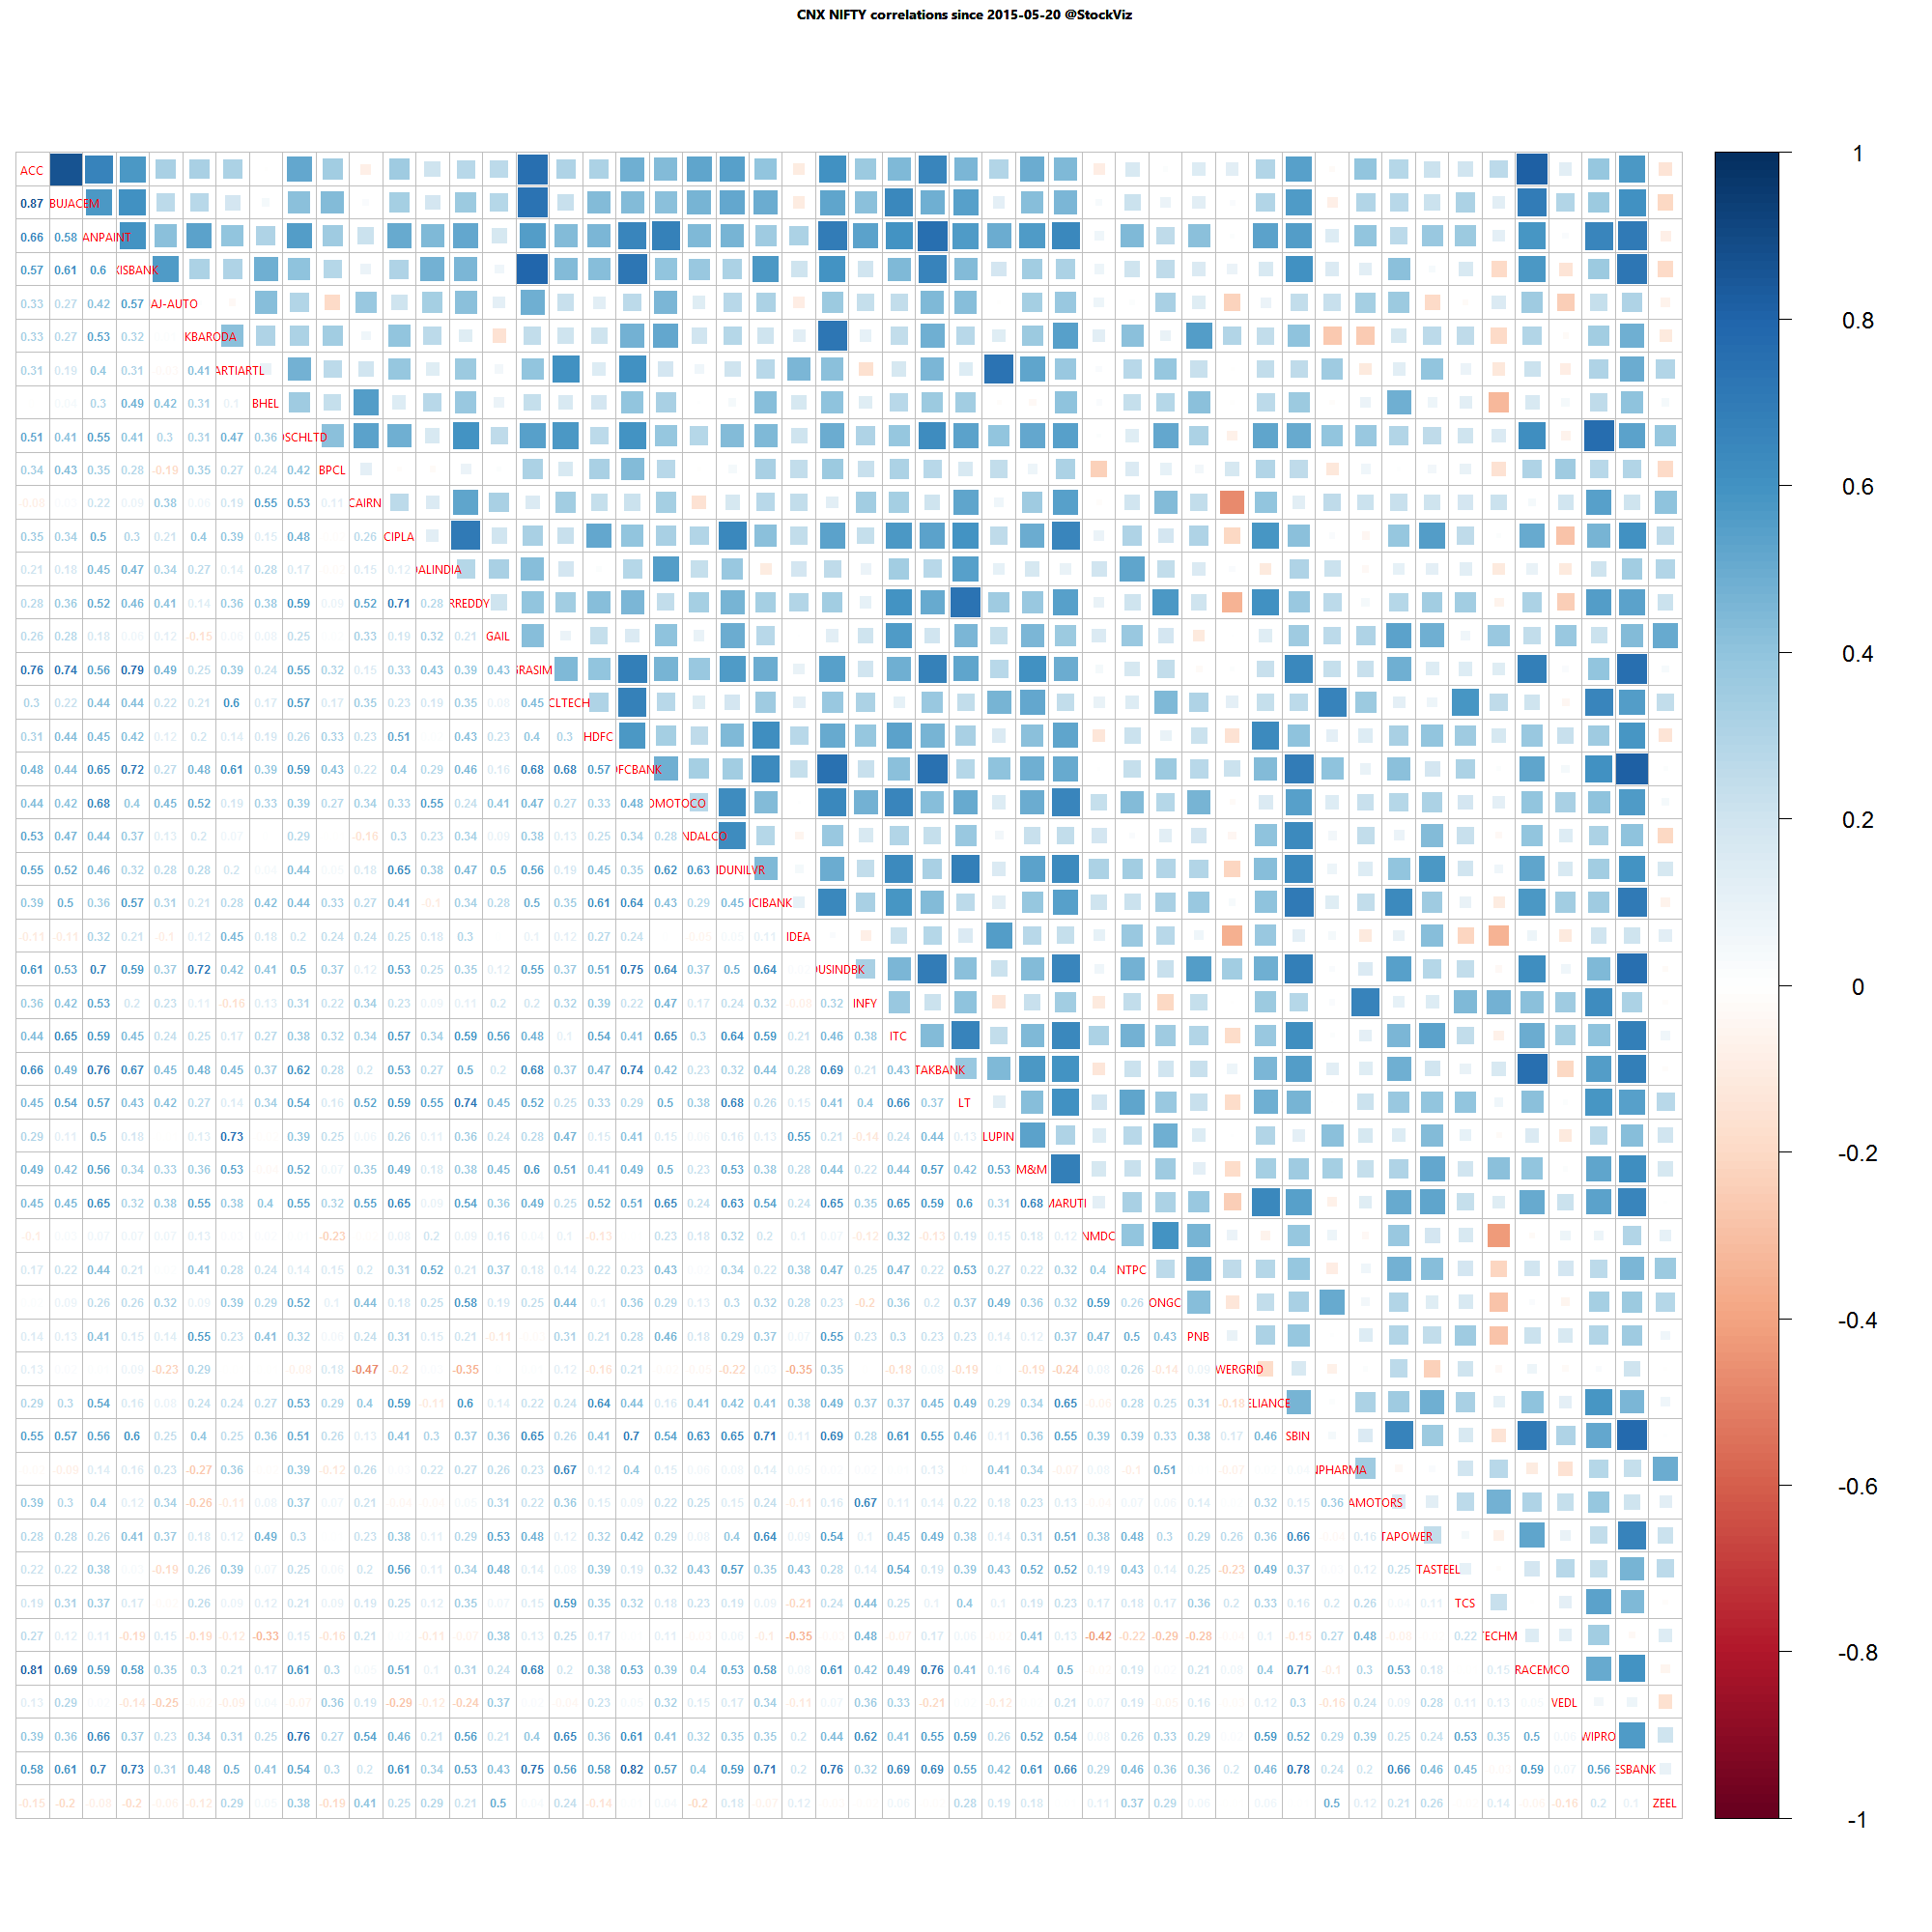
| CNX NIFTY |
SHORT |
8.57
|
2015-Mar-03
|
| CNX PHARMA |
SHORT |
14.61
|
2015-Apr-08
|
| CNX PSE |
SHORT |
25.47
|
2008-Jan-04
|
| CNX REALTY |
SHORT |
90.75
|
2008-Jan-14
|
Looks like Banks, FMCG and Pharma are perking up. MNCs and Autos are recovering from their drawdowns as well…