Author: stockviz

Theme: Acceleration Update 01.12.2015

Introduction

Momentum strategies are based on measures of “speed” – change in price (distance traveled) over a specific unit of time. Acceleration goes one step further and measures the rate of change of momentum. This strategy is relatively new – we set it up in the middle of November. It would be interesting to see how this strategy pans out.

Performance summary

held since returns (%)
8KMILES
2015-Nov-19
+0.54
GODFRYPHLP
2015-Nov-19
+19.06
RAJESHEXPO
2015-Nov-19
+3.81
GAYAPROJ
2015-Nov-19
+9.19
JUBILANT
2015-Nov-19
+2.91
COSMOFILMS
2015-Nov-19
+1.02
RUSHIL
2015-Nov-19
+3.29
MANGALAM
2015-Nov-19
+40.62
HIMATSEIDE
2015-Nov-19
+6.74
ALLSEC
2015-Nov-19
+18.78
TVSELECT
2015-Nov-19
+2.29
NIITLTD
2015-Nov-19
+7.47
PTL
2015-Nov-19
+8.51
ESTER
2015-Nov-19
+8.71
TRIGYN
2015-Nov-19
+25.91
EMMBI
2015-Nov-19
+22.39
TRIDENT
2015-Nov-19
+8.37
GUFICBIO
2015-Nov-19
+24.46
NITCO
2015-Nov-19
+20.29
MERCATOR
2015-Nov-19
+4.63
Since the last rebalance on 2015-Nov-19 till 2015-Nov-30, this strategy has returned +9.70%

You can find more details about the Acceleration Theme here.
Theme: Velocity Update 01.12.2015

Introduction

Our “absolute” momentum strategy is about three months old now and has put in some decent performance numbers. It will be interesting to see how this absolute-momentum strategy compares to relative-momentum over a longer time-frame.

Performance Summary

held since returns (%)
TATAELXSI
2015-Sep-04
+14.98
GAYAPROJ
2015-Sep-04
+88.74
GMBREW
2015-Sep-04
+129.97
SANGAMIND
2015-Sep-04
+25.82
RUSHIL
2015-Sep-04
+108.01
MIRZAINT
2015-Sep-04
+42.70
8KMILES
2015-Oct-06
+0.58
WELSPUNIND
2015-Oct-06
+1.45
DISHMAN
2015-Oct-06
-17.05
SRIPIPES
2015-Oct-06
-1.01
TAKE
2015-Oct-06
+21.04
NCLIND
2015-Oct-06
+45.22
LYKALABS
2015-Oct-06
+59.55
NAVINFLUOR
2015-Nov-02
+8.42
DEEPIND
2015-Nov-02
+6.78
PGEL
2015-Nov-02
-22.91
AEGISCHEM
2015-Nov-02
+7.13
MADHUCON
2015-Nov-02
+2.36
EMMBI
2015-Nov-02
+55.79
IZMO
2015-Nov-02
+36.50
Since the last rebalance on 2015-Nov-02 till 2015-Nov-30, this strategy has returned +9.22%

You can find more details about the Velocity Theme here.

Theme: Momentum Update 01.12.2015

Introduction

Our relative momentum strategy, simply called Momentum, is our longest-running momentum strategy. Between its inception in Aug 2013 and now, it has clocked an impressive +212% translating to an IRR of about +65%.

Performance summary

held since returns (%)
KEI
2015-Aug-10
-3.38
TATAELXSI
2015-Sep-07
+16.24
CAPLIPOINT
2015-Sep-07
-5.33
GAYAPROJ
2015-Sep-07
+88.39
SANGAMIND
2015-Sep-07
+30.35
TAKE
2015-Sep-07
+86.91
MIRZAINT
2015-Sep-07
+46.51
JUBILANT
2015-Oct-06
+5.36
NCLIND
2015-Oct-06
+45.48
NILKAMAL
2015-Nov-02
+5.41
ICIL
2015-Nov-02
+16.02
KPRMILL
2015-Nov-02
+4.05
VADILALIND
2015-Nov-02
+12.26
SRIPIPES
2015-Nov-02
-8.64
NDL
2015-Nov-02
+9.77
LYKALABS
2015-Nov-02
+19.55
NIBL
2015-Nov-02
-1.20
EMMBI
2015-Nov-02
+55.53
IZMO
2015-Nov-02
+37.54
MIC
2015-Nov-02
+13.82
Since the last rebalance on 2015-Nov-02 till 2015-Nov-30, this strategy has returned +13.31%

You can find more details about the Momentum Theme here.

Index Update 28.11.2015

MOMENTUM

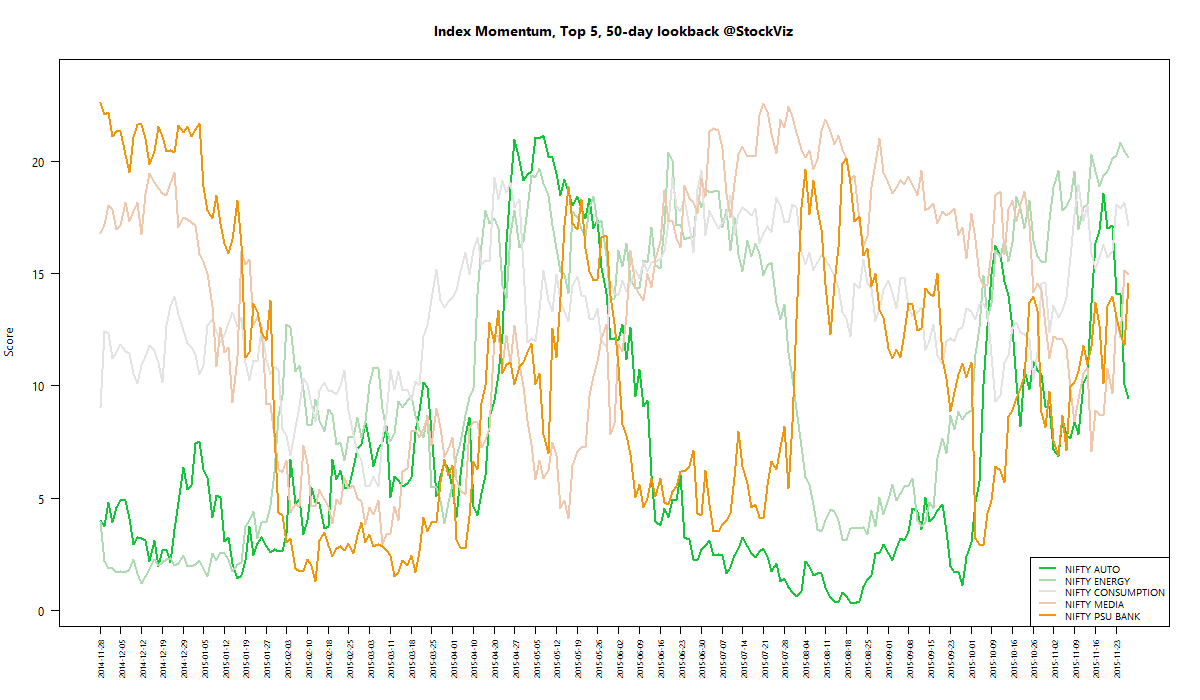
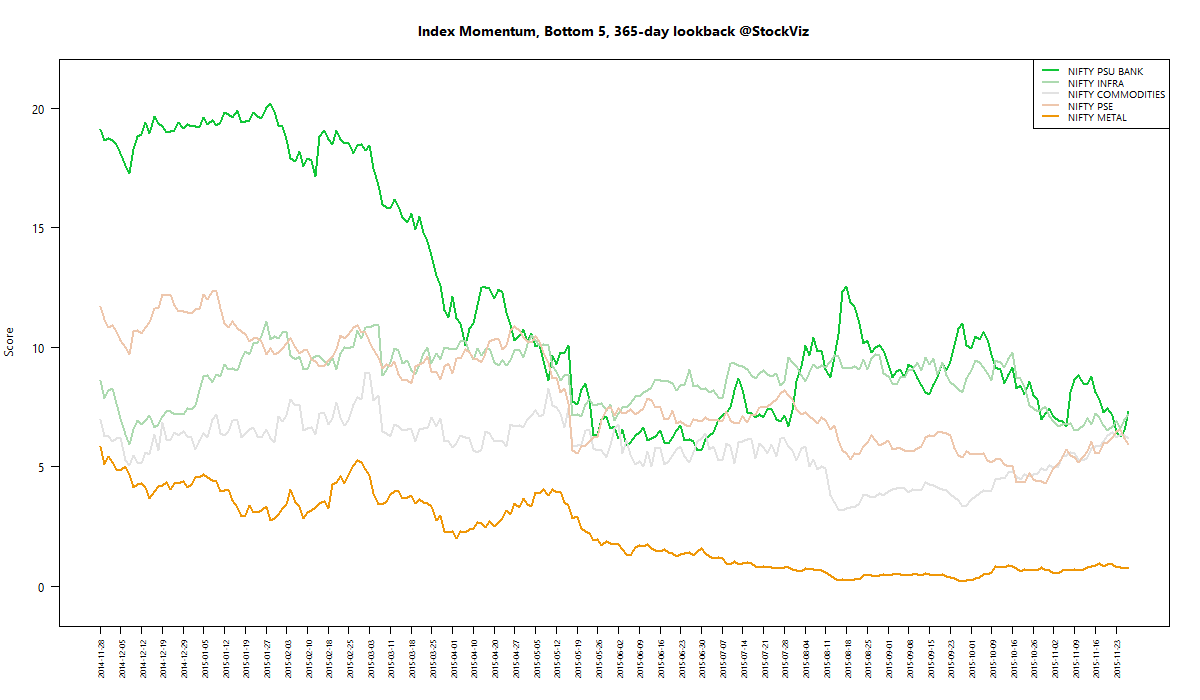
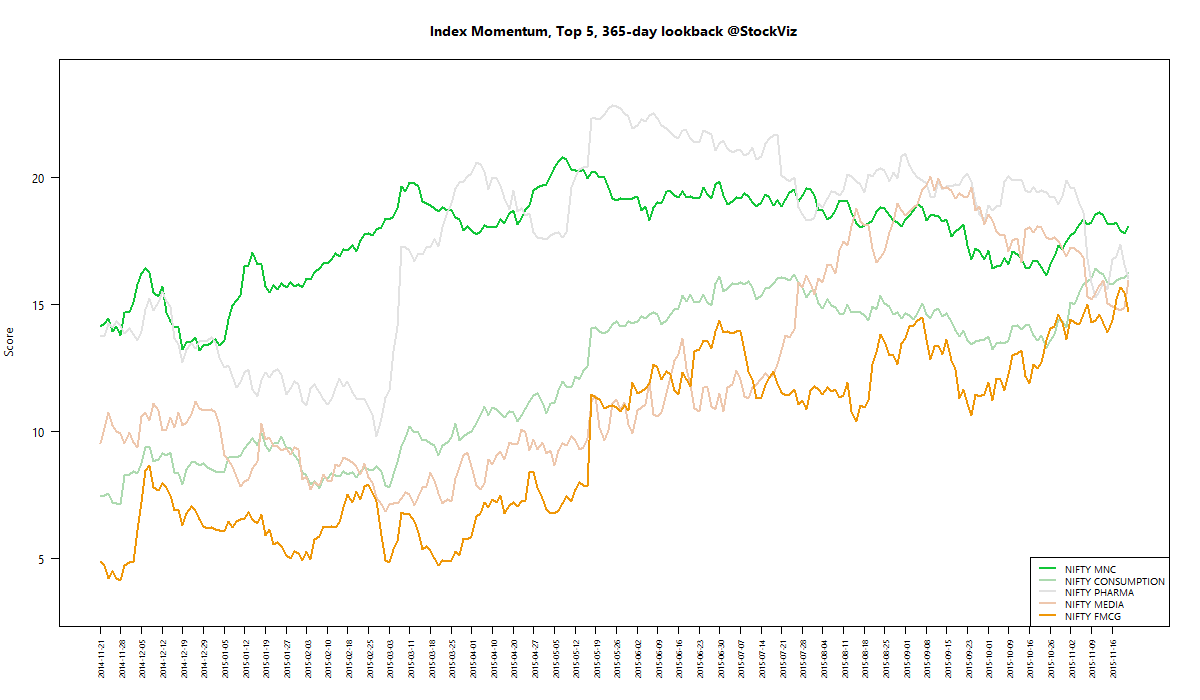
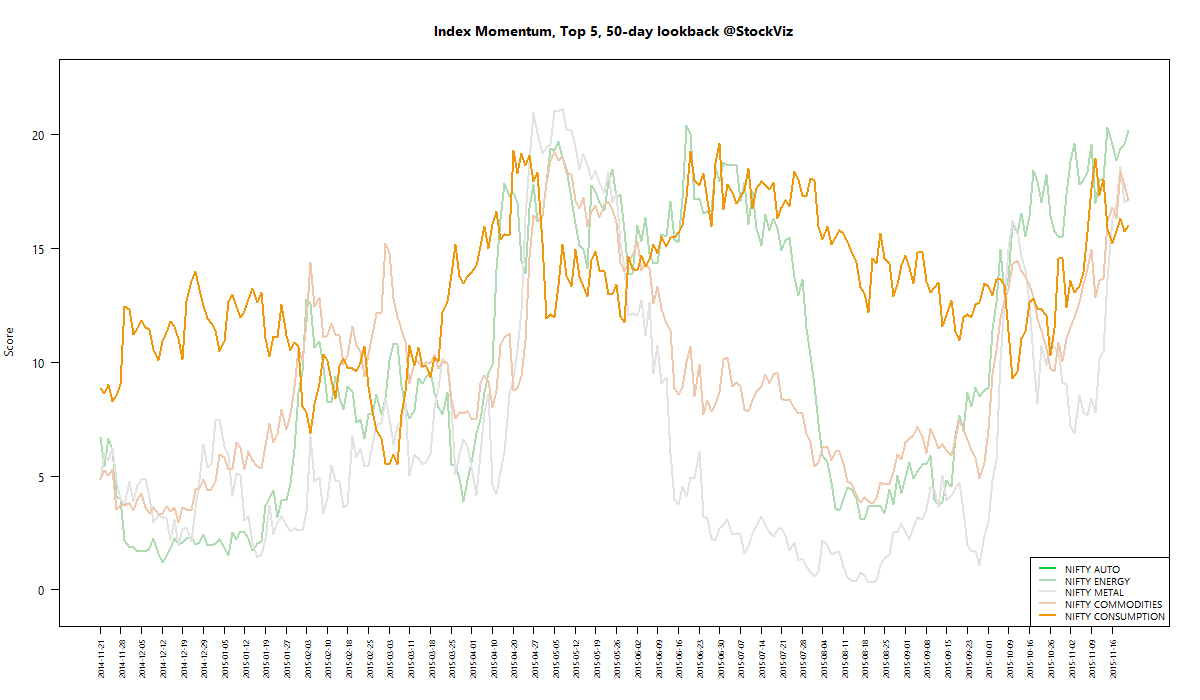
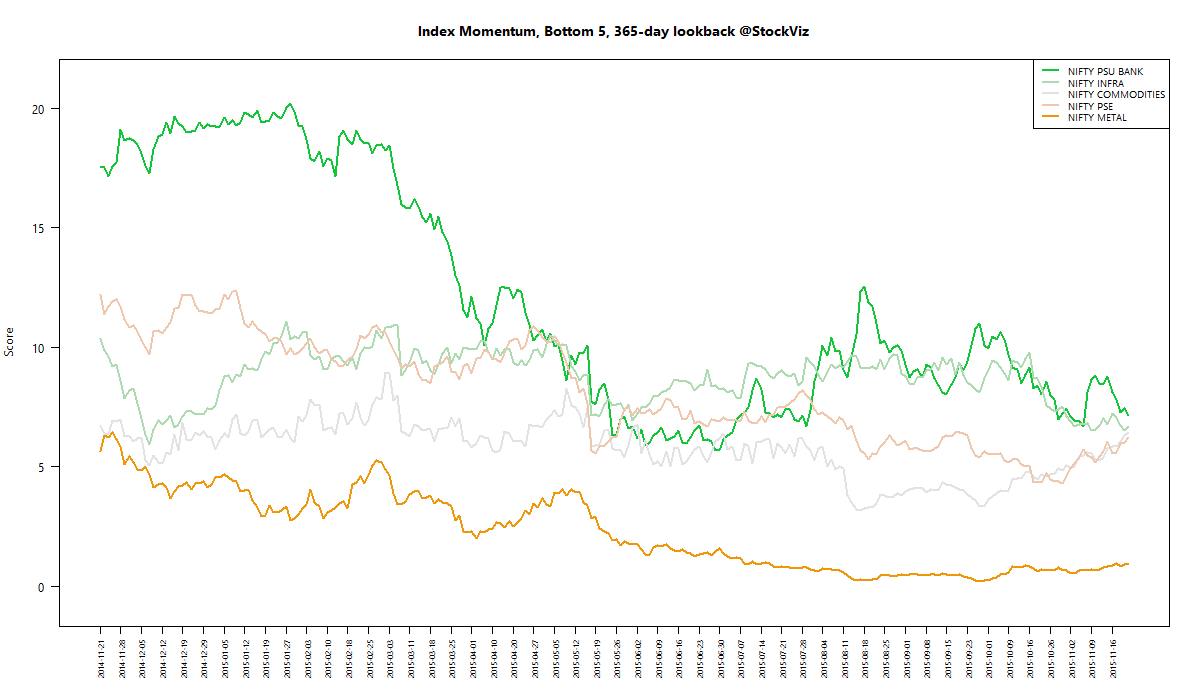
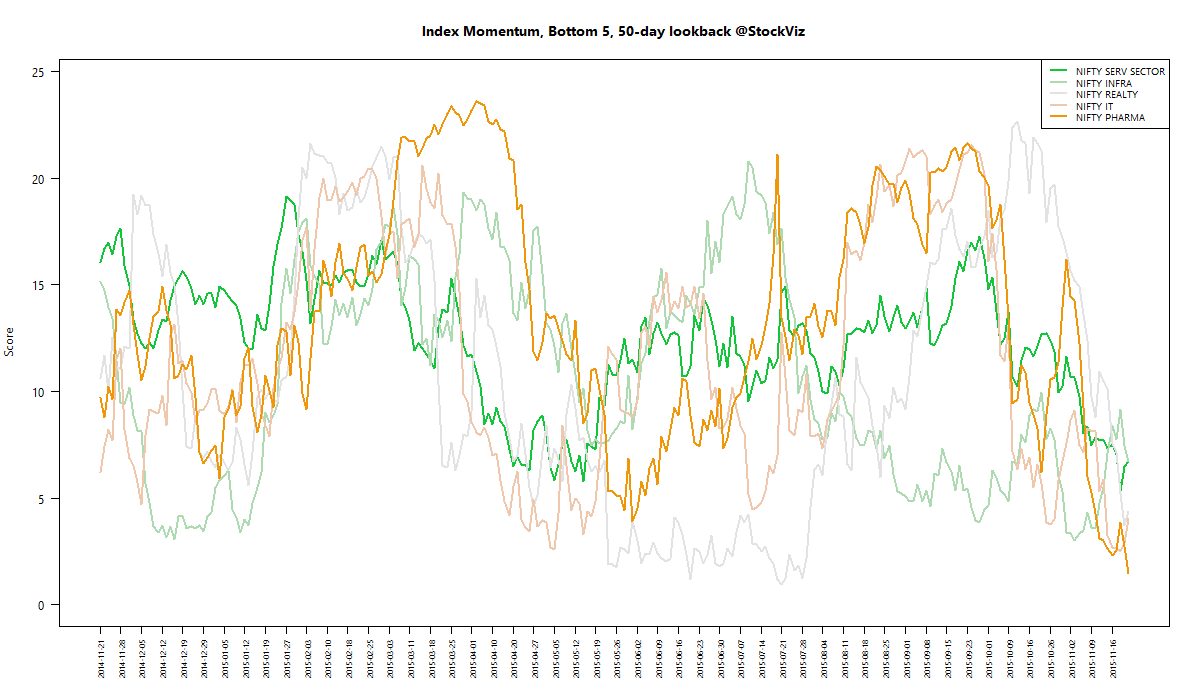
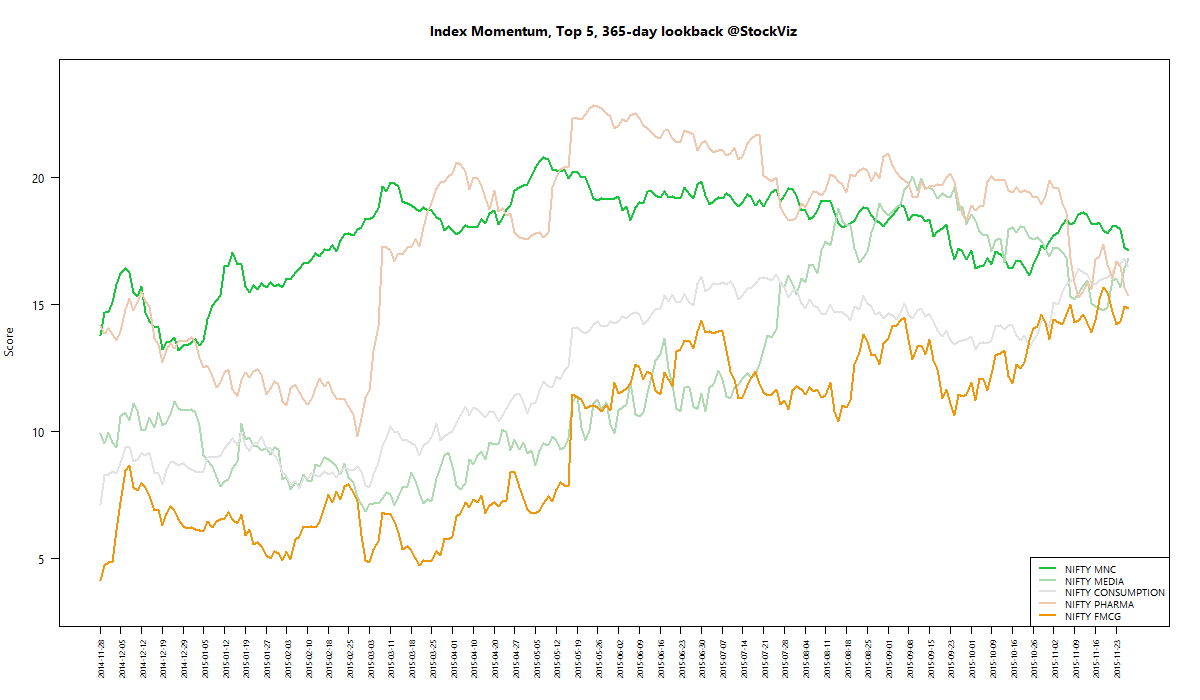
We run our proprietary momentum scoring algorithm on indices just like we do on stocks. You can use the momentum scores of sub-indices to get a sense for which sectors have the wind on their backs and those that are facing headwinds.

Traders can pick their longs in sectors with high short-term momentum and their shorts in sectors with low momentum. Investors can use the longer lookback scores to position themselves using our re-factored index Themes.

You can see how the momentum algorithm has performed on individual stocks here.

Here are the best and the worst sub-indices:

index momentum best 365 2015-11-27 png

index momentum best 50 2015-11-27 png

index momentum worst 365 2015-11-27 png

index momentum worst 50 2015-11-27 png

Relative Strength Spread

NIFTY_500 relative-spread-index 50 2015-11-27 png

Refactored Index Performance

50-day performance, from September 10, 2015 through November 27, 2015:

Trend Model Summary

Index Signal % From Peak Day of Peak
NIFTY AUTO LONG
7.21
2015-Jan-27
NIFTY BANK SHORT
15.49
2015-Jan-27
NIFTY COMMODITIES SHORT
35.90
2008-Jan-04
NIFTY CONSUMPTION LONG
4.30
2015-Aug-05
NIFTY ENERGY LONG
31.03
2008-Jan-14
NIFTY FIN SERVICE SHORT
13.83
2015-Jan-28
NIFTY FMCG SHORT
8.34
2015-Feb-25
NIFTY INFRA SHORT
55.79
2008-Jan-09
NIFTY IT SHORT
88.35
2000-Feb-21
NIFTY MEDIA LONG
17.55
2008-Jan-04
NIFTY METAL SHORT
68.40
2008-Jan-04
NIFTY MNC SHORT
10.52
2015-Aug-10
NIFTY PHARMA SHORT
16.37
2015-Apr-08
NIFTY PSE SHORT
34.30
2008-Jan-04
NIFTY PSU BANK SHORT
40.16
2010-Nov-05
NIFTY REALTY SHORT
90.89
2008-Jan-14
NIFTY SERV SECTOR SHORT
12.35
2015-Mar-03
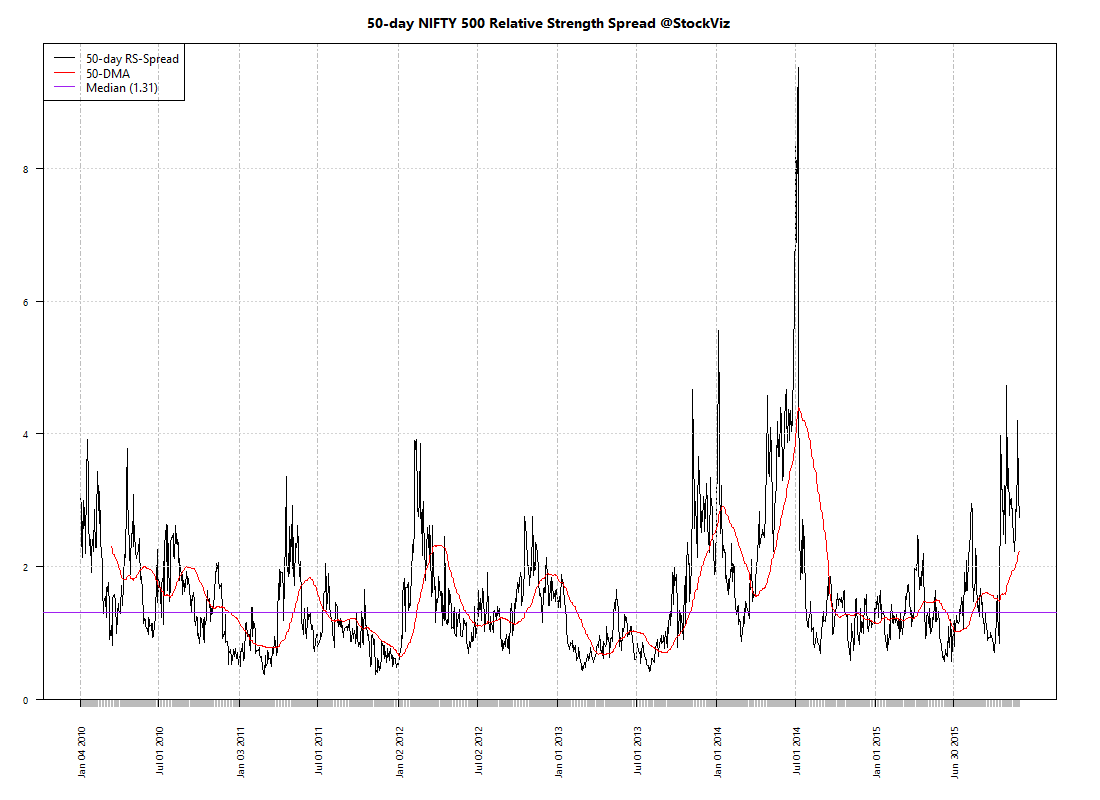
Large RS-Spreads are a net positive to active strategies. The past week saw Quality to Price post over +250% and Momentum post over +200% gains since their inception in August 2013.

Index Update 21.11.2015

MOMENTUM

We run our proprietary momentum scoring algorithm on indices just like we do on stocks. You can use the momentum scores of sub-indices to get a sense for which sectors have the wind on their backs and those that are facing headwinds.

Traders can pick their longs in sectors with high short-term momentum and their shorts in sectors with low momentum. Investors can use the longer lookback scores to position themselves using our re-factored index Themes.

You can see how the momentum algorithm has performed on individual stocks here.

Here are the best and the worst sub-indices:

index momentum best 365 2015-11-20 png

index momentum best 50 2015-11-20 png

index momentum worst 365 2015-11-20 png

index momentum worst 50 2015-11-20 png

Relative Strength Spread

NIFTY_500 relative-spread-index 50 2015-11-20 png

Refactored Index Performance

50-day performance, from September 04, 2015 through November 20, 2015:

Trend Model Summary

Index Signal % From Peak Day of Peak
NIFTY AUTO SHORT
8.35
2015-Jan-27
NIFTY BANK SHORT
17.03
2015-Jan-27
NIFTY COMMODITIES LONG
36.30
2008-Jan-04
NIFTY CONSUMPTION SHORT
5.11
2015-Aug-05
NIFTY ENERGY SHORT
32.35
2008-Jan-14
NIFTY FIN SERVICE SHORT
15.36
2015-Jan-28
NIFTY FMCG SHORT
8.28
2015-Feb-25
NIFTY INFRA SHORT
56.17
2008-Jan-09
NIFTY IT LONG
88.36
2000-Feb-21
NIFTY MEDIA LONG
19.97
2008-Jan-04
NIFTY METAL SHORT
68.58
2008-Jan-04
NIFTY MNC SHORT
9.35
2015-Aug-10
NIFTY PHARMA LONG
15.51
2015-Apr-08
NIFTY PSE LONG
34.98
2008-Jan-04
NIFTY PSU BANK LONG
41.92
2010-Nov-05
NIFTY REALTY LONG
91.28
2008-Jan-14
NIFTY SERV SECTOR LONG
13.63
2015-Mar-03
Is there a dash-for-trash thing going on where the beaten-down, heavily leveraged sectors are finding a bid? Look at the recent performance of INFRA and ENERGY. Is this a blip or a fundamental shift?