Author: shyam

Practical Momentum Part III – Hedging

Introduction

In Part II of our Practical Momentum series, we saw how adding a volatility adjustment significantly improved portfolio returns. However, we were left with a nagging observation that long-only returns were much higher than long-short returns. The problem with a long-only futures portfolio is that draw-downs can wipe you out. But what if we hedged the portfolio?

You can hedge a portfolio in two ways: (a) buy individual put options, and (b) calculate the beta of the portfolio and short an appropriate multiple of NIFTY futures. The problem with option (b) is that it will not protect you against idiosyncratic risk. For example, say you are long a pharma stock and the USFDA issues an import alert, the stock will tank irrespective of the NIFTY. So for the purposes of this simulation, we will try option (a)

Hedged Long-Only Momentum

With 5 long-futures hedged with long put-options below the purchase price:

black line shows long-only; red shows hedged long-only

hedged.momentum

A portfolio hedged with single-name put options performs poorly:

  • There is always a d between the option payout and the underlying
  • ?-decay eats away more of the option value than the protection it offers

Another way to make draw-downs shallower is to diversify. When we increased the number of stocks in our long-only equity momentum portfolio from 10 to 20, it reduced portfolio volatility and boosted returns. Here’s how a 10-count long-only momentum portfolio compares with the 5 from above:

black line shows a 5-item long-only portfolio returns; red shows 10
five10.momentum

Conclusion

The problem with leveraged momentum is that losses can wipe you out. Hedging it with single-name options doesn’t work. Are we stuck with unlevered momentum? We will explore this in the next post. Stay tuned!

Practical Momentum, Part II – Volatility Adjustment

Introduction

Previously, we ran back-tests on long-only and long-short momentum algorithm over a couple of look-back periods. We found that (a) momentum with a one-year look-back period out-performed one with a 100-day look-back, and (b) a long-only portfolio significantly out-performed a long-short portfolio. We hypothesize that this is probably because the universe of stocks that we are forced to consider was heavily plucked. But what if we added a volatility metric into the mix to smooth out draw-downs?

Long-only Momentum

First, lets take a look at the long-only portfolio; both with a one-year look-back:

The red line is the volatility adjusted momentum; black is naive momentum; and green is buy & hold Nifty
long-only-momentum.volatility.2005-2010

long-only-momentum.volatility.2011-2014.

By year:

long-only-momentum2
Adding volatility into the mix did nothing to drawdowns but boosted returns considerably – with volatility adjusted momentum out-performing the naive version in 7 out of 10 years.

Long-short Momentum

Long-short ended up under-performing long-only once again:

The red line is long-short momentum; black is long-only momentum; and green is buy & hold Nifty
long-short-momentum.volatility.2005-2010

long-short-momentum.volatility.2011-2014

By year:

long-short-momentum2

Conclusion

Over the long run, long-only momentum with volatility adjustment outperformed the long-short version. However, while long-only tanked with the rest of the market in 2008, long-short was in the green. So if you are one of those guys who ask “how did this strategy perform in 2008?” Well, it performed pretty well. But would you have stuck by it when it got shellacked in 2013?

The problem with steep drawdowns is that it makes implementing the strategy with derivatives or leverage difficult. Margin calls might force you to abandon the strategy just before it turns. Next, we will explore a hedged long-only momentum strategy. Stay tuned!

Weekly Recap: Discipline > Motivation

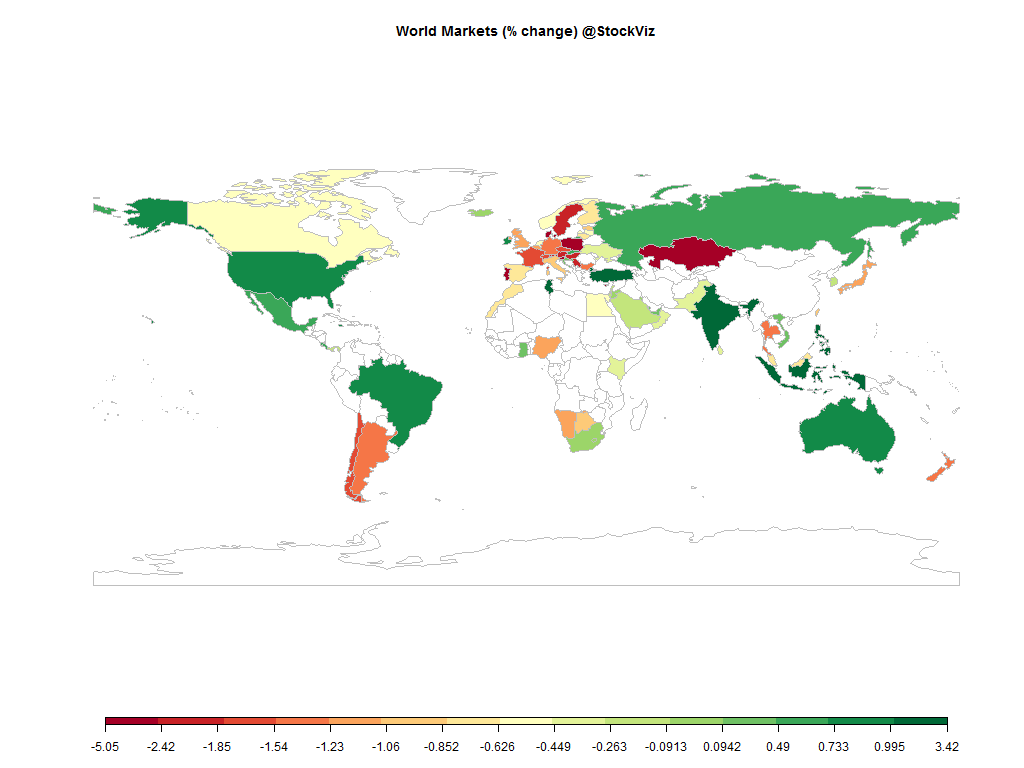
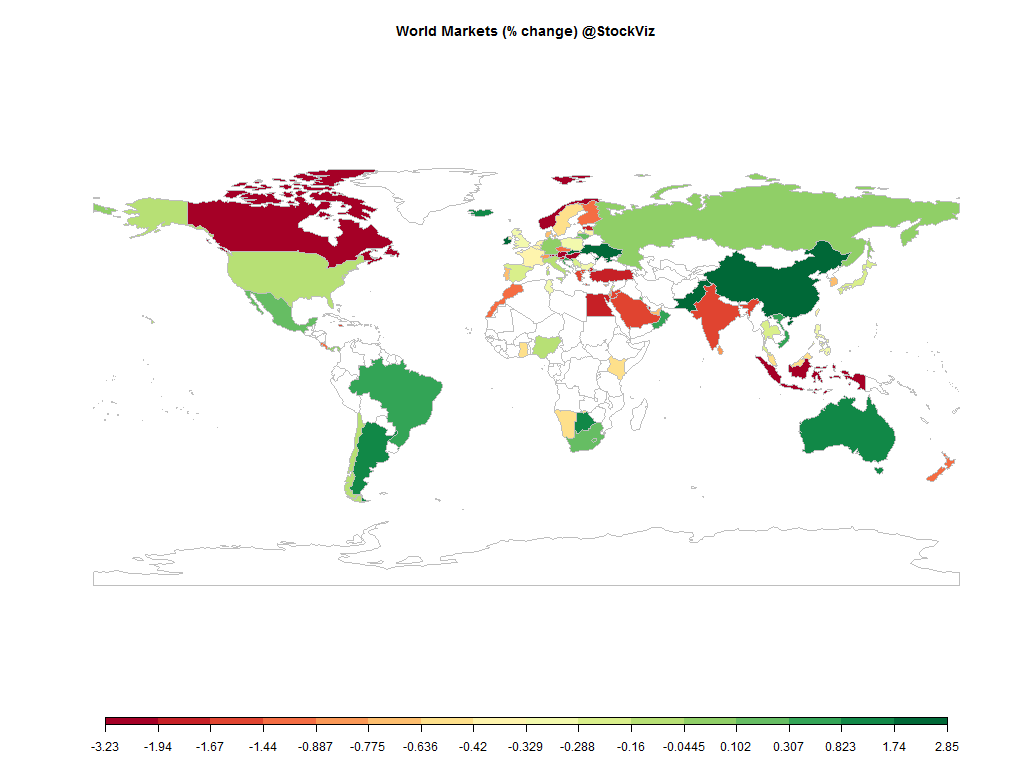
world.2015-05-08.2015-05-15

Equities

Major
DAX(DEU) -2.24%
CAC(FRA) -1.90%
UKX(GBR) -1.23%
NKY(JPN) +1.83%
SPX(USA) +0.43%
MINTs
JCI(IDN) +0.87%
INMEX(MEX) +0.56%
NGSEINDX(NGA) +0.15%
XU030(TUR) +4.55%
BRICS
IBOV(BRA) +0.50%
SHCOMP(CHN) +2.44%
NIFTY(IND) +0.86%
INDEXCF(RUS) -1.00%
TOP40(ZAF) +0.46%

Commodities

Energy
Heating Oil +2.84%
Natural Gas +5.05%
Brent Crude Oil +2.55%
Ethanol +1.51%
RBOB Gasoline +3.42%
WTI Crude Oil +1.20%
Metals
Palladium -0.93%
Platinum +2.16%
Copper +0.68%
Gold 100oz +3.18%
Silver 5000oz +6.71%

Currencies

USDEUR:-2.16% USDJPY:-0.45%

MINTs
USDIDR(IDN) -0.28%
USDMXN(MEX) -0.89%
USDNGN(NGA) -0.82%
USDTRY(TUR) -4.46%
BRICS
USDBRL(BRA) +0.33%
USDCNY(CHN) -0.05%
USDINR(IND) -0.66%
USDRUB(RUS) -2.79%
USDZAR(ZAF) -1.12%
Agricultural
Feeder Cattle +1.40%
Lumber +1.75%
Soybean Meal -3.65%
Soybeans -3.18%
Sugar #11 -3.45%
Cattle +0.69%
Cocoa +4.19%
Coffee (Arabica) +4.51%
Coffee (Robusta) -0.82%
Corn +1.74%
Cotton +0.77%
Wheat +9.13%
White Sugar -3.70%
Lean Hogs +2.88%
Orange Juice -1.46%

Credit Indices

Index Change
Markit CDX EM +0.26%
Markit CDX NA HY +0.04%
Markit CDX NA IG -0.31%
Markit iTraxx Asia ex-Japan IG -1.75%
Markit iTraxx Australia -1.61%
Markit iTraxx Europe -0.96%
Markit iTraxx Europe Crossover +2.25%
Markit iTraxx Japan -1.42%
Markit iTraxx SovX Western Europe -0.36%
Markit LCDX (Loan CDS) -0.05%
Markit MCDX (Municipal CDS) +2.36%
The S&P 500 made new highs – probably because rate hikes are now getting pushed back to 2016 given the sorry state of the US economy.

However, bond yields elsewhere surged higher on increasing optimism about the prospects for global economic growth. And yields may keep climbing as easy foreign central bank policies raise expectations for growth and inflation. (Schwab)

Expect more volatility ahead.

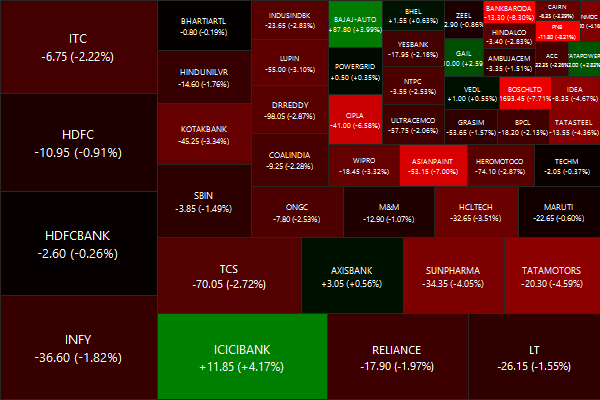
Nifty Heatmap

CNX NIFTY.2015-05-08.2015-05-15

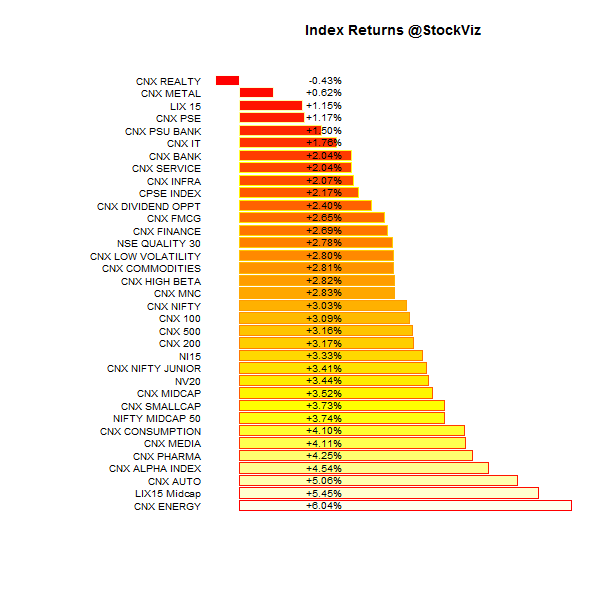
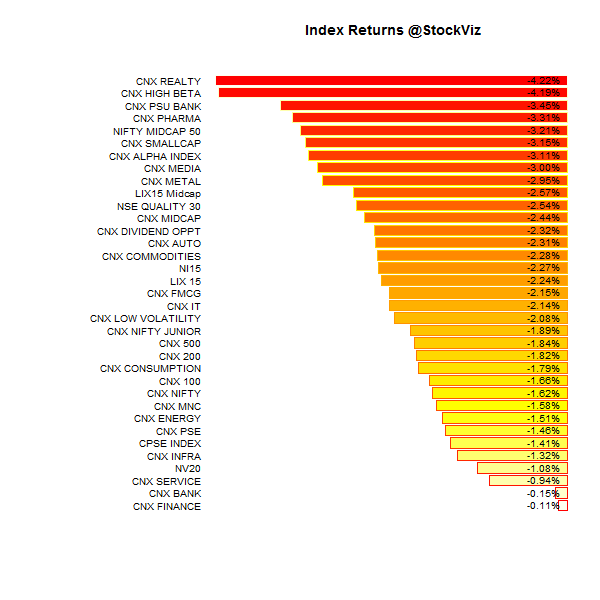
Index Returns

For a deeper dive into indices, check out our weekly Index Update.
index performance.2015-05-08.2015-05-15

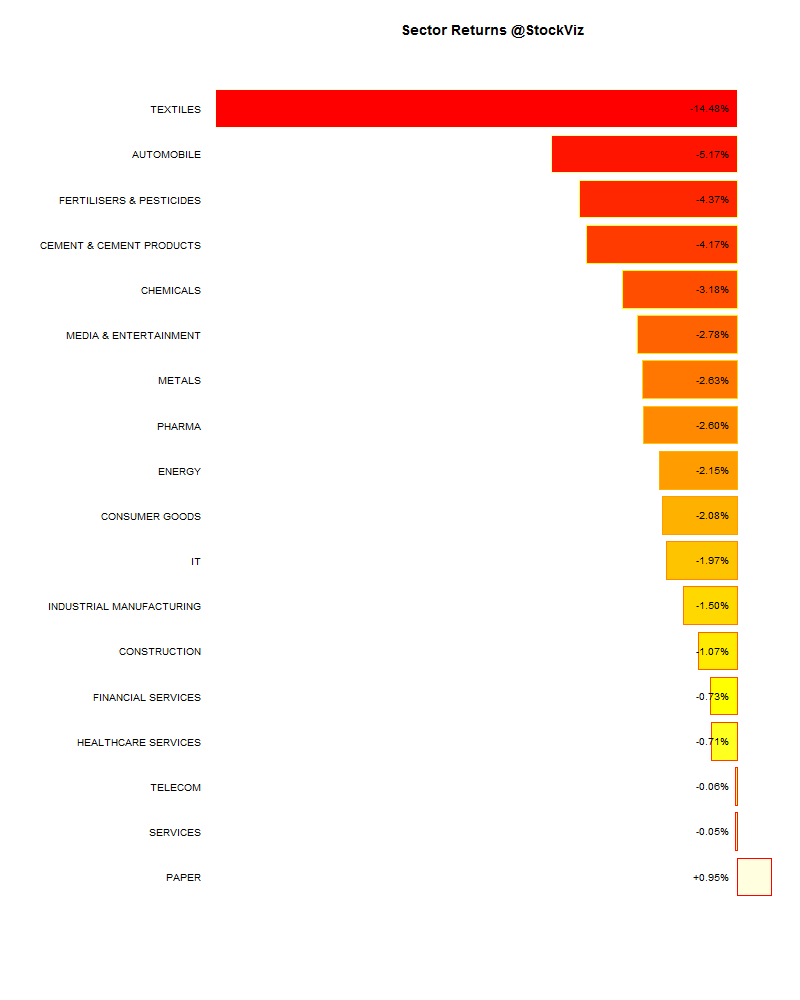
Sector Performance

sector performance.2015-05-08.2015-05-15

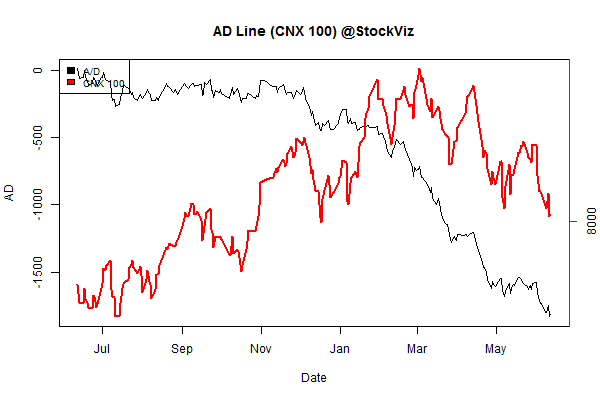
Advance Decline

advance.decline.line2.2015-05-08.2015-05-15

Market Cap Decile Performance

Decile Mkt. Cap. Adv/Decl
1 (micro) -3.11% 63/63
2 +2.40% 64/65
3 +3.08% 63/64
4 +3.44% 67/61
5 +4.35% 71/56
6 +3.88% 74/54
7 +2.57% 65/63
8 +2.44% 68/59
9 +3.13% 65/63
10 (mega) +3.67% 65/63
Green across the board. Hopefully this marks a turning point in the markets…

Top Winners and Losers

MCDOWELL-N +11.86%
EICHERMOT +18.64%
UNIONBANK +23.06%
HINDUNILVR -5.63%
LUPIN -4.86%
NTPC -4.15%
Eicher Motor reminded investors that it still had a whole clip of silver bullets left…

ETF Performance

PSUBNKBEES +7.07%
JUNIORBEES +4.43%
BANKBEES +2.76%
CPSEETF +2.14%
GOLDBEES +1.72%
NIFTYBEES +1.41%
INFRABEES +0.36%
PSU banks staged a surprise snap-back rally after being beaten to a pulp over the last couple of months. Will it sustain?

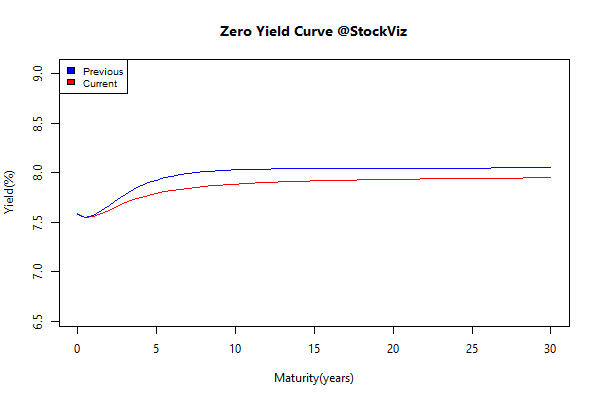
Yield Curve

yieldCurve.2015-05-08.2015-05-15

Bond Indices

Sub Index Change in YTM Total Return(%)
GSEC TB +1.23 -0.22%
GSEC SUB 1-3 +1.04 -1.65%
GSEC SUB 3-8 +0.61 -2.63%
GSEC SUB 8 +0.42 -3.37%
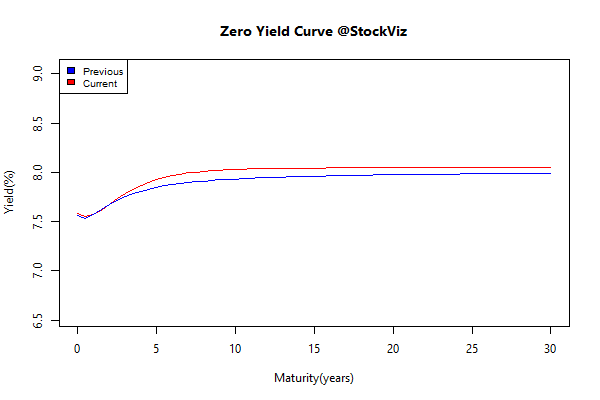
Indian bonds sold off, following the bond carnage in Europe…

Investment Theme Performance

Equity Mutual Funds

Bond Mutual Funds

Thought for the weekend

Motivation, broadly speaking, operates on the erroneous assumption that a particular mental or emotional state is necessary to complete a task.

Discipline, by contrast, separates outwards functioning from moods and feelings and thereby ironically circumvents the problem by consistently improving them.

You don’t wait until you’re in olympic form to start training. You train to get into olympic form.

Source: Screw motivation, what you need is discipline.

Practical Momentum, Part I

Introduction

Momentum effects are one of the premier anomalies in the market and we have been running an equity long-only momentum strategy since 2013 with returns of +64.44% vs. Nifty’s +27.25% so far. Given the success of long-only equity momentum, we were curious as to how a long-short version of it would perform in India given our unique constraints. And also investigate if its success could be replicated using derivatives.

Typically, academic research that discuss momentum tide over the difficulty involved in shorting stocks. In India, you can only short stocks through SLBS in quantities that are multiples of the lot-size. And only those stocks that are allowed in the F&O segment can be borrowed for selling short. In order to overcome these constraints, we restricted our universe of stocks to only those that have been in the F&O segment since Jan 2004. There are grand total of 97 stocks that fit this criteria.

The biggest problem with choosing such a restricted universe is survivorship bias. One can argue that the stocks that survived from 2004 through 2015 and had enough liquidity to be listed in F&O would have stronger long-term momentum than those that do not. If this is true, then it doesn’t make sense going short. We will see if this hypothesis is confirmed in our back-test.

Long-only Momentum

Typically, momentum strategies are run using a one-year look-back period. We wanted to check what kind of impact shorter look-back periods had on overall returns. The following results are for going long (equally weighted) the top 5 stocks in our universe at the beginning of every month and holding it for one month.

The red line is the one-year look-back momentum; black is 100-day look-back momentum; and green is buy & hold Nifty
long-only-momentum.2005-2010

long-only-momentum.2011-2014

By year:

long-only-momentum

Long-short Momentum

You would think that shorting “weak” stocks should give returns comparable to going long “strong” stocks. But that doesn’t seem to be the case. The short-portfolio was always a drag on performance and made returns more volatile.

long-short-momentum.2005-2010

long-short-momentum.2011-2014

Conclusion

A long-only momentum strategy with a one-year look-back beat the pants out of both the Nifty and the long-short strategy. This could be because the pool of stocks in F&O show strong survivorship bias. We will continue to investigate if the short portfolio can be made more efficient. Stay tuned!

Weekly Recap: Holacracy

world.2015-04-30.2015-05-08

Equities

Major
DAX(DEU) +2.23%
CAC(FRA) +0.87%
UKX(GBR) +1.24%
NKY(JPN) -0.39%
SPX(USA) +1.47%
MINTs
JCI(IDN) +1.88%
INMEX(MEX) +1.62%
NGSEINDX(NGA) -0.92%
XU030(TUR) +0.33%
BRICS
IBOV(BRA) +1.64%
SHCOMP(CHN) -5.31%
NIFTY(IND) +0.12%
INDEXCF(RUS) +1.20%
TOP40(ZAF) -0.99%

Commodities

Energy
Heating Oil -0.83%
Natural Gas +5.22%
Brent Crude Oil -1.76%
WTI Crude Oil -0.18%
Ethanol +1.91%
RBOB Gasoline -2.24%
Metals
Platinum -0.08%
Copper +1.04%
Palladium +2.72%
Gold 100oz +0.38%
Silver 5000oz +1.86%

Currencies

USDEUR:+0.01% USDJPY:+0.13%

MINTs
USDIDR(IDN) +1.15%
USDMXN(MEX) -1.55%
USDNGN(NGA) +0.16%
USDTRY(TUR) +0.78%
BRICS
USDBRL(BRA) -1.32%
USDCNY(CHN) +0.10%
USDINR(IND) +0.81%
USDRUB(RUS) -1.29%
USDZAR(ZAF) +0.10%
Agricultural
White Sugar +1.17%
Coffee (Robusta) -2.17%
Corn -0.83%
Feeder Cattle -0.72%
Soybean Meal -1.53%
Soybeans +0.36%
Sugar #11 +1.22%
Wheat -0.21%
Cattle -5.08%
Cotton -2.85%
Lean Hogs +5.52%
Lumber -7.84%
Orange Juice +1.21%
Cocoa -0.45%
Coffee (Arabica) -3.79%

Credit Indices

Index Change
Markit CDX EM -0.03%
Markit CDX NA HY -0.59%
Markit CDX NA IG +2.67%
Markit iTraxx Asia ex-Japan IG -0.22%
Markit iTraxx Australia +0.48%
Markit iTraxx Europe +1.76%
Markit iTraxx Europe Crossover +10.94%
Markit iTraxx Japan +2.28%
Markit iTraxx SovX Western Europe -0.21%
Markit LCDX (Loan CDS) +0.00%
Markit MCDX (Municipal CDS) +0.35%
Can you believe that after all the drama, the NIFTY actually ended this week in the green?

Nifty Heatmap

CNX NIFTY.2015-04-30.2015-05-08

Index Returns

For a deeper dive into indices, check out our weekly Index Update.
index performance.2015-04-30.2015-05-08

Sector Performance

sector performance.2015-04-30.2015-05-08

Advance Decline

advance.decline.line2.2015-04-30.2015-05-08

Market Cap Decile Performance

Decile Mkt. Cap. Adv/Decl
1 (micro) -3.91% 60/69
2 -6.40% 64/64
3 -3.74% 63/65
4 -2.57% 58/70
5 -3.22% 55/73
6 -3.93% 54/74
7 -3.29% 56/72
8 -2.15% 64/63
9 -3.23% 57/71
10 (mega) -2.96% 66/63
Outside the NIFTY, things looked bad across the board…

Top Winners and Losers

HINDALCO +8.05%
BAJAJ-AUTO +8.95%
ABIRLANUVO +19.35%
SRTRANSFIN -18.54%
BANKBARODA -14.14%
EXIDEIND -10.61%
Nuvo rallied on retail merger plans…

ETF Performance

CPSEETF +0.42%
NIFTYBEES -0.14%
GOLDBEES -0.81%
INFRABEES -1.51%
JUNIORBEES -2.32%
BANKBEES -3.84%
PSUBNKBEES -4.45%
PSU banks got shellacked…

Yield Curve

yield Curve.2015-04-30.2015-05-08

Bond Indices

Sub Index Change in YTM Total Return(%)
GSEC TB -1.07 +0.50%
GSEC SUB 1-3 -0.77 +1.81%
GSEC SUB 3-8 -0.63 +2.30%
GSEC SUB 8 -0.28 +2.63%
Coupons kept the dream alive…

Investment Theme Performance

Equity Mutual Funds

Bond Mutual Funds

Thought for the weekend

Zappos, an online shoe retailer, announced that the company was eliminating managers and attempting to make Zappos “a fully self-organized, self-managed organization by combining a variety of different tools and processes.” The move to self organize involves the adoption of Holacracy, a system of governance that emphasizes the distribution of authority.

Subsequently, about 14% of the company’s workforce, or 210 out of 1,503 employees, quit.

Source: Zappos Watches 210 Employees Self-Manage Themselves Out The Door