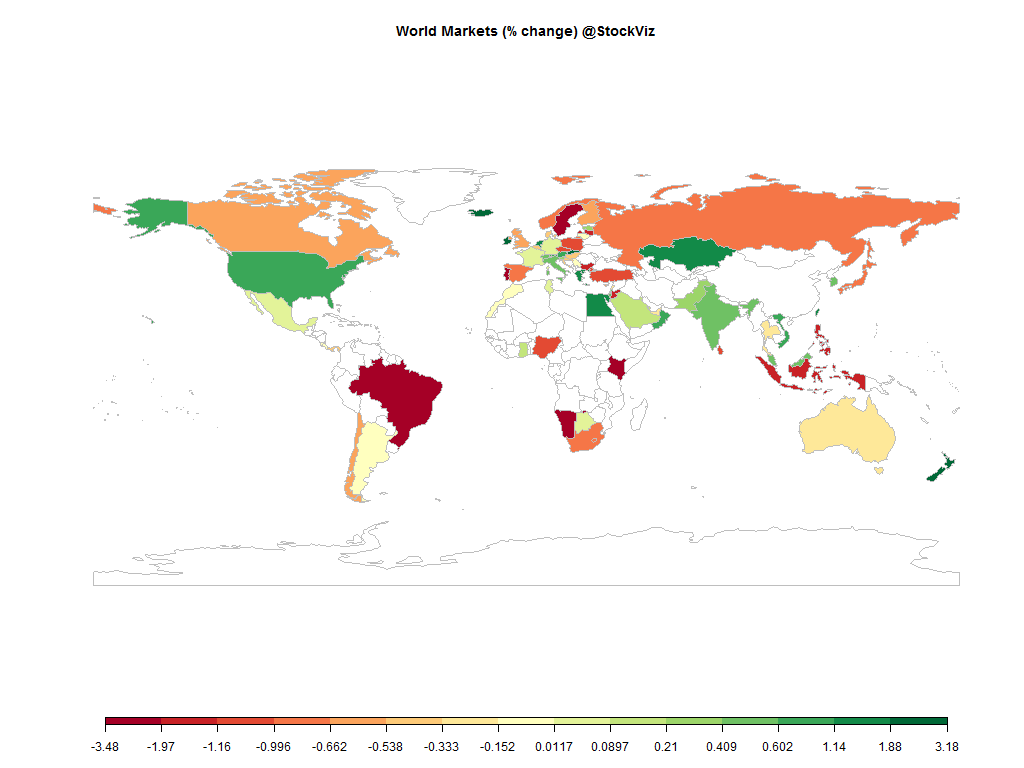
Equities
| MINTs | |
|---|---|
| JCI(IDN) | -1.47% |
| INMEX(MEX) | +0.07% |
| NGSEINDX(NGA) | -1.10% |
| XU030(TUR) | -1.05% |
| BRICS | |
|---|---|
| IBOV(BRA) | -3.27% |
| SHCOMP(CHN) | +6.54% |
| NIFTY(IND) | +0.59% |
| INDEXCF(RUS) | -0.66% |
| TOP40(ZAF) | -0.73% |
Commodities
| Energy | |
|---|---|
| Brent Crude Oil | -4.00% |
| Ethanol | -0.20% |
| Natural Gas | -3.08% |
| RBOB Gasoline | -6.00% |
| WTI Crude Oil | -4.35% |
| Heating Oil | -5.54% |
| Metals | |
|---|---|
| Copper | -0.41% |
| Palladium | -1.68% |
| Gold 100oz | +1.96% |
| Platinum | +3.61% |
| Silver 5000oz | +2.53% |
Currencies
| MINTs | |
|---|---|
| USDIDR(IDN) | +0.95% |
| USDMXN(MEX) | -0.17% |
| USDNGN(NGA) | -0.05% |
| USDTRY(TUR) | -0.71% |
| BRICS | |
|---|---|
| USDBRL(BRA) | +5.00% |
| USDCNY(CHN) | +0.14% |
| USDINR(IND) | +0.12% |
| USDRUB(RUS) | -0.53% |
| USDZAR(ZAF) | -1.93% |
| Agricultural | |
|---|---|
| Cotton | +3.23% |
| Feeder Cattle | +2.54% |
| Lean Hogs | -11.45% |
| Wheat | -2.75% |
| Orange Juice | +18.33% |
| Soybeans | +1.64% |
| Cocoa | +1.34% |
| Coffee (Arabica) | -4.16% |
| Coffee (Robusta) | -0.49% |
| Corn | -1.24% |
| Soybean Meal | +1.76% |
| Sugar #11 | +0.70% |
| Cattle | +4.10% |
| Lumber | +5.94% |
| White Sugar | +0.05% |
Credit Indices
| Index | Change |
|---|---|
| Markit CDX NA HY | -0.72% |
| Markit CDX NA IG | +3.83% |
| Markit iTraxx Asia ex-Japan IG | -4.14% |
| Markit iTraxx Australia | -2.90% |
| Markit iTraxx Europe | -1.84% |
| Markit iTraxx Europe Crossover | +4.46% |
| Markit iTraxx Japan | -0.38% |
| Markit iTraxx SovX Western Europe | +0.27% |
| Markit LCDX (Loan CDS) | +0.00% |
| Markit MCDX (Municipal CDS) | +0.56% |
Risk ON like Donkey Kong this week. All that money that fled EMs fearing a Fed rate hike is finding its way back…
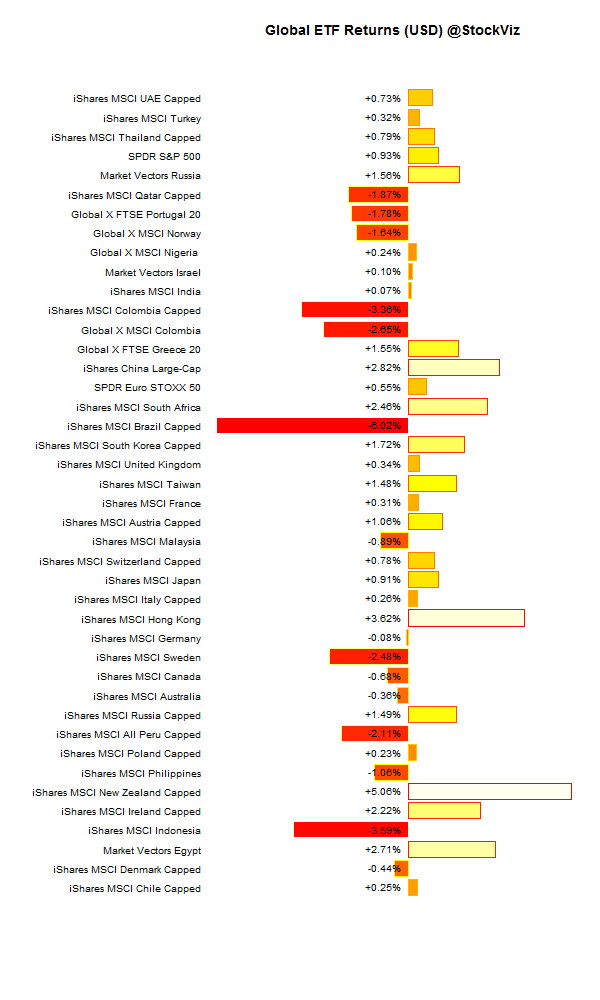
Global ETFs (USD)
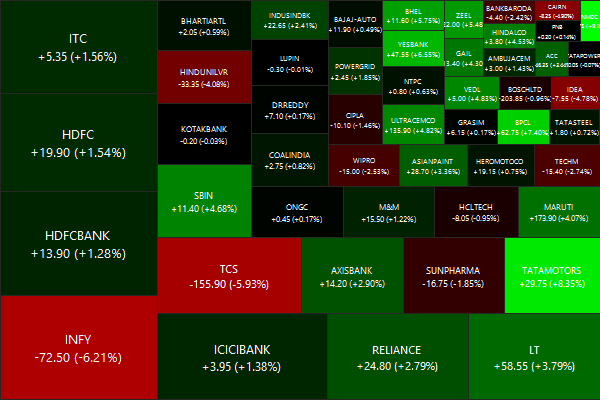
Nifty Heatmap
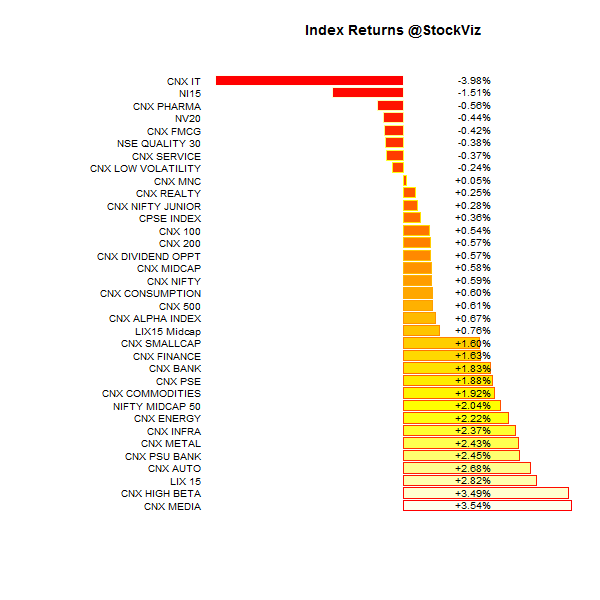
Index Returns
For a deeper dive into indices, check out our weekly Index Update.
Market Cap Decile Performance
| Decile | Mkt. Cap. | Adv/Decl |
|---|---|---|
| 1 (micro) | +1.34% | 76/59 |
| 2 | +3.26% | 81/53 |
| 3 | +3.42% | 72/62 |
| 4 | +3.84% | 73/62 |
| 5 | +2.85% | 75/59 |
| 6 | +2.42% | 76/58 |
| 7 | +2.29% | 72/63 |
| 8 | +2.89% | 73/61 |
| 9 | +0.95% | 73/61 |
| 10 (mega) | +0.47% | 75/60 |
Midcaps outperformed large caps…
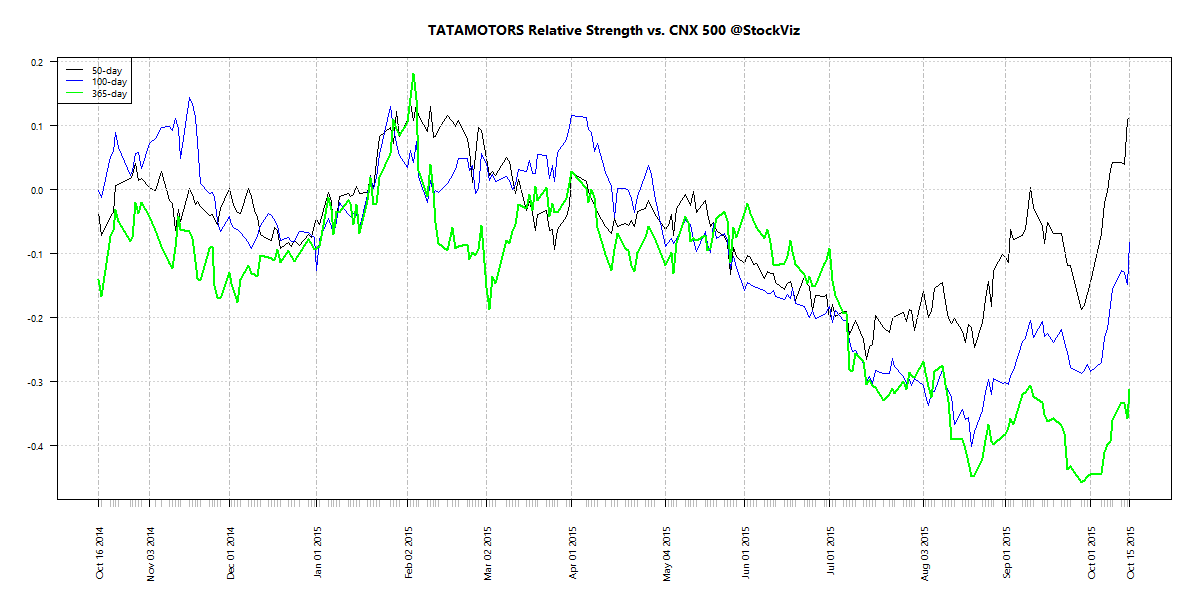
Top Winners and Losers
IT guys got hit buy a bus…
ETF Performance
| INFRABEES | +3.03% |
| BANKBEES | +1.98% |
| PSUBNKBEES | +1.66% |
| GOLDBEES | +1.50% |
| NIFTYBEES | +0.67% |
| JUNIORBEES | +0.55% |
| CPSEETF | +0.32% |
Green zoned…
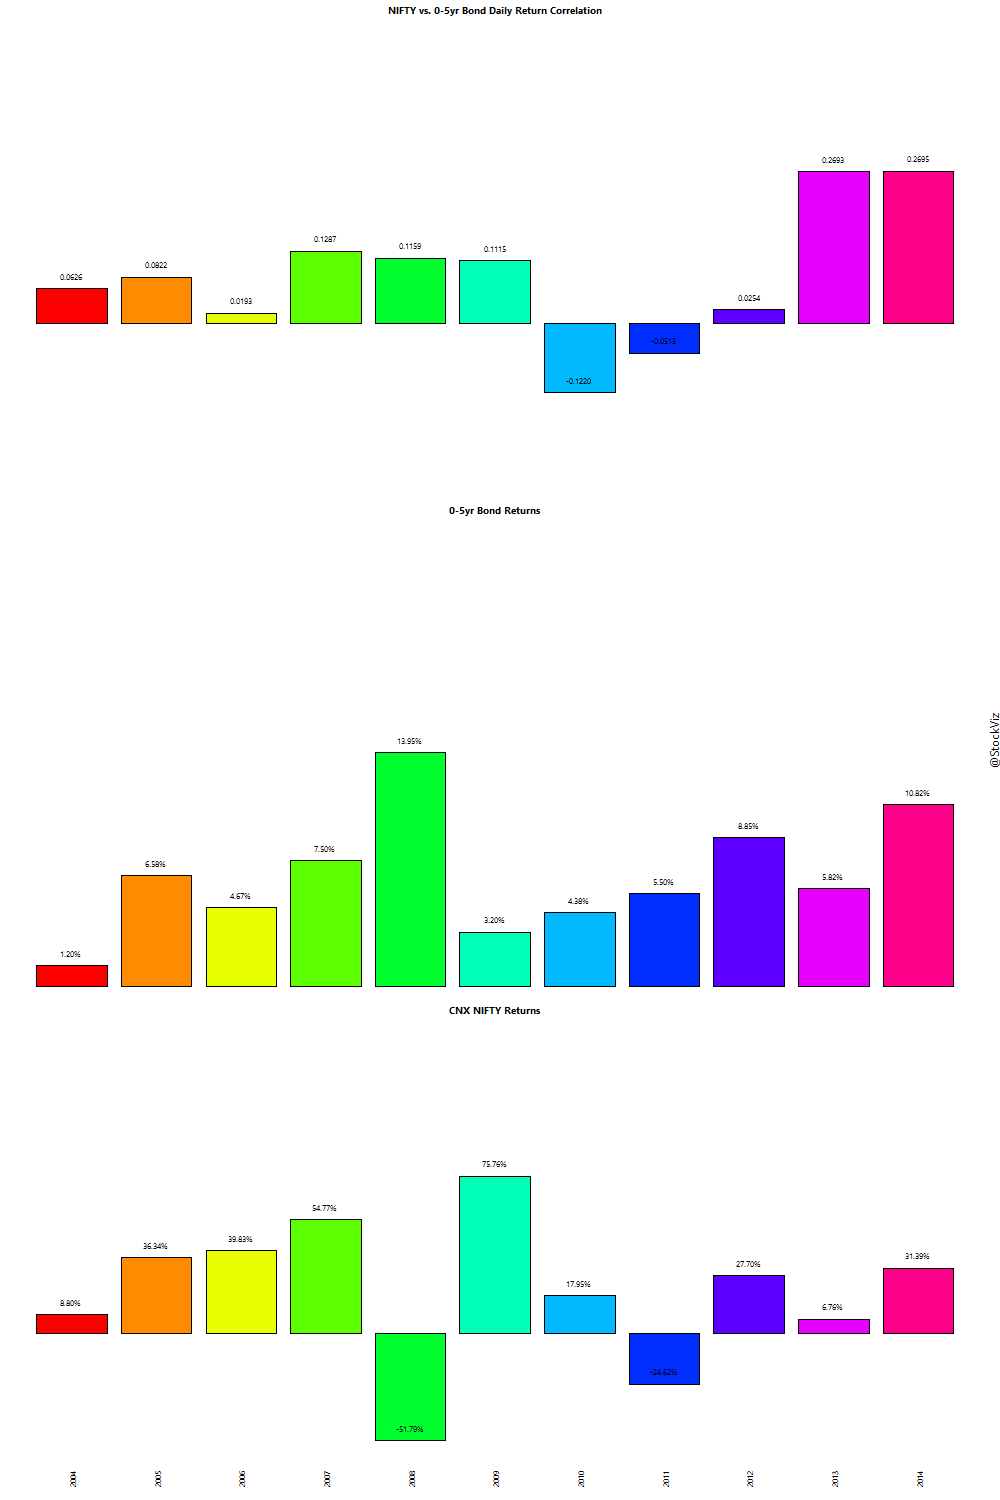
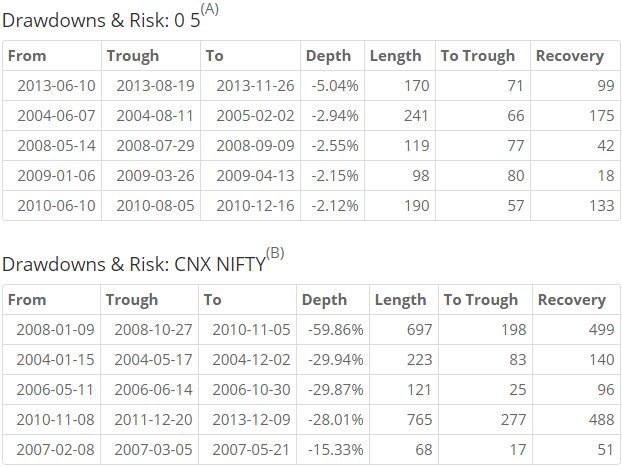
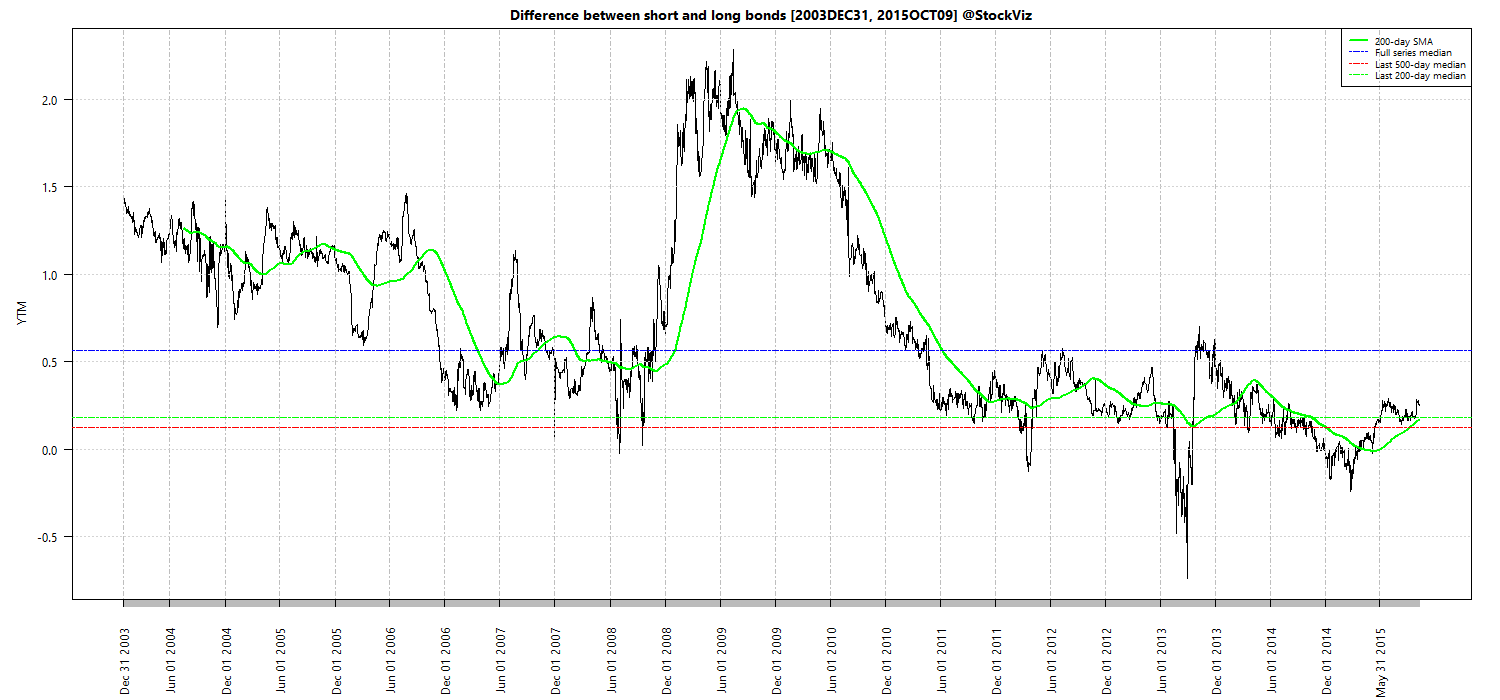
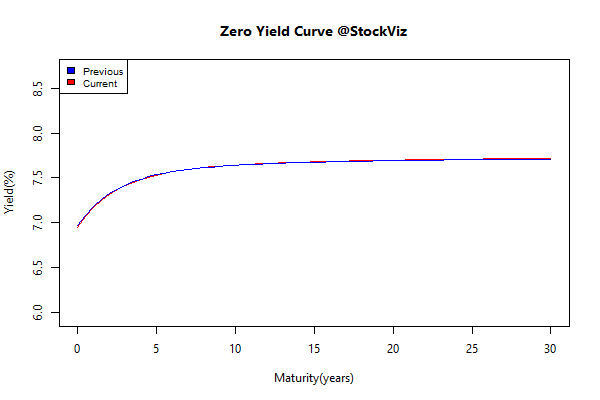
Yield Curve
Bond Indices
| Sub Index | Change in YTM | Total Return(%) |
|---|---|---|
| 0 5 | -0.01 | +0.16% |
| 5 10 | +0.02 | +0.05% |
| 10 15 | +0.03 | -0.04% |
| 15 20 | +0.00 | +0.13% |
| 20 30 | -0.03 | +0.41% |
The curve remained unchanged…
Investment Theme Performance
| ADAG stocks | +6.64% |
| The RBI Restricted List | +6.35% |
| High Beta | +4.09% |
| Magic Formula | +3.83% |
| PPFAS Long Term Value | +3.49% |
| Quality to Price | +3.15% |
| Financial Strength Value | +1.48% |
| Momentum | +1.38% |
| Velocity | +0.87% |
| Tactical CNX 100 | +0.06% |
| Balance Sheet Strength | -0.30% |
| Next Trillion | -0.42% |
| ASK Life | -0.52% |
| Enterprise Yield | -0.71% |
| Low Volatility | -1.50% |
High beta took off like a rocket…
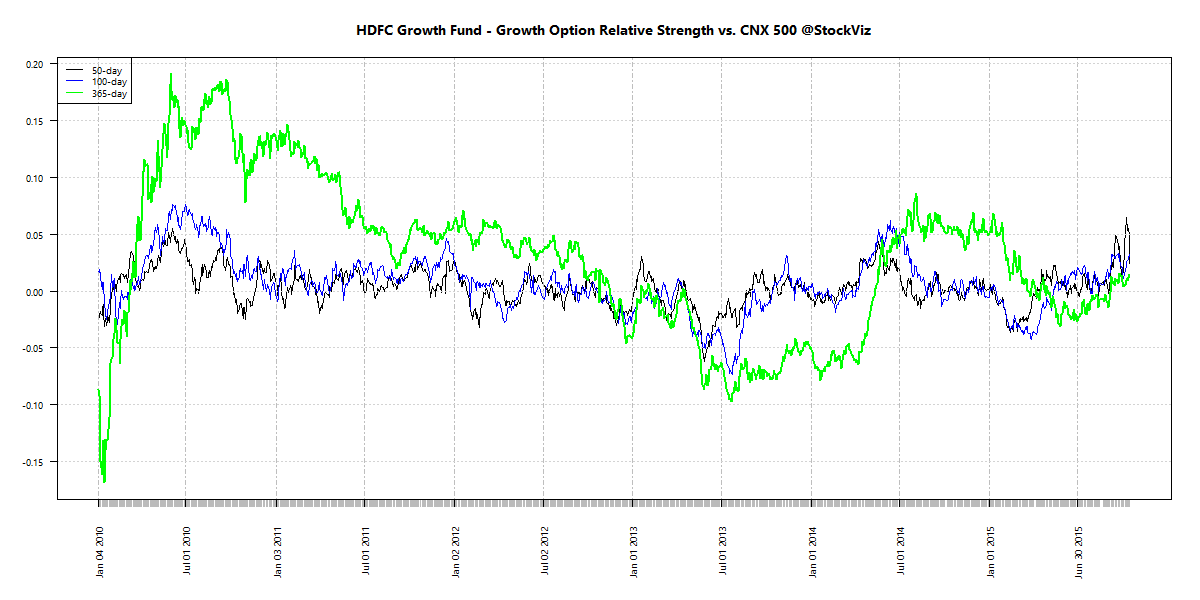
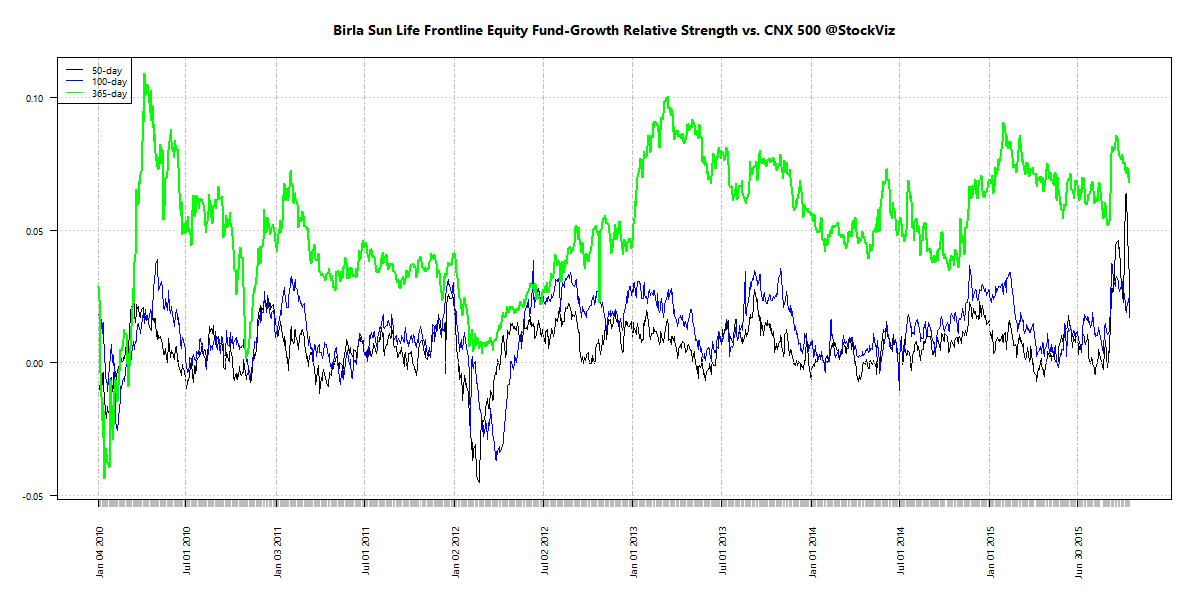
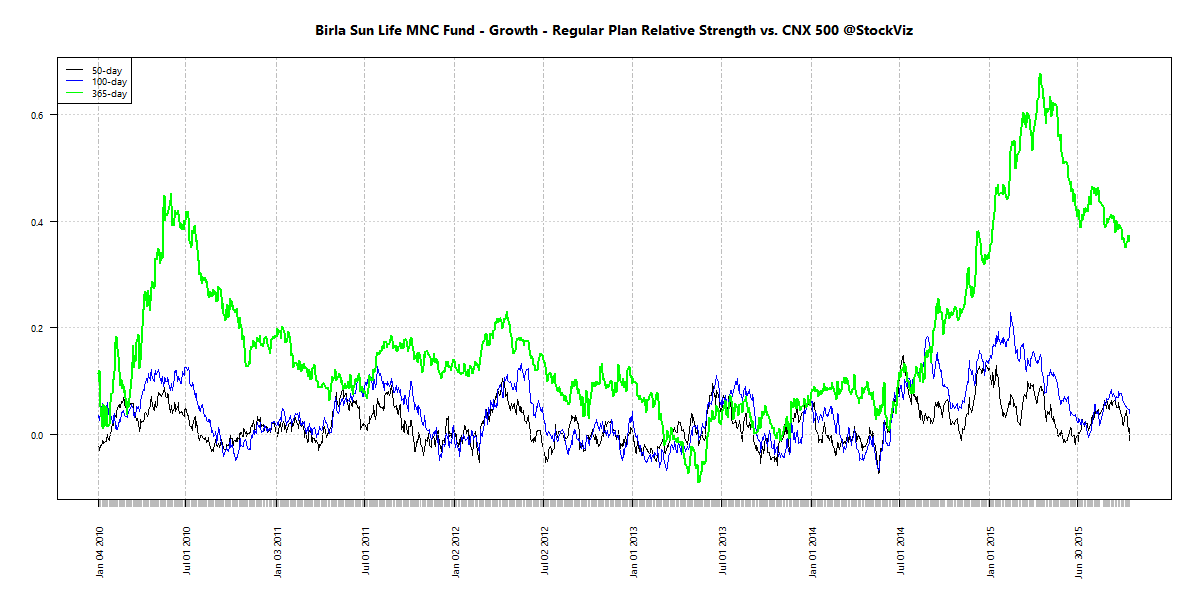
Equity Mutual Funds
Bond Mutual Funds
Thought for the weekend
The investing cycle of good ideas goes something like this:
Early adopters find an anomaly and exploit it for huge gains. More and more smart money begins to figure out this apparent loophole and competition means lower profits to go around. Next come the academics with their research papers that get published in the trade journals and such. Finally, Wall Street picks up on the trend and does their part to create more products than are needed to help everyone else finally jump in on the fad, usually just as the cycle is about to turn.
Source: When Evidence Fails