It is all local until it is not
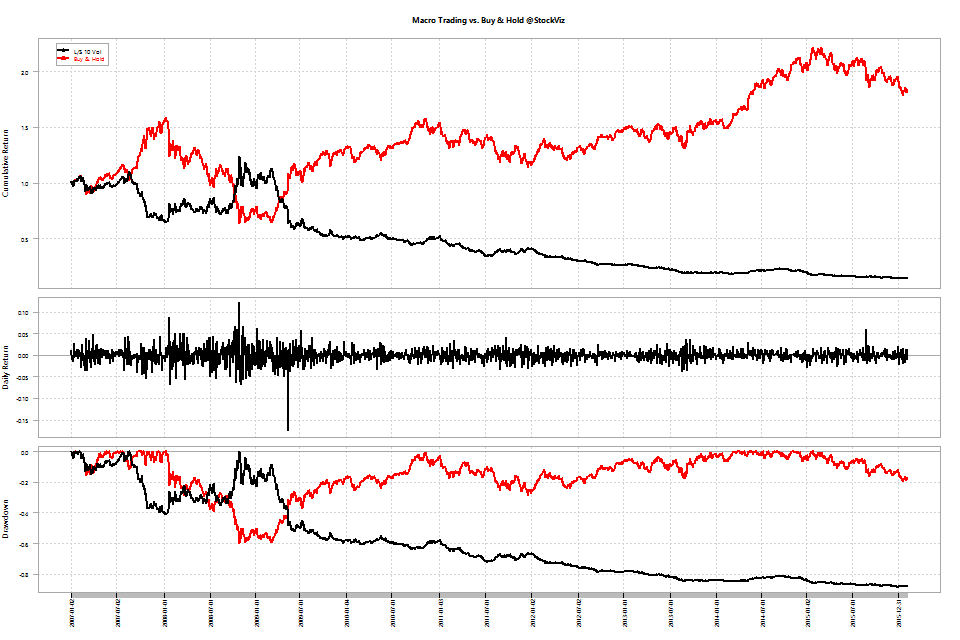
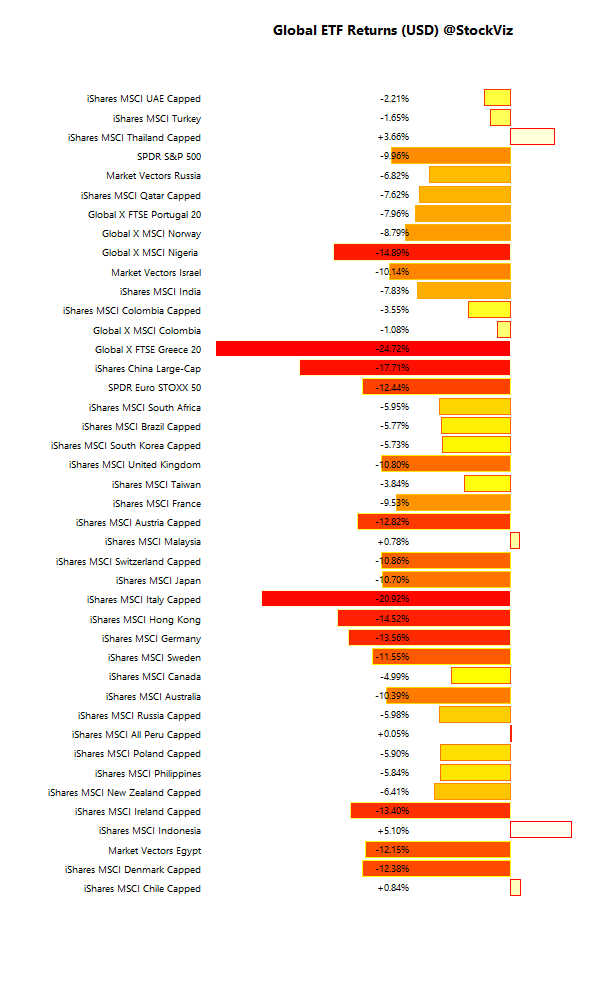
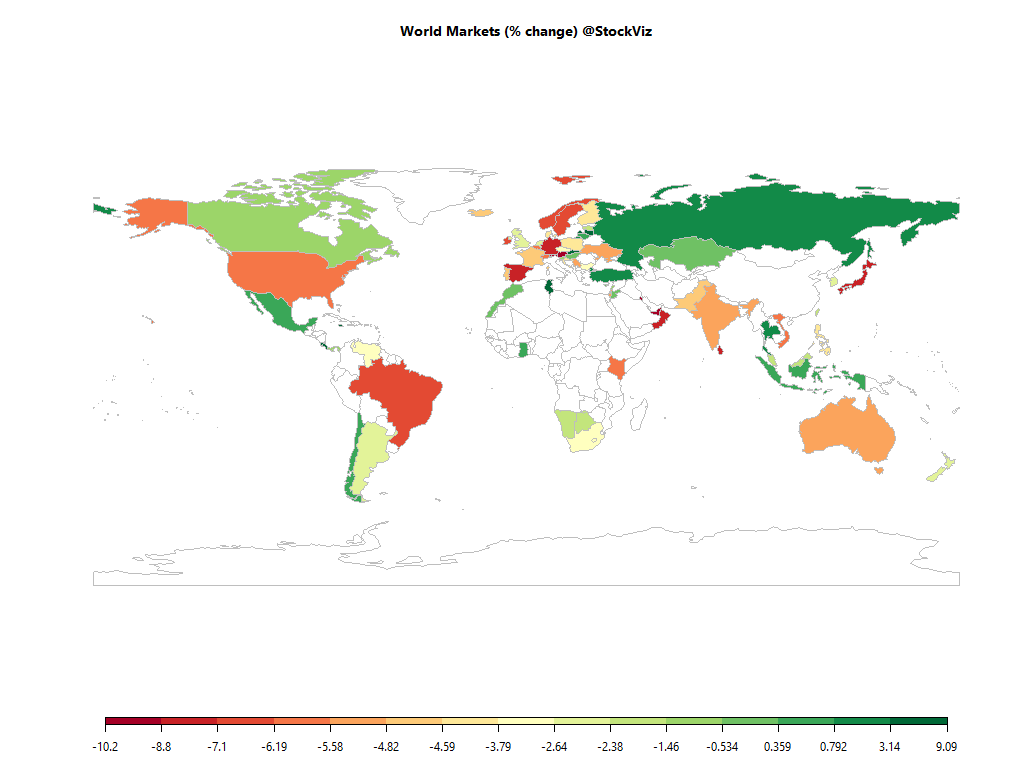
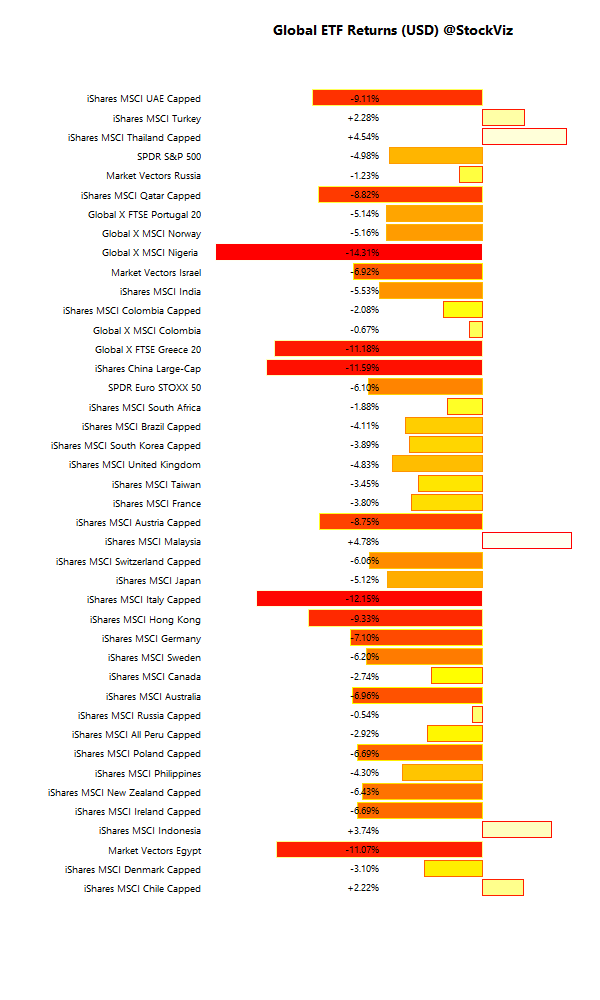
World markets just witnessed a spiraling sell-off that caught most investors off-guard. The problem is that for most of the time, markets are local. Except for those times when they aren’t and correlations go to 1.
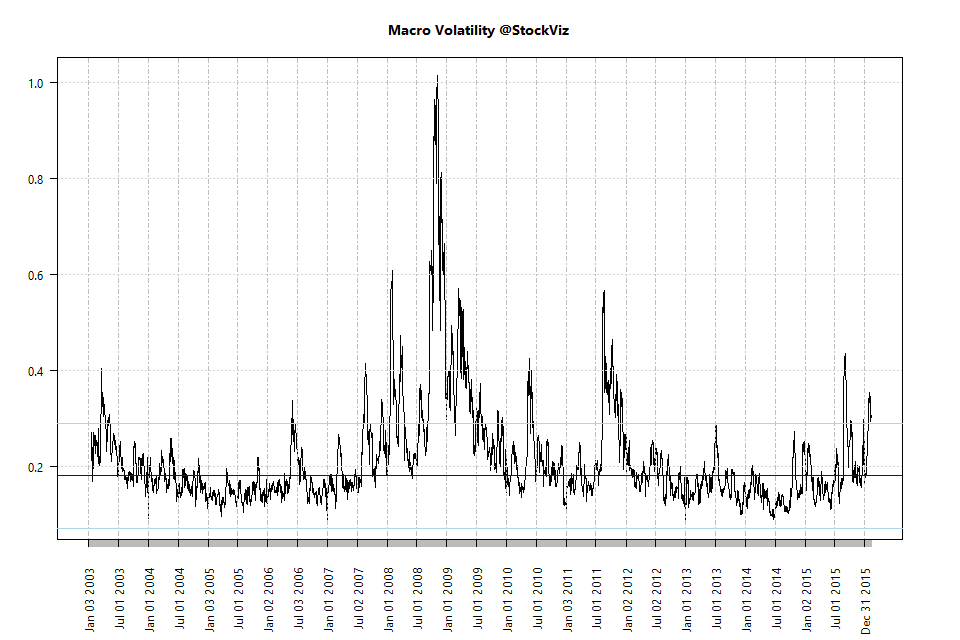
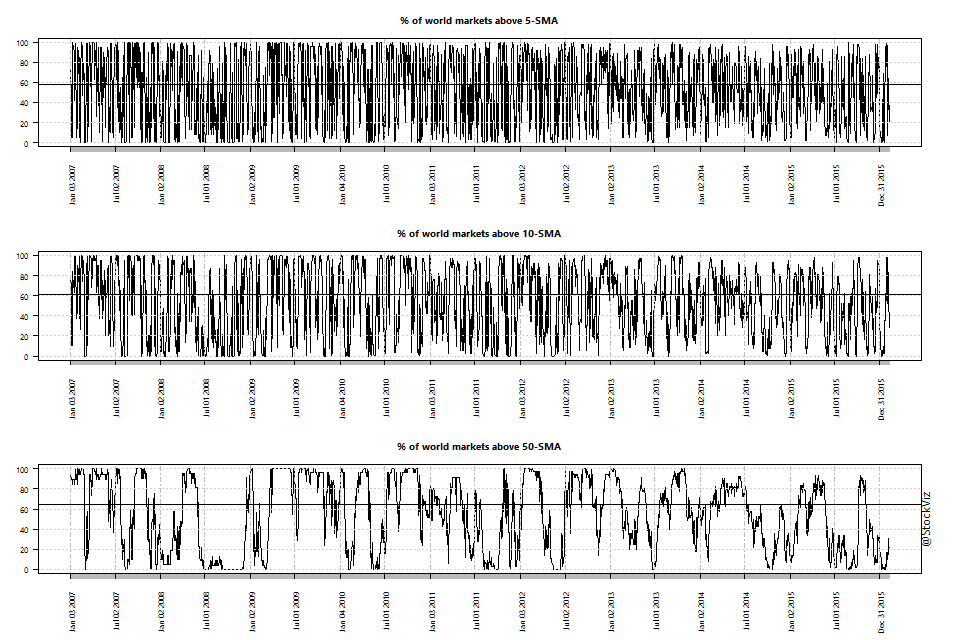
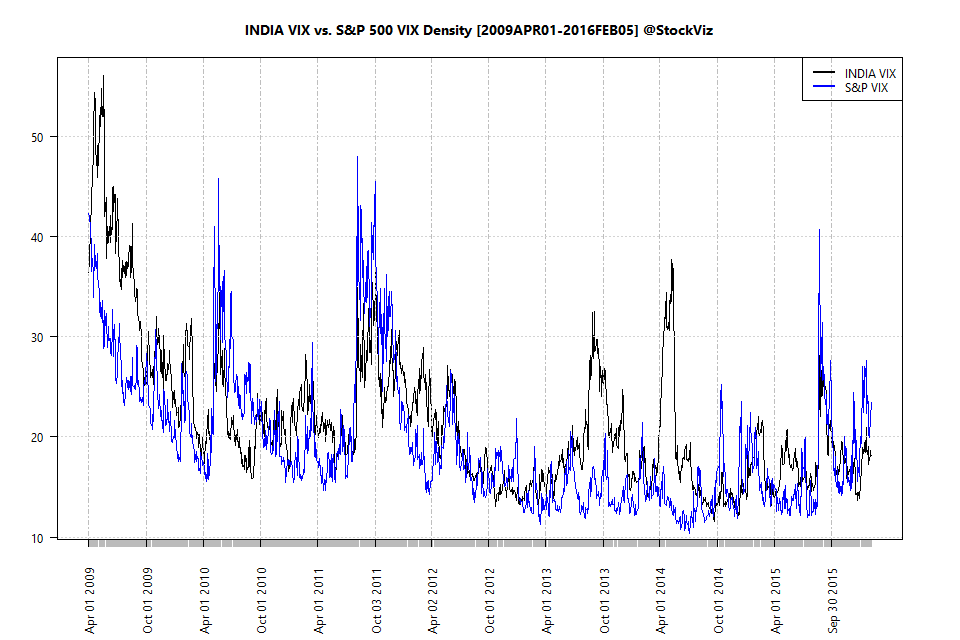
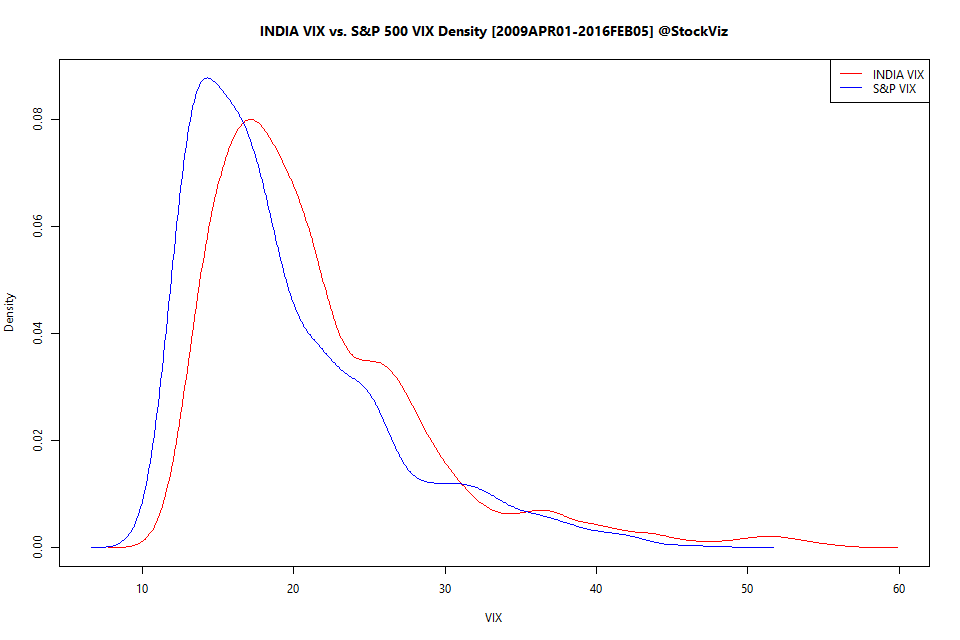
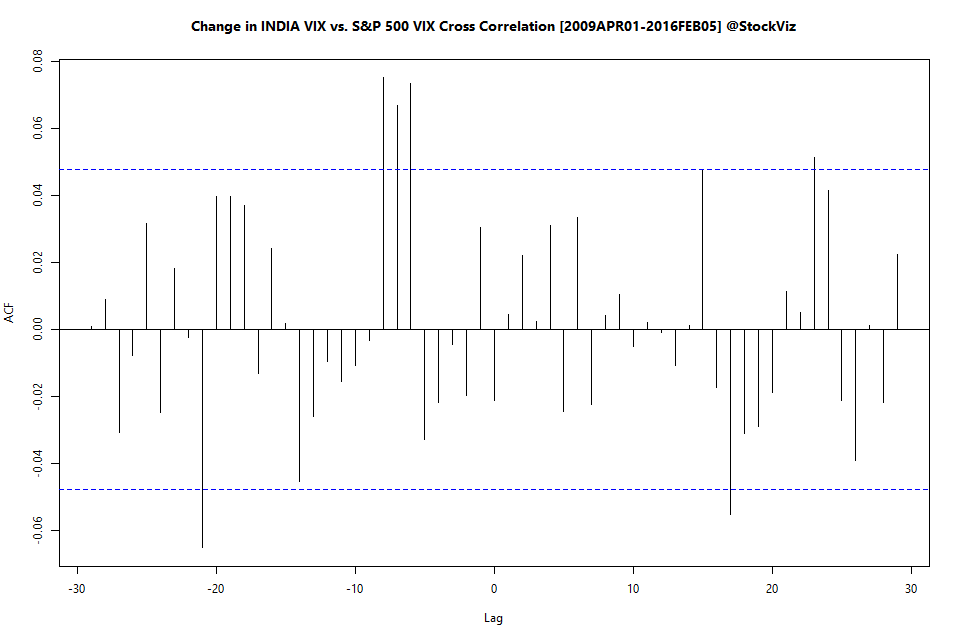
We tried singling out different factors to check if they could act as leading indicators of market sell-offs:
It is not one thing and it is never the same thing
The problem is that, statistically, no one global indicator is going to be a perfect canary in the coal mine. However, once the number of “meaningful” events crosses a threshold, correlations tend to 1.
But what exactly defines “meaningful?” Is it 1-sigma or 2-sigma? Should it be change in price or price itself? What should be the number of periods over which these statistics are calculated? The answers to these questions are going to take a while to figure out. In the meantime, we decided to create a dashboard that lets investors choose some of these filters.
You can play with our Global Macro Dashboard here: StockViz/GlobalDashboard
Welcome to glocal markets.