Author: shyam

The Problem with Dynamic P/E Funds

Executive Summary

Dynamic P/E funds use the market Price-to-Equity ratio to decide on allocation. If the P/E ratio is deemed too high, they allocate more to bonds or arbitrage strategies and if the P/E ratio is low, they allocate more towards equities. This logic sounds good on paper. However,

  1. The market always appears expensive around turnarounds – investors miss out on the recovery trade.
  2. The market always appears cheap during downturns – investors end up being long equities when bonds tend to outperform.
  3. It doesn’t protect against volatility as a pure-play bond fund would (bad fit if you are risk-averse.)
  4. It doesn’t give you the returns of a pure-play equity fund (bad fit if you are risk-seeking.)
  5. Since it dampens volatility, it doesn’t make sense to dollar-cost-average (bad fit if your looking for an SIP.)

It is a solution looking for a problem.

Analysis

We thank Franklin Templeton for running the Dynamic PE Ratio Fund Of Funds to perform our analysis. This is probably the only fund where a true apples-to-apples comparison can be made between a pure-play equity fund, a pure-play bond fund and a dynamic PE fund.

The Dynamic PE fund invests x% in the Franklin India Short Term Income Plan and 100-x% in the Franklin India Bluechip Fund based on the P/E ratio. All we have to do is look at how a buy-and-hold strategy of the components compare to the Dynamic PE fund to gauge the effectiveness of the strategy.

Dynamic PE vs. pure-play Equity

Between 2007-01-02 and 2015-09-23, Franklin India Dynamic PE Ratio Fund of Funds-Growth’s IRR was 10.93% vs. Franklin India Bluechip Fund-Growth’s IRR of 11.53%

Franklin India Dynamic PE Ratio Fund of Funds vs. Franklin India Bluechip Fund

drawdowns dyn pe vs. bluechip

Similar returns. Lesser drawdowns. Lump-sum investors will probably be fine with these returns.

Dynamic PE vs. pure-play Bonds

First, let’s compare the Dynamic PE fund to the Short Term Income Plan.

Between 2007-01-02 and 2015-09-23, Dynamic PE Ratio had an IRR of 10.93% vs. Short-Term Income Plan’s IRR of 9.49%

drawdowns dyn pe vs. liquid fund

For investors worried about drawdowns, just investing in the liquid fund would have given similar returns with a lot less risk. A 35% drawdown is a lot for a fund that gives bond-like returns.

A bond fund like the Birla Sun Life Dynamic Bond Fund, for example, had an IRR of 9.65% over the same time period

Conclusion

Using the P/E ratio for asset allocation is a bad idea. Investors would have experienced similar returns but with smaller drawdowns if they had invested in a regular bond fund instead.

Related: Dynamic PE Funds

Weekly Recap: The End

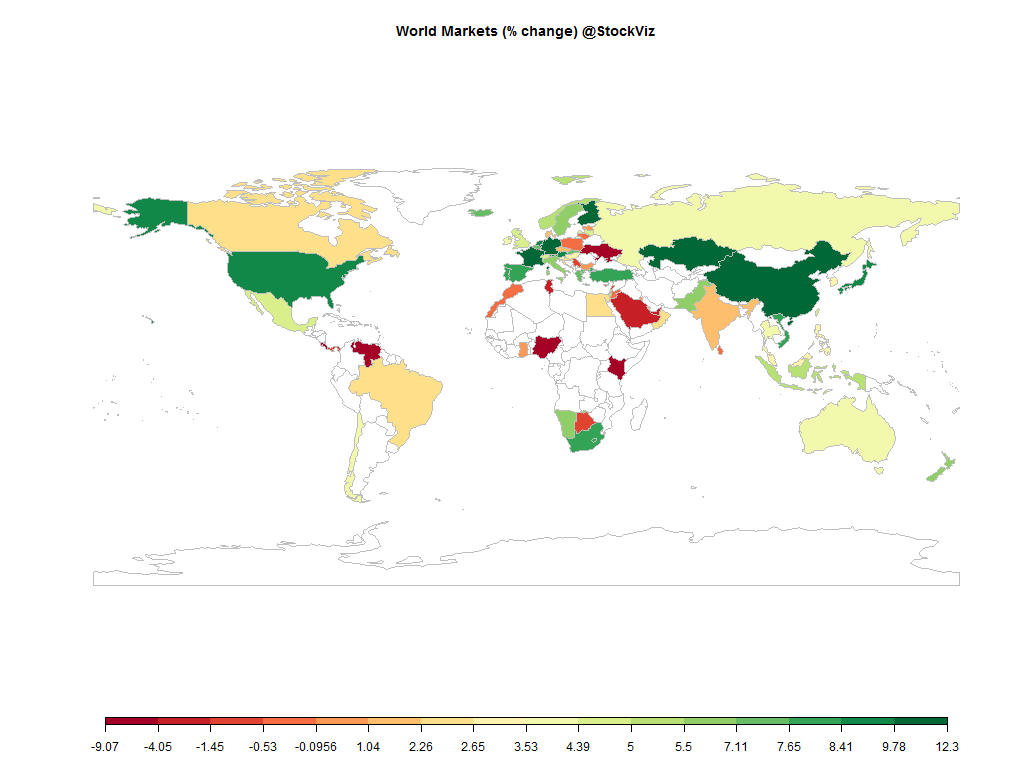
world.2015-09-11.2015-09-18

Equities

Major
DAX(DEU) -2.05%
CAC(FRA) -0.28%
UKX(GBR) -0.22%
NKY(JPN) -1.06%
SPX(USA) +0.45%
MINTs
JCI(IDN) +0.46%
INMEX(MEX) +1.72%
NGSEINDX(NGA) +2.17%
XU030(TUR) +5.25%
BRICS
IBOV(BRA) +2.11%
SHCOMP(CHN) -3.20%
NIFTY(IND) +2.47%
INDEXCF(RUS) -0.42%
TOP40(ZAF) +4.98%

Commodities

Energy
RBOB Gasoline -1.41%
WTI Crude Oil -0.38%
Natural Gas -3.41%
Brent Crude Oil -2.43%
Heating Oil -4.14%
Ethanol +3.91%
Metals
Gold 100oz +3.22%
Copper -2.85%
Palladium +2.54%
Platinum +1.58%
Silver 5000oz +5.52%

Currencies

USDEUR:+0.35% USDJPY:-0.48%

MINTs
USDIDR(IDN) +0.37%
USDMXN(MEX) -0.95%
USDNGN(NGA) -0.01%
USDTRY(TUR) -1.30%
BRICS
USDBRL(BRA) +1.76%
USDCNY(CHN) -0.17%
USDINR(IND) -1.30%
USDRUB(RUS) -1.73%
USDZAR(ZAF) -1.82%
Agricultural
Cattle -3.34%
Feeder Cattle -3.78%
Sugar #11 -5.90%
White Sugar -1.24%
Cocoa +1.15%
Soybeans -2.28%
Wheat +2.85%
Coffee (Robusta) +1.36%
Lean Hogs +5.91%
Lumber -5.86%
Orange Juice -1.46%
Soybean Meal -1.46%
Coffee (Arabica) +4.42%
Corn +0.73%
Cotton -7.91%

Credit Indices

Index Change
Markit CDX EM +0.87%
Markit CDX NA HY +0.25%
Markit CDX NA IG -2.42%
Markit iTraxx Asia ex-Japan IG -6.65%
Markit iTraxx Australia -1.53%
Markit iTraxx Europe -0.30%
Markit iTraxx Europe Crossover -2.09%
Markit iTraxx Japan -1.94%
Markit iTraxx SovX Western Europe -0.41%
Markit LCDX (Loan CDS) +0.00%
Markit MCDX (Municipal CDS) -0.22%
Did the Fed just yell “FIRE” in a crowded room? Their decision to hold rates at zero on Thursday seemed to have shifted the market’s worry on the slowing world economy…

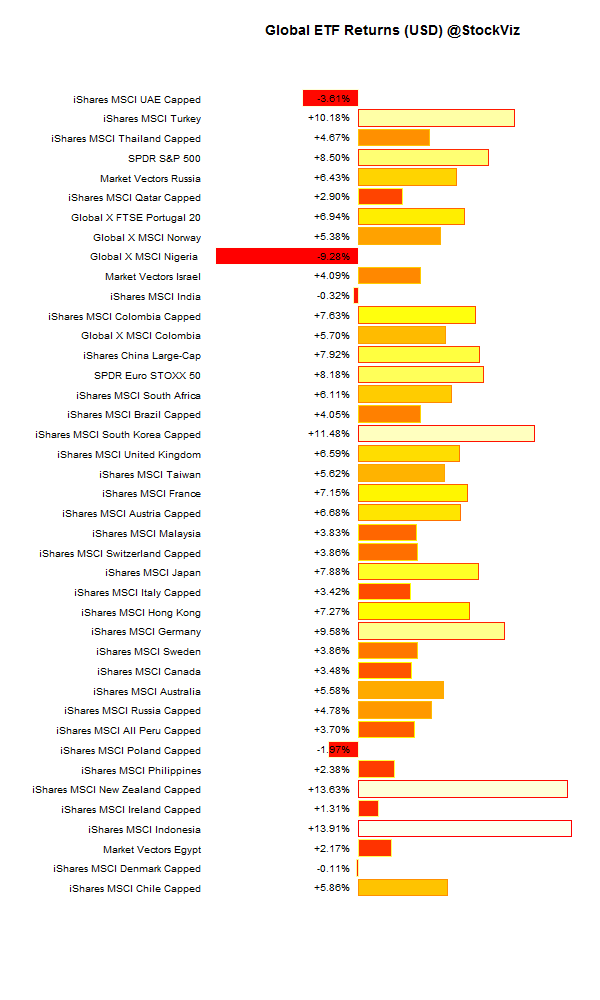
International ETFs (in USD)

5yr
2yr
1yr
1wk
EWM
iShares MSCI Malaysia
-11.55%
-30.48%
-30.9%
+5.64%
GREK
Global X FTSE Greece 20
-45.28%
-45.54%
+4.76%
NGE
Global X MSCI Nigeria
-37.25%
-40.9%
+4.22%
EZA
iShares MSCI South Africa
-0.41%
-14.19%
-16.79%
+3.5%
TUR
iShares MSCI Turkey
-41.1%
-37.41%
-30.19%
+3.15%
EWY
iShares MSCI South Korea Capped
+0.4%
-20.12%
-20.37%
+3.11%
GXG
Global X MSCI Colombia
-52.87%
-53.55%
-52.94%
+2.99%
ICOL
iShares MSCI Colombia Capped
-53.45%
-53.5%
+2.58%
EPHE
iShares MSCI Philippines
-2.17%
-8.73%
+2.57%
INDA
iShares MSCI India
+18.41%
-10.88%
+2.35%
EGPT
Market Vectors Egypt
-37.94%
-9.32%
-43.79%
+2.2%
ENZL
iShares MSCI New Zealand Capped
+47.44%
-9.44%
-14.61%
+2.1%
ECH
iShares MSCI Chile Capped
-49.65%
-33.38%
-18.67%
+1.63%
EIRL
iShares MSCI Ireland Capped
+128.56%
+26.76%
+16.69%
+1.56%
RSX
Market Vectors Russia
-43.09%
-42.19%
-29.21%
+1.39%
EWA
iShares MSCI Australia
-1.38%
-23.64%
-24.2%
+1.36%
ERUS
iShares MSCI Russia Capped
-42.52%
-27.7%
+1.14%
EWT
iShares MSCI Taiwan
+16.88%
-0.86%
-12.23%
+1.1%
PGAL
Global X FTSE Portugal 20
-27.98%
+0.99%
FXI
iShares China Large-Cap
-4.75%
-4.27%
-8.7%
+0.72%
EWC
iShares MSCI Canada
-5.21%
-14.43%
-25.55%
+0.72%
EWH
iShares MSCI Hong Kong
+27.47%
+1.13%
-6.89%
+0.41%
EWG
iShares MSCI Germany
+32.24%
-6.97%
-12.02%
-2.72%
EWI
iShares MSCI Italy Capped
+0.48%
+3.26%
-9.28%
-2.28%
FEZ
SPDR Euro STOXX 50
+13.31%
-7.27%
-14.7%
-2.16%
EWD
iShares MSCI Sweden
+23.83%
-11.94%
-11.29%
-1.89%
EWJ
iShares MSCI Japan
+24.7%
-2.62%
-1.79%
-1.88%
EWZ
iShares MSCI Brazil Capped
-63.52%
-52.16%
-52.42%
-1.81%
QAT
iShares MSCI Qatar Capped
-20.51%
-1.57%
EWQ
iShares MSCI France
+18.69%
-6.81%
-9.71%
-1.56%
EIDO
iShares MSCI Indonesia
-31.34%
-32.2%
-34.27%
-1.39%
EWO
iShares MSCI Austria Capped
-9.4%
-17.77%
-10.68%
-1.23%
EPOL
iShares MSCI Poland Capped
-16.52%
-22.39%
-23.13%
-1.09%
EWU
iShares MSCI United Kingdom
+22.5%
-9%
-14.92%
-0.71%
THD
iShares MSCI Thailand Capped
+25.81%
-18.42%
-22.42%
-0.63%
NORW
Global X MSCI Norway
-29.21%
-32.51%
-0.56%
UAE
iShares MSCI UAE Capped
-28.03%
-0.53%
EDEN
iShares MSCI Denmark Capped
+36.37%
+7.13%
-0.48%
SPY
SPDR S&P 500
+87.49%
+16.81%
-1.77%
-0.25%
ISRA
Market Vectors Israel
+15.03%
-0.1%
-0.19%
EWL
iShares MSCI Switzerland Capped
+52.24%
+2.83%
-5.36%
-0.13%
EPU
iShares MSCI All Peru Capped
-37.31%
-31.38%
-36.47%
-0.04%

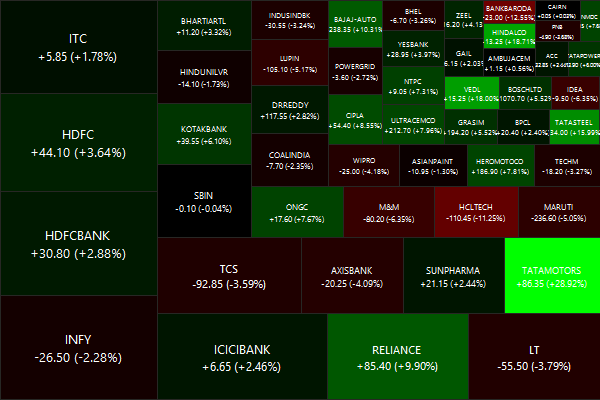
Nifty Heatmap

CNX NIFTY.2015-09-11.2015-09-18

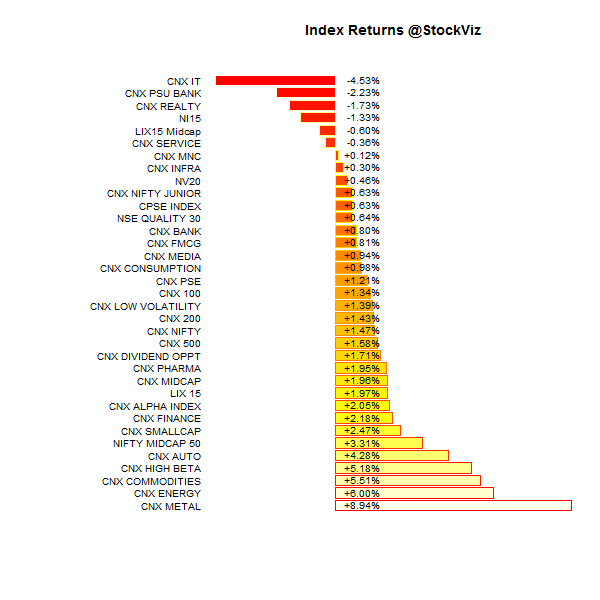
Index Returns

For a deeper dive into indices, check out our weekly Index Update.
index.performance.2015-09-11.2015-09-18

Market Cap Decile Performance

Decile Mkt. Cap. Adv/Decl
1 +1.75% 63/66
2 +1.78% 70/59
3 +2.87% 67/62
4 +2.11% 75/54
5 +2.82% 75/54
6 +2.10% 62/67
7 +0.92% 65/65
8 +1.20% 64/64
9 +0.90% 64/65
10 +1.03% 59/71
A broad based rally on the back of ZIRP…

Top Winners and Losers

TATAPOWER +7.98%
YESBANK +8.54%
CROMPGREAV +9.17%
BHARATFORG -10.20%
CONCOR -5.10%
UPL -5.02%
Bharat Forge got dinged pretty bad…

ETF Performance

PSUBNKBEES +4.89%
BANKBEES +4.76%
JUNIORBEES +2.18%
NIFTYBEES +1.98%
CPSEETF +1.75%
GOLDBEES +1.26%
INFRABEES -0.14%
Banks caught a rally on the back of rumors of FDI being hiked to 100%…

Yield Curve

yieldCurve.2015-09-11.2015-09-18

Bond Indices

Sub Index Change in YTM Total Return(%)
0 5 -0.05 +0.29%
5 10 -0.05 +0.43%
10 15 -0.06 +0.62%
15 20 -0.06 +0.72%
20 30 -0.06 +0.79%
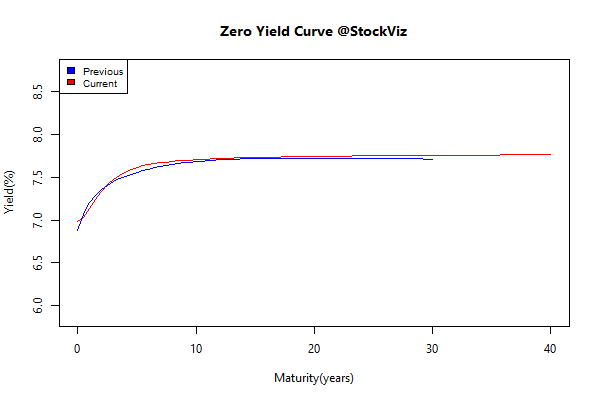
The bond market has factored in a rate-cut later this month…

Investment Theme Performance

Momentum caught a break as midcaps rallied…

Equity Mutual Funds

Bond Mutual Funds

Thought for the weekend

The golden age of the Western corporation was the product of two benign developments: the globalisation of markets and, as a result, the reduction of costs. Now a more difficult era is beginning. More than twice as many multinationals are operating today as in 1990, making for more competition. Margins are being squeezed and the volatility of profits is growing. Many companies in labour- and capital-intensive industries have been slaughtered by foreign competitors. What next?

Source: Death and transfiguration

Weekly Recap: Munger on Risk

world.2015-09-04.2015-09-11

Equities

Major
DAX(DEU) +0.85%
CAC(FRA) +0.57%
UKX(GBR) +1.24%
NKY(JPN) +2.65%
SPX(USA) +2.36%
MINTs
JCI(IDN) -1.24%
INMEX(MEX) +0.34%
NGSEINDX(NGA) +0.60%
XU030(TUR) -2.08%
BRICS
IBOV(BRA) -0.20%
SHCOMP(CHN) +1.27%
NIFTY(IND) +1.75%
INDEXCF(RUS) +1.17%
TOP40(ZAF) -0.22%

Commodities

Energy
Brent Crude Oil -3.80%
WTI Crude Oil -3.66%
Heating Oil -3.50%
RBOB Gasoline -3.51%
Ethanol +2.12%
Natural Gas +1.02%
Metals
Palladium +2.49%
Platinum -2.16%
Silver 5000oz -0.68%
Copper +6.47%
Gold 100oz -1.58%

Currencies

USDEUR:-1.62% USDJPY:+1.40%

MINTs
USDIDR(IDN) +1.06%
USDMXN(MEX) -0.51%
USDNGN(NGA) +0.00%
USDTRY(TUR) +1.12%
BRICS
USDBRL(BRA) +0.57%
USDCNY(CHN) +0.30%
USDINR(IND) +0.11%
USDRUB(RUS) -0.22%
USDZAR(ZAF) -2.15%
Agricultural
Coffee (Arabica) -2.16%
Cotton +2.60%
Sugar #11 +4.19%
White Sugar -0.09%
Corn +7.38%
Cocoa +2.20%
Feeder Cattle -0.42%
Lean Hogs -2.41%
Soybean Meal +0.22%
Soybeans +1.34%
Wheat +3.44%
Cattle +0.06%
Coffee (Robusta) -3.02%
Lumber +6.22%
Orange Juice -5.97%

Credit Indices

Index Change
Markit CDX EM -0.04%
Markit CDX NA HY +0.30%
Markit CDX NA IG -1.02%
Markit iTraxx Asia ex-Japan IG -5.46%
Markit iTraxx Australia -2.71%
Markit iTraxx Europe -2.42%
Markit iTraxx Europe Crossover -11.48%
Markit iTraxx Japan -1.82%
Markit iTraxx SovX Western Europe -0.17%
Markit LCDX (Loan CDS) +0.00%
Markit MCDX (Municipal CDS) -0.27%
Markets ended in the green after the brutal beating it took the previous week. The VIX ended below 25 but is still way about its long-run average. The next week is going to be all about the US Fed – and maybe a short-covering rally ahead of Thursday’s meeting.

Nifty Heatmap

CNX NIFTY.2015-09-04.2015-09-11

Index Returns

For a deeper dive into indices, check out our weekly Index Update.
index.performance.2015-09-04.2015-09-11

Market Cap Decile Performance

Decile Mkt. Cap. Adv/Decl
1 (micro) -5.60% 60/73
2 -3.21% 59/74
3 -3.70% 58/76
4 -2.97% 59/74
5 -2.98% 59/74
6 -3.00% 63/71
7 -3.32% 57/76
8 -2.20% 65/69
9 -1.38% 59/74
10 (mega) -0.37% 65/69
Overall, markets were down – NIFTY’s performance did not bleed into the rest of the market…

Top Winners and Losers

CONCOR +9.40%
YESBANK +9.85%
RCOM +11.02%
INFRATEL -8.11%
MOTHERSUMI -4.99%
ADANIPORTS -4.83%
A mixed bag of a market…

ETF Performance

INFRABEES +3.37%
PSUBNKBEES +3.17%
BANKBEES +2.16%
NIFTYBEES +1.50%
CPSEETF +0.00%
GOLDBEES -1.08%
JUNIORBEES -1.17%
Gold continued to tank…

Yield Curve

yield Curve.2015-09-04.2015-09-11

Bond Indices

Sub Index Change in YTM Total Return(%)
0 5 +0.01 +0.12%
5 10 +0.03 -0.01%
10 15 +0.02 +0.02%
15 20 +0.04 -0.18%
20 30 +0.01 -0.02%
Bond yields ticked up marginally…

Investment Theme Performance

Hopefully, in the first stages of recovering from their drawdowns…

Equity Mutual Funds

Bond Mutual Funds

Thoughts for the weekend

Charlie Munger on Risk:

  1. Risk to us is a) the risk of permanent loss of capital, or b) the risk of inadequate return.
  2. Using a stock’s volatility as a measure of risk is nuts.
  3. Volatility is an overworked concept. You shouldn’t be imprisoned by volatility.
  4. Someone will always be getting richer faster than you. This is not a tragedy.
  5. When any person offers you a chance to earn lots of money without risk, don’t listen to the rest of their sentence.

Source: A Dozen Things I’ve Learned from Charlie Munger about Risk

Weekly Recap: Who owns a company?

world.2015-08-28.2015-09-04

Equities

Major
DAX(DEU) -2.53%
CAC(FRA) -3.25%
UKX(GBR) -3.28%
NKY(JPN) -7.02%
SPX(USA) -3.03%
MINTs
JCI(IDN) -0.69%
INMEX(MEX) -1.58%
NGSEINDX(NGA) +2.36%
XU030(TUR) -2.29%
BRICS
IBOV(BRA) -1.17%
SHCOMP(CHN) -2.23%
NIFTY(IND) -4.34%
INDEXCF(RUS) -1.22%
TOP40(ZAF) -1.88%

Commodities

Energy
RBOB Gasoline -7.45%
Ethanol +1.32%
Natural Gas -2.28%
WTI Crude Oil +1.10%
Brent Crude Oil -1.08%
Heating Oil +0.74%
Metals
Gold 100oz -0.98%
Platinum -2.53%
Silver 5000oz +0.69%
Copper -0.43%
Palladium -2.30%

Currencies

USDEUR:+0.30% USDJPY:-1.90%

MINTs
USDIDR(IDN) +1.36%
USDMXN(MEX) +1.03%
USDNGN(NGA) +0.04%
USDTRY(TUR) +2.88%
BRICS
USDBRL(BRA) +7.20%
USDCNY(CHN) -0.53%
USDINR(IND) +0.46%
USDRUB(RUS) +4.73%
USDZAR(ZAF) +4.06%
Agricultural
Cattle -3.81%
Lean Hogs +3.91%
Lumber -1.47%
Sugar #11 +2.65%
White Sugar +2.26%
Cocoa +2.79%
Orange Juice +1.51%
Soybean Meal -2.37%
Coffee (Arabica) -4.06%
Soybeans -1.96%
Wheat -4.08%
Coffee (Robusta) +1.66%
Corn -3.79%
Cotton -1.87%
Feeder Cattle -0.74%

Credit Indices

Index Change
Markit CDX EM -0.65%
Markit CDX NA HY -1.01%
Markit CDX NA IG +3.80%
Markit iTraxx Asia ex-Japan IG +9.23%
Markit iTraxx Australia +3.94%
Markit iTraxx Europe +3.26%
Markit iTraxx Europe Crossover +16.42%
Markit iTraxx Japan +2.03%
Markit iTraxx SovX Western Europe +0.09%
Markit LCDX (Loan CDS) +0.00%
Markit MCDX (Municipal CDS) -1.50%
Markets ended the week in an ocean of red ink. Being “better” than other EMs may mean just that we tank 10% while others tank 20%…

Nifty Heatmap

CNX NIFTY.2015-08-28.2015-09-04

Index Returns

For a deeper dive into indices, check out our weekly Index Update.
index.performance.2015-08-28.2015-09-04

Sector Performance

sector performance.2015-08-28.2015-09-04

Market Cap Decile Performance

Decile Mkt. Cap. Adv/Decl
1 (micro) -3.55% 74/61
2 -3.57% 65/69
3 -1.10% 68/66
4 -1.12% 70/65
5 -1.60% 65/69
6 -1.91% 65/69
7 -1.03% 63/72
8 -0.72% 69/65
9 -0.28% 70/64
10 (mega) -1.63% 68/67
Stocks were punished across the board…

Top Winners and Losers

INFRATEL +4.33%
RELCAPITAL +4.48%
SRTRANSFIN +4.74%
GLENMARK -12.64%
BHEL -12.11%
UNIONBANK -10.37%
A total tossup…

ETF Performance

GOLDBEES -0.27%
JUNIORBEES -2.75%
CPSEETF -3.83%
NIFTYBEES -4.04%
INFRABEES -5.82%
BANKBEES -5.93%
PSUBNKBEES -9.29%
PSBs got shellacked… Gold didn’t escape the selling pressure either…

Yield Curve

yield Curve.2015-08-28.2015-09-04

Bond Indices

Sub Index Change in YTM Total Return(%)
0 5 -0.01 +0.15%
5 10 -0.02 +0.23%
10 15 +0.02 +0.02%
15 20 -0.06 +0.67%
20 30 -0.01 +0.20%
Bonds went up a smidgen…

Investment Theme Performance

No investment strategy escaped the relentless selling pressure…

Equity Mutual Funds

Bond Mutual Funds

Thought for the weekend

For publicly listed companies, its owners are its shareholders. It is they who claim the profits of the company, potentially in perpetuity. It is they who exercise control rights over the management of the company from whom they are distinct. And it is they whose objectives have primacy in the running of the company.

Yet despite its durability and success, across countries and across time, this corporate model has not gone unquestioned. Recently, these questions have come thick and fast, with a rising tide of criticism of companies’ behaviour, from excessive executive remuneration, to unethical practices, to monopoly or oligopoly powers, to short-termism. These concerns appear to be both strongly-felt and widely-held.

So who owns them?

Source: Andrew G Haldane: Who owns a company?

Monthly Recap: The Unreliable Experts

world.2015-07-31.2015-08-31

Equities

Major
DAX(DEU) -11.53%
CAC(FRA) -10.53%
UKX(GBR) -8.87%
NKY(JPN) -11.75%
SPX(USA) -6.44%
MINTs
JCI(IDN) -8.12%
INMEX(MEX) -2.52%
NGSEINDX(NGA) -0.09%
XU030(TUR) -7.15%
BRICS
IBOV(BRA) -8.27%
SHCOMP(CHN) -13.57%
NIFTY(IND) -8.82%
INDEXCF(RUS) +2.53%
TOP40(ZAF) -6.33%

Commodities

Energy
Brent Crude Oil +1.55%
RBOB Gasoline -20.43%
Heating Oil +5.31%
Natural Gas -0.11%
WTI Crude Oil +2.13%
Ethanol -2.80%
Metals
Copper -2.53%
Gold 100oz +3.98%
Platinum +2.33%
Silver 5000oz -2.01%
Palladium -3.68%

Currencies

USDEUR:-2.46% USDJPY:-3.07%

MINTs
USDIDR(IDN) +4.13%
USDMXN(MEX) +4.51%
USDNGN(NGA) +0.18%
USDTRY(TUR) +5.21%
BRICS
USDBRL(BRA) +5.63%
USDCNY(CHN) +2.49%
USDINR(IND) +3.39%
USDRUB(RUS) +5.67%
USDZAR(ZAF) +5.15%
Agricultural
Coffee (Robusta) -10.83%
White Sugar -3.49%
Coffee (Arabica) -4.25%
Cotton -0.87%
Orange Juice +5.07%
Sugar #11 -3.86%
Wheat -2.76%
Cattle -1.92%
Cocoa -1.60%
Corn -2.89%
Feeder Cattle -4.25%
Soybeans -8.96%
Lean Hogs -13.32%
Lumber -7.58%
Soybean Meal -9.85%

Credit Indices

Index Change
Markit CDX EM -1.30%
Markit CDX NA HY -1.26%
Markit CDX NA IG +8.97%
Markit iTraxx Asia ex-Japan IG +20.22%
Markit iTraxx Australia +10.82%
Markit iTraxx Europe +7.90%
Markit iTraxx Europe Crossover +35.71%
Markit iTraxx Japan +3.62%
Markit iTraxx SovX Western Europe +0.08%
Markit LCDX (Loan CDS) -0.14%
Markit MCDX (Municipal CDS) +3.22%
All major indices suffered huge losses. The dollar rallied, commodities fell and investors fled risk-assets.

Oil

oil_fut_chart_august_2015

With oil down about 57 per cent from its peak last June, and copper and iron ore down about 50 and 70 per cent respectively from their peaks in early 2011, it has become clear that story was profoundly misleading. Whether or not the supercycle exists, the regular old cycle definitely does, and there is nothing very super about it at all.

Why the commodities super cycle was a myth

USDINR

usd_fut_chart_august_2015

Nifty Heatmap

CNX NIFTY.2015-07-31.2015-08-31

Index Returns

index.performance.2015-07-31.2015-08-31

Market Cap Decile Performance

Decile Mkt. Cap. Adv/Decl
1 (micro) -10.15% 69/68
2 -9.65% 53/83
3 -11.73% 45/92
4 -10.91% 50/86
5 -11.00% 46/90
6 -8.71% 51/86
7 -6.63% 56/80
8 -5.76% 57/80
9 -6.01% 61/75
10 (mega) -4.25% 72/65
Midcaps bore the brunt…

Top Winners and Losers

LUPIN +14.08%
GLENMARK +14.12%
DIVISLAB +20.52%
VEDL -24.26%
HINDALCO -23.91%
RELCAPITAL -19.41%
Pharma vastly out-performed the cyclicals and commodity players…

ETF Performance

GOLDBEES +7.12%
JUNIORBEES -3.41%
NIFTYBEES -6.44%
PSUBNKBEES -6.53%
BANKBEES -8.55%
INFRABEES -10.30%
CPSEETF -12.67%
Gold caught a safe-haven bid…

Yield Curve

yieldCurve.2015-07-31.2015-08-31

Bond Indices

Sub Index Change in YTM Total Return(%)
0 5 -0.01 +0.73%
5 10 -0.03 +0.77%
10 15 -0.08 +1.25%
15 20 -0.04 +0.98%
20 30 -0.02 +0.89%
Yields went down a smidgen…

Investment Theme Performance

The only strategy that ended in the green was low-vol…

Equity Mutual Funds

Bond Mutual Funds

FII and DII Activity

fii-investments.2014-01-01.2015-08-31

dii-investments.2014-01-01.2015-08-31

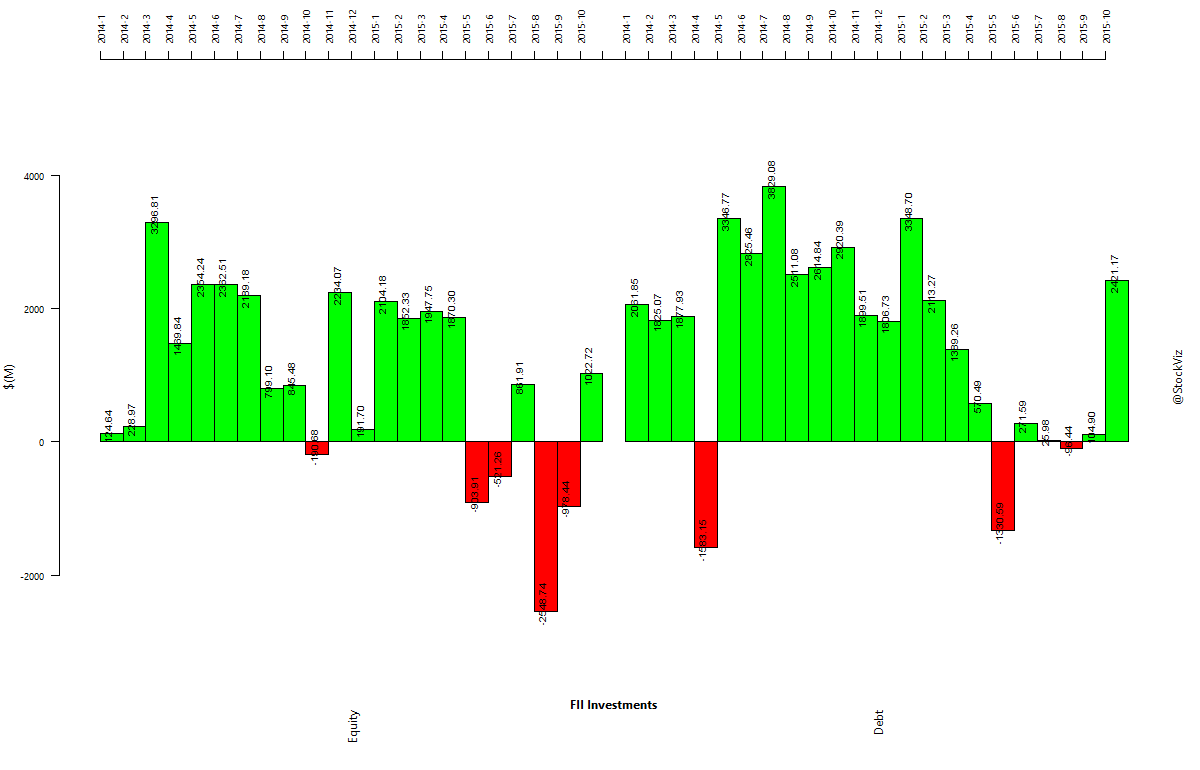
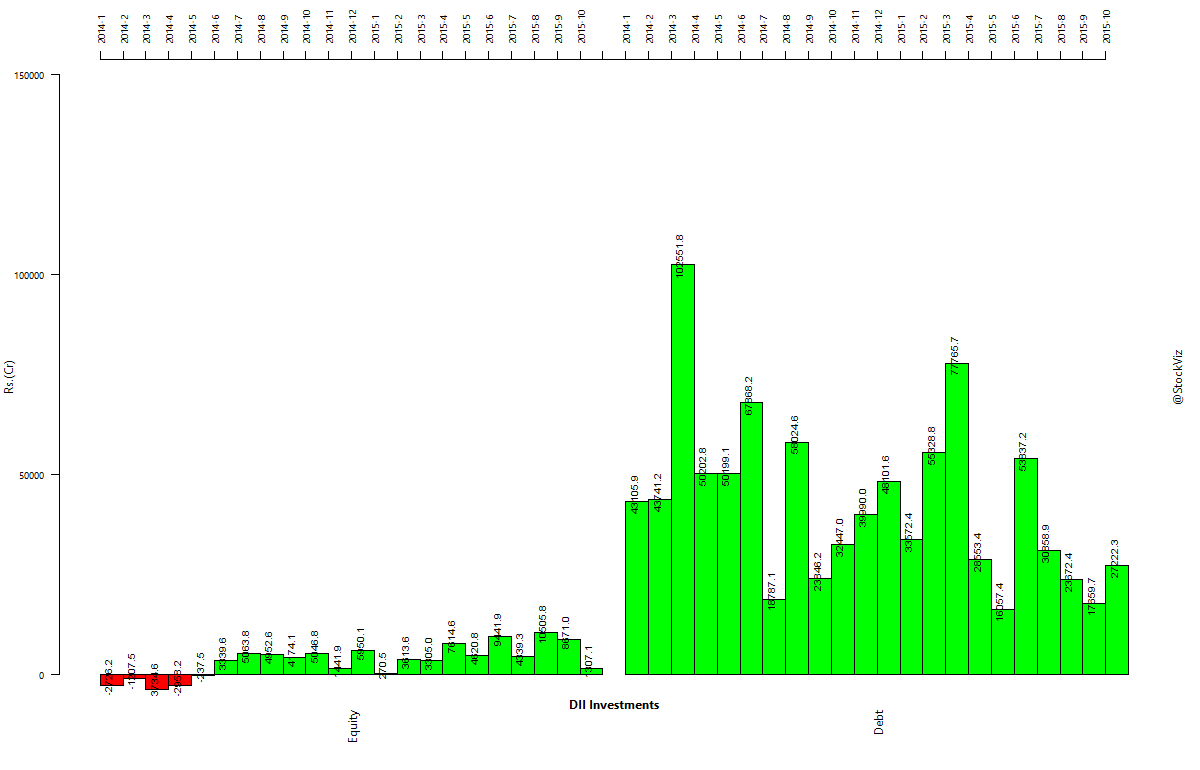
FII’s pulled out more than $2.5bn from the Indian markets. DII’s barely lent any support.

Thought to sum up the month

What ails the truth is that it is mainly uncomfortable, and often dull. The human mind seeks something more amusing, and more caressing.

Source: The Unreliable Experts: getting in the way of outstanding performance