When we back-test a strategy against the historical prices of an instrument, say, the NIFTY 50 index, we have to keep in mind that historical values are just one path of the many paths that the instrument could have taken.
For example, 10 tosses of a fair coin can result in TTTTTFFFFF and TFTFTFTFTF with equal probability. If your strategy is path dependent (as most strategies are,) then just because it was successful in one trial (historical prices) doesn’t mean that it would have been successful in all (or majority) of them.
The simple thing to do after a successful back-test against historical prices is to run a Monte Carlo simulation to check if the strategy comes out ahead in most of them. This can be setup by assuming returns are normally distributed and running a simulation using the mean and standard deviation of the sample.
For instance, in the recent past, daily NIFTY 50 returns have exhibited a mean of -0.0003742873 and std. dev. of 0.01079387. When you run a simulation and plot the results over the actual closing prices of the index, you get the resulting chart:
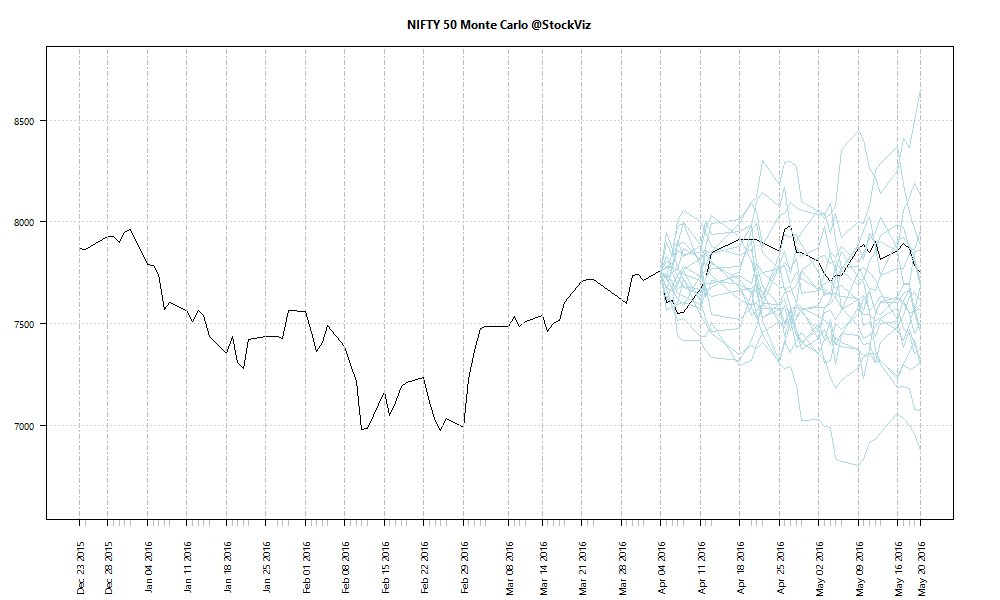
How many of these paths will result in a total equity wipeout of the back-tested strategy?