Business Adventures (Amazon,) is a collection of stories written by longtime New Yorker contributor John Brooks that capture the zeitgeist of the late 60’s.
It is dated and most of the stories are quite boring. And the few interesting ones, like the Piggly Wiggly short squeeze or the Ford Edsel disaster, have been discussed ad infinitum.
Quotable:
Most nineteenth-century American fortunes were enlarged by, if they were not actually founded on, the practice of insider trading. Not until 1910 did anyone publicly question the morality of corporate officers, directors, and employees trading in the shares of their own companies, not until the nineteen twenties did it come to be widely thought of as outrageous that such persons should be permitted to play the market game with what amounts to a stacked deck, and not until 1934 did Congress pass legislation intended to restore equity.
The biggest advantage that retail investors have is that they don’t have to worry about managing a huge portfolio with different types of investors with differing time-horizons and expectations. And of course, there’s the straightjacket of mandates that bind professional investors.
The problem with bucketing yourself as a “value investor,” “contrarian,” “growth,” or “momentum guy” is that you lose the biggest advantage that you have: flexibility and the ability to adapt to the market. Mandates, or lack thereof
Broadly, at a meta-level, investment strategies can either be Ferraris or busses but not both. They are built with different uses in mind. A Ferrari is not going to be able to seat 40 people or tug a 40 ton rig. And you don’t build a bus to go 0 to 60 mph in 3 seconds.
As a retail investor, your life becomes a lot simpler if you decide upfront if you want to drive a Ferrari or take the bus. But once you get on one, be at peace with your decision. Most investors would be better off taking the bus: DCA/SIP into a mutual fund, don’t chase performance, focus on asset allocation and increase your income and savings over time.
However, just because taking the bus is “right” according to conventional wisdom, doesn’t mean that everybody should be forced to get on one. Just like how you have Ferraris, buses and everything else in-between on the road, there are a wide range of investment strategies outside of the mainstream “at-scale” investment vehicles like mutual funds, PMS, managed accounts, etc.
Momo: The Ferrari Of Investment Strategies
Momentum is a well known Fama-French factor. The problem with momentum portfolios have always been the massive left-tail: when markets are volatile, the drawdowns have been heart-breaking. It doesn’t matter if the portfolio is long-only or long/short, there is no escaping the momentum whiplash.
I've said it before and I'll say it again: if you're using momentum ETFs, check the rebalance schedule. Most won't pick this up until May https://t.co/VKQW1DZDwR
— Corey Hoffstein ?☠️ (?, ?) (@choffstein) March 17, 2021
Then there is the question of rebalancing frequency. To scale a momentum fund, managers need to trade-off transaction and impact costs with being responsive to the market. And that means leaving a fair bit of alpha on the table.
This is the constraint of driving a bus. It can be a fast bus. But it is still a bus.
However, what is true for professional investors and funds is not necessarily true for you, the retail investor.
Do It Often, Do It Better
Most of the early factors were researched at a time when compute power and data were hard to come by. Researchers took the short-cut of using monthly returns to run their analysis because it made the problem more tractable. That set a precedent that is being followed to this day: the monthly rebalance schedule.
The problem with a monthly or a quarterly rebalance schedule is that the market has got a lot faster since the days the papers were written. We live in a world where data is abundant and compute power is a fraction of what it used to be. And trading costs have crashed to a small fraction of what it was 30 years ago.
The world changed.
There is no reason why the market shouldn’t be sampled more frequently.
Some Left-Tails Can Be Docked
A higher frequency approach lends itself to better risk management. It allows for a more responsive position sizing system based on market volatility and the ability to employ “stop-loss” exits on individual positions.
While drawdowns are not entirely avoidable given the nature of the markets, it is quite possible to protect the portfolio against the extremely deep ones. And the deep ones seem to occur at least once every three years, or so.
Avoiding the worst of the drawdowns allows for faster compounding of the portfolio.
Momos are risk-managed, frequently sampled momentum strategies.
Our Experience With Momos
We have been running Momo portfolios for both Indian and US markets for a while and we do it for all three flavors of momentum: Relative, Velocity and Acceleration. We’ll get into the differences between these in later posts but irrespective of the flavor, the “container” within which they run are identical.
The flavors wax and wane depending on the market – there is really no way to quantifiably claim that one is better than the other. In terms of personal preference, I would rank Relative Momentum first, Velocity and then Acceleration. To keep things concise, we show Relative “Momo” Momentum performance below.
US Equities
Indian Equities
Does It Scale?
When we discuss these strategies with professional fund managers, the most common question that comes up is “does it scale?”
And the answer is: No.
It doesn’t scale to professional break-even levels. For eg: for an Indian PMS to break-even, it at least needs Rs. 100 cr in AUM. There is no way the Indian Momos scale up to that level.
But it really doesn’t matter to you, the retail investor. Remember: professional investors are driving a bus, you need not.
Trade-Offs
The market abhors a free lunch. So the next questions is: “What are the trade-offs?”
Risk management is not free. There are always trading costs/taxes that affect the final outcome. But the known-knowns are factored into the performance metrics shown above.
Execution lags. There is always a delay between when the trades are triggered and when the execution takes place. This can be narrowed down by automation to a de minimis.
Compliance. There could be employer, broker or regulator imposed limits on how frequently positions can be churned in certain accounts. Momos would be a poor fit in these circumstances given that any deviation from the model triggered trades can lead to substantial deviation in performance.
Next Steps
If you decide that taking the bus is not for you, then we can help. Have a look at the Momo strategies linked below and let us know if you are interested. We are here to help.
In Transaction Man: The Rise of the Deal and the Decline of the American Dream (Amazon,) author Nicholas Lemann makes a case for building a plural democracy. Did it have to be a book? Probably not.
The money quote:
Embracing pluralism has to begin with a kind of radical humility. It’s human nature, especially for people who think of themselves as educated, sophisticated, and public-spirited, to believe that what you want the world to look like is a broad, objectively determined meliorist plan that will help everyone.
Pluralism requires accepting a degree of messiness, squabbling, pettiness, and bargaining in the governing of a society: these things are a feature, not a bug. People have a strong and often demonstrated tendency to try to settle their differences through violence. Pluralism means to redirect this tendency into managed, nonviolent conflict. It imagines a system of groups endlessly in vigorous contention. No one group should be able to establish its dominion over the others, either out of selfishness or in the conviction that it represents some inarguably right outcome. There is no such thing as a commonsense solution to a major problem, one that is good for everyone.
Pluralism treats democratic processes, not particular outcomes, as moral absolutes.
The economic system, since the Industrial Revolution, has periodically generated extreme concentrations of power and wealth. Imbalances in economic power always turn into imbalances in political power, unless the political system forcibly corrects them. Concentrations of power always wind up harming people, no matter how benign the holders of power believe themselves to be.
The book meanders between trying to be a history lesson and an NYT human interest piece.
Individual investors’ greatest advantage is that they don’t have to fit into a “style box.”
If you can’t measure it, you can’t improve it. – Peter Drucker
The Industrial Revolution was fueled, in part, by the violent combination of applied statistics and physics. Rapidly improving methods of measurement lead to rapid innovation in both the underlying physics and the resulting machine. And in an era of rapid innovation, managers who could zero-in on the metrics that mattered the most and measure them with decent precision had a large competitive advantage over the innumerate. For instance, if a new type of cotton ginny was invented, you needed a quantitative method to figure out if it was worth replacing the existing ones.
Managers who measured well survived. And those who survived, preached.
Take education, for example. Before the Industrial Revolution, one would simply be an “Oxford graduate.” There were no grades. Once your advisor thought that you were “ready,” you graduated. It was the industrialists who demanded scoring and ranking as a way to fit graduates into roles. And educational institutions obliged.
And it was all downhill from there.
When a measure becomes a target, it ceases to be a good measure. – Goodhart’s Law
While measurement and metrics are helpful in the physical world, it tends to break apart in the social world.
Measuring Investments
The first modern mutual fund was launched in the U.S. in 1924.
CRSP completed the stock market database in 1964.
The CAPM was introduced between 1961 and 1966.
Morningstar Style Box for mutual funds was introduced in 1992.
SEBI finalizes the Categorization and Rationalization of Mutual Fund Schemes in 2017.
For more than 40 years, investors were happy knowing absolute returns – how much was invested, what it is worth now and how long it took. And they were plodding along just fine for more than 70 years without the Style Box. But now, there are a dozen different ways to measure investment returns across an equal number of investment styles. How did we get here?
The Agency Problem
The Agency Problem or the Principal-Agent Problem occurs when one person (the agent) is allowed to make decisions on behalf of another person (the principal).
Within asset management, compensation structures in large part drive managers’ interests, and if these contracts are not structured correctly, managers may have an incentive to act counter to the fiduciary duty they have to their investors. Furthermore, investors’ tendency to focus on short-term performance may indirectly provide managers with additional incentives that exacerbate this problem. The Principal–Agent Problem in Finance
In every bull market, there are a certain class of funds that focus on the meme stocks of that period. These “go-go” funds, focused on growth stocks and other high-risk securities, offer higher risks, but also higher potential returns. Typically, when the bull market eventually comes to an end, investors end up holding the bag while the asset manager would’ve earned enough in fees to retire.
Stakeholder Rights and Obligations
There are quite a few stakeholders in the asset management industry:
The buyer/investor.
The seller/manager.
Independent/Sell-side/Buy-side analysts.
Rating agencies.
The broker/distributor.
The advisor/allocator/consultant.
The regulator.
The tax-payer/government.
As the asset management industry grew, the number of people involved in creating, (re)packaging, advising and selling them grew as well. Often, the interests of each of these stakeholders are in conflict. Increasing popularity of metrics and measurement in the industry is essentially an attempt at keeping these stakeholders honest.
Mandates
A barometer measures pressure. A thermometer measures temperature. Pressure and temperature exist independently of barometers and thermometers. This is true about any physical environment. Social environments are different. Measuring something could very well alter the very thing being measured. This is true about asset management as well.
For example, how should a bond fund manager be incentivized? If it were only to beat an index, then he could just play Russian-roulette with risky high yield bonds – he gets paid for excess returns (every year) when they work and you hold the bag when it blows up (eventually, some time in the future.) So, you put some restrictions on what he can do: only AA or higher with durations less than 3 years; not more than 10% of the fund in the same issuer/promoter, etc.
These restrictions are called mandates.
Mandates drive everything in professional asset management. It sets down a common operating principle and a set of metrics that all stakeholders can agree on.
In fact, the failure of the Indian mutual fund industry to narrow down mandates led to SEBI fixing it themselves. Before SEBI’s edict, it was common for fund houses to have multiple funds in the same category and play the survivorship bias game.
The rational behind Morningstar’s Style Box was the same as well.
Metrics that sit on top of mandates allow stakeholders to rank how individual managers have performed.
Where there is a Match, there is Match-fixing
The problem with mandates is that if you make it too strict, then beating the benchmark becomes nearly impossible and if you make it too lax, then agency problems raise their ugly heads.
US bond fund managers were able to beat their benchmarks mostly by taking additional risks: term risk, corporate credit risk, emerging markets risk, and volatility risk. Traditional discretionary active bond strategies offer little in the way of true alpha. AQR, 2018.
Given that investors care primarily about the most recent three-year performance, the pressure to front-load returns is huge. A case in point is the recent Franklin Templeton debt funds fiasco.
Despite the regulations being clear, some mutual fund schemes seem to have chosen to have high concentrations of high risk, unlisted, opaque, bespoke, structured debt securities with low credit ratings and seem to have chosen not to rebalance their portfolios even during the almost 12 months available to them so far. SEBI’s statement on Franklin Templeton dated May 7, 2020
Metrics are notoriously unstable
Finance doesn’t have immutable laws of nature. The “physics envy” that finance academics have is obvious in the body of research they have produced – precise equations modeling a complex-dynamic-adaptive system. But the desire to tame the beast that is the asset-management industry has lead to too many rigid frameworks and restrictions placed on all the stakeholders.
There is absolutely zero stability in metrics used to analyze mutual fund performance. Whether it is alpha, beta or information ratio, they all vary over time and across market environments. Using them to pick the next “winning” fund is pointless. They are, at best, a measure of what happened in the past. – A quick note on performance metrics
So you have tighter mandates and unstable metrics. But the bigger question is: as an investor, do you want relative performance or absolute returns?
Free your mind
The problem with bucketing yourself as a “value investor,” “contrarian,” “growth,” or “momentum guy” is that you lose the biggest advantage that you have: flexibility and the ability to adapt to the market.
I don’t think it’s an accident that there is a pattern of “fund managers of the decade” going on to underperform (sometimes massively). Some of this prob vanilla mean reversion but also I think there is a quirk of human behavior that leads regimes to last roundabout a decade
Fund managers, at the end of the day, are only human. They too suffer from confirmation bias. And to make matters worse, once they reach a certain level of fame, all their holdings are closely tracked and their decisions questioned. Once publicly committed to a position, they find it very difficult to backtrack and admit mistakes. You, as an individual investor, have no such pressure.
To top it all, the fund management business is geared towards the accumulation of assets. They are paid a % of assets under management (AUM,) after all. However, size is the enemy of outperformance. With break-evens running at Rs. 100 crore per fund, the “no-go” zones for managers are pretty large. You, as an individual investor, have no such constraints.
There is an oft repeated cliché that you should invest within your “circle of competence.” Most people use this as an excuse to keep fishing in the same pond till the water is dry and the fish are dead. Instead, you should think of it as a call to action. If you are not constantly learning and increasing your circle of competence, then what exactly are you doing with your life?
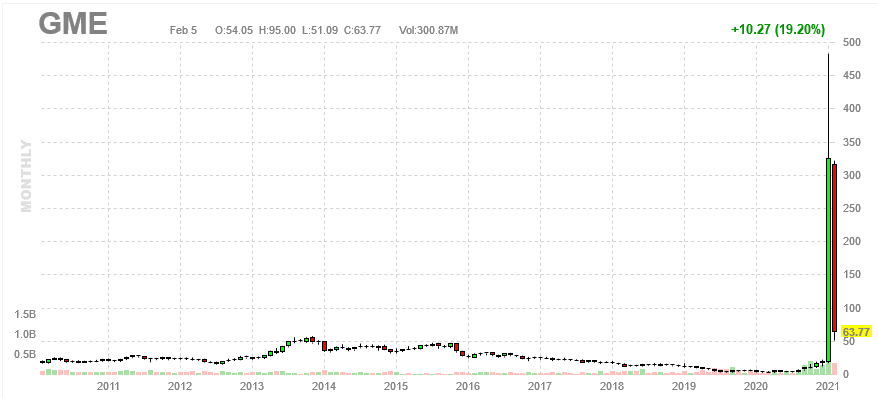
Unless you’ve been living under a rock the last month, you couldn’t have missed the GameStop (GME) short squeeze. A stock that was trading below $3 a few months ago suddenly shot up to $483 before collapsing to $63 yesterday. While the media narrative focused on how a bunch of YOLO traders in a subreddit took on Wall Street, what it really was, was a short-squeeze of epic proportions.
Why short a stock?
There are a lot of legitimate reasons to short a stock.
You think a company is committing fraud. You short the stock and publish a report hoping to convince other investors to short it along with you and draw regulators to investigate the company.
You think a company is headed towards bankruptcy where the stock is going to be worth zero. You short the stock and publish a report hoping to convince other investors to short it along with you1.
You run a relative value or merger-arbitrage strategy. You go long company A vs. short company B, pocketing the spread. For instance:
IBM’s bid for multinational software company Red Hat is a case in point, he says. ‘Red Hat had declined, its stock had gone down from a $170 peak in the summer to trade at $150 in Q4 and then it dropped to $120 before the IBM bid. So a $120 stock gets a $190 offer and, ironically, the market prices in a wider spread.
‘That’s a 60% premium but it wasn’t really much of a premium when you look at where Red Hat had been at its height.’
You are mostly long stocks or bonds and you want to limit your downside by shorting stocks.
You want to express a macro view. For example, if you think the entire housing market is going to collapse, then you can express that view by shorting housing stocks, housing-credit, etc.
Short-selling is an essential lubricant of the markets. It makes the market more efficient2.
When does it go wrong?
The problem with short-selling is that it has always seemed “wrong.” Elected representatives want to be seen encouraging entrepreneurship and short-sellers are the proverbial thorn in their sunny-skies-forever narrative. Over a period of time, this tilt against shorting has rigged the market to overwhelmingly favor longs.
To short-sell (i.e., sell a stock that you don’t own,) you need to first “borrow” it from someone. The lender demands that he be paid a fee for it. And if the stock price goes up, the borrower owes the difference to the lender. Also, in some cases, the lender has the right to recall the securities with little notice (“at call” 3.)
Usually, short-selling is as boring as long-buying. The practice is well understood and usually goes on without a hitch. But ever so often, things tend to go spectacularly wrong.
Asymmetric payoff
Suppose a stock is trading at Rs. 100 and you decide to short it. Your maximum profit is Rs. 100 whereas the person taking the long-side of it has no such limit to the upside. If the stock starts going up, you really have no way of telling what the eventual loss is likely to be. Beyond a certain limit, you’ll try and cover your short by buying the stock back in the market. But what if there are not enough stocks for you to buy?
Liquidity
There is a big difference between total market cap4, free float market cap5 and the number of shares that can be traded without making an impact6. Take Infosys (INFY,) for example.
Its total market cap is Rs. 5,42,24,574.74 lakhs and free float market cap is Rs. 4,71,41,375.59 lakhs. This means that more than 85% of the total number of stocks is available to trade. But on any “normal” day, only a small fraction of it trades. In INFY’s case, its 0.15%. And all this happens with an impact cost of 0.02%.
Now, contrast this to HATHWAY. Its free float is only 6% and about 1% of it trades in a day with an impact cost of ~1%
If you were equally bearish on these two stocks, which one is a better short?
The answer is INFY.
You are not the only shark in the tank
The biggest mistake that most investors make is assuming that they are the only player in the field. But the market is filled with sharks that will rush towards a drop of blood at the slightest hint.
In our example, when you short INFY, given the sheer amount of stocks available in the market, your actions are unlikely to raise eyebrows. However, if you shorted HATHWAY, then things are going to get interesting for you.
The dynamics of a short squeeze
Lets say that you are so bearish on HATHWAY that you decide to short about Rs. 100cr worth of the stock. Assuming that you were conservatively leveraged at 2x, all you had to do was put up Rs. 50cr in capital. But the total free float is Rs. 322cr and only about Rs. 1.7cr in value gets traded every day.
Either the news gets out that someone is short or the hero that you are, you send out a research report on why the company should be worth zero and everybody else should join you.
However, the sharks have their own take on this. It wouldn’t take much to move the price of a stock that trades only Rs. 1.7cr in value a day. Instead of shorting along with you, they decide to buy it. With its high impact cost, even a few small accounts buying 1-10 lakhs every day is enough to push the stock higher.
Now, you are on the clock. Every day, you have to post margin to maintain your short. You see the price go from Rs. 30 to 32, then to 35… 40. A 30% rise in price means that you have lost Rs. 30cr on a starting capital of Rs. 50cr. You decide to throw in the towel and buy some of the stock back. The sharks smell blood and move in for the kill.
There are no stocks to buy.
?? ???
Diamond hands to the moon.
You panic close your short and send the stock rocketing to the moon.
This is exactly what happened to GameStop last month.
Not the first time, and will not be the last
Short-squeezes have been around since the dawn of markets.
The earliest one in recorded history was Piggly Wiggly7, circa 1923. A short-squeeze sent the shares of the department store from $40 to $124. But in typical Wall Street style, when the going got tough, they just changed the rules8.
The shorts were cornered and only had until the next day (Wednesday) to deliver their shares. But then, the rules changed.
The Governing Committee of the Exchange announced a suspension in Piggly Wiggly trading and an extension to the short sellers delivery deadline. Saunders countered and offered a deal of $150 a share for delivery by end of day Thursday and $250 a share thereafter.
Unfortunately, very few short sellers came forward to pay Saunders what he wanted. Then, the Governing Committee delivered the death blow to Saunders. They restricted trading of Piggly Wiggly and gave the short sellers until the next Monday to deliver the shares.
The extension granted by the Committee gave the shorts enough time to find other shareholders across the country (i.e. widows and orphans) who they could buy shares from. Instead of getting paid in dollars, Saunders got the last thing he wanted—more Piggly Wiggly shares.
By the end of day Friday, most of the shorts had covered their positions and Saunders was left holding the bag while still $10 million in debt. He had lost. Wall Street had won.
One of the more memorable squeezes before GameStop was the Volkswagen Infinity Squeeze in 2008. Volkswagen was increasingly being viewed as a potential bankruptcy candidate. However, an orchestrated short squeeze on VW shares caused VW to briefly become the most valuable company in the world, worth more by market cap than Exxon Mobil.
On October 26th, 2008, rival automaker Porsche made a surprise announcement that it had increased its stake in VW to over 74%. It was a stealth move, made possible through the use of multiple purchases of cash-settled derivatives which had been accumulated separately through different European investment banks.
The short interest9 seemed not excessive, at just 12.8% of outstanding shares. But what the market failed to appreciate was that the true availability of tradeable shares to cover those short positions was actually far lower than what many understood.
Around 55% of VW shares were already unavailable in the market for any realistic purposes (mostly owned by index funds and sovereign wealth funds.) As a result, when Porsche increased its stake by an additional 44%, it meant that the true available float went down from 45% of outstanding shares to around just 1% of outstanding shares. Suddenly the seemingly “low” short interest of 12.8% turned in to a massive supply and demand imbalance. Millions of shares needed to be bought immediately even though there were simply no shares available to be sold.
Following the announcement by Porsche, the resulting panic caused a short squeeze in VW shares that saw the deeply troubled automaker briefly become the most valuable company in the world – despite being in the middle of the worst financial crisis since the great depression. VW’s share price briefly exceeded €1,000 intraday with a market cap of over €300 billion.
As a result of its skillful financial engineering, Porsche netted itself more than $10 billion in profits in a matter of just a few short weeks.
On the other side of the trade, the hedge funds who had sold VW short quickly saw their collective losses exceed $30 billion.
Which was crazier?
At the $483 peak on Jan. 27, $GME had gained $32B in market cap.
During the same period in Oct. 08, the Volkswagen Ordinary Shares gained $385B.
VW was crazier on this metric.
But VW shares were "only” up 262%. GME’s were up 2464%.
Impact cost is the cost that a buyer or seller of stocks incurs while executing a transaction due to the prevailing liquidity condition. It varies by transaction size and depends on outstanding orders.