Cycles usually turn and the most hated sectors end up bouncing back and out-performing the broader markets. Does the same apply to actively managed mutual funds? Should you bet on the asset manager’s luck turning and getting off to the races? Here are some “broken” funds that maybe of interest.
Escorts Infrastructure Fund
Since 2007-09-21, Escorts Infrastructure Fund has returned a cumulative -38.19% vs. CNX 500’s +58.39%. This fund should get a bad-timing award, having launched in 26-Jul-2007, if MorningStar is to be believed (factsheet.) If you are bullish on Indian infrastructure, you may be better off buying the INFRABEES ETF. [stockquote]INFRABEES[/stockquote]

JM Equity Fund
I wonder what the holdings of this fund were in 2008? It lost -71.81% (CNX 500: -64.26%) in value during the crash and is yet to recover. Seeing how well it tracked the broader market, it might make sense to just hold a CNX 500 index fund instead of paying this manager to actively run your investment to the ground.

JM Basic Fund
Since 2006-04-03, JM Basic Fund has returned a cumulative 4.72% vs. CNX 500’s cumulative return of 117.04%.
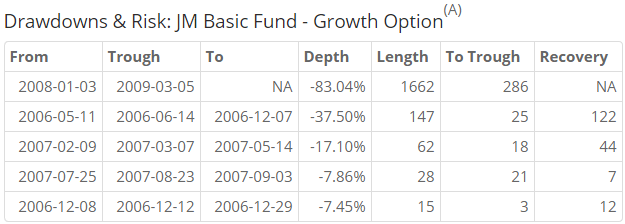
Looks like the fund blew up pretty much every year of its existence.
HSBC Progressive Themes Fund
Something happened in Oct-2010 that permanently changed the course of this fund.

Since 2006-04-03, HSBC Progressive Themes Fund has returned a cumulative 36.18% vs. CNX 500’s cumulative return of 117.04%. And since 2013-01-01, the number is 25.73% vs. 31.98%.
Progressively losing client’s money.
Taurus Bonanza Fund
This fund was a bonanza for the asset manager who continues to charge 2.83% on Rs. 250.8M of assets (MorningStar.) Since 2006-04-03, Taurus Bonanza Fund has returned a cumulative 51.66% vs. CNX 500’s cumulative return of 117.04%.
It is yet to recover from the 2008 crash and you are probably better off buying a CNX 100 or CNX 500 index fund instead of chasing this bonanza.

Conclusion
It is said that there is a lot you can learn from studying failure. By looking at the track records of these broken funds, I think the key take-away here is that buy-and-hold only works if you (a) understand what it is that you are holding, and (b) stick to a strict re-balance frequency. Moreover, betting on reversion to mean might only work if you are betting that an out-performing manager will fall back to mediocrity. The other direction is a tough ask.
You can run the comparison tool here: FundCompare
You can either WhatsApp him or call him at 080-2665-0232.
He is an AMFI registered IFA who can advice you on Mirae, HDFC, ICICI Pru, UTI and Birla Sun Life funds.