Author: shyam

Weekly Recap: We Are All Charlatans!

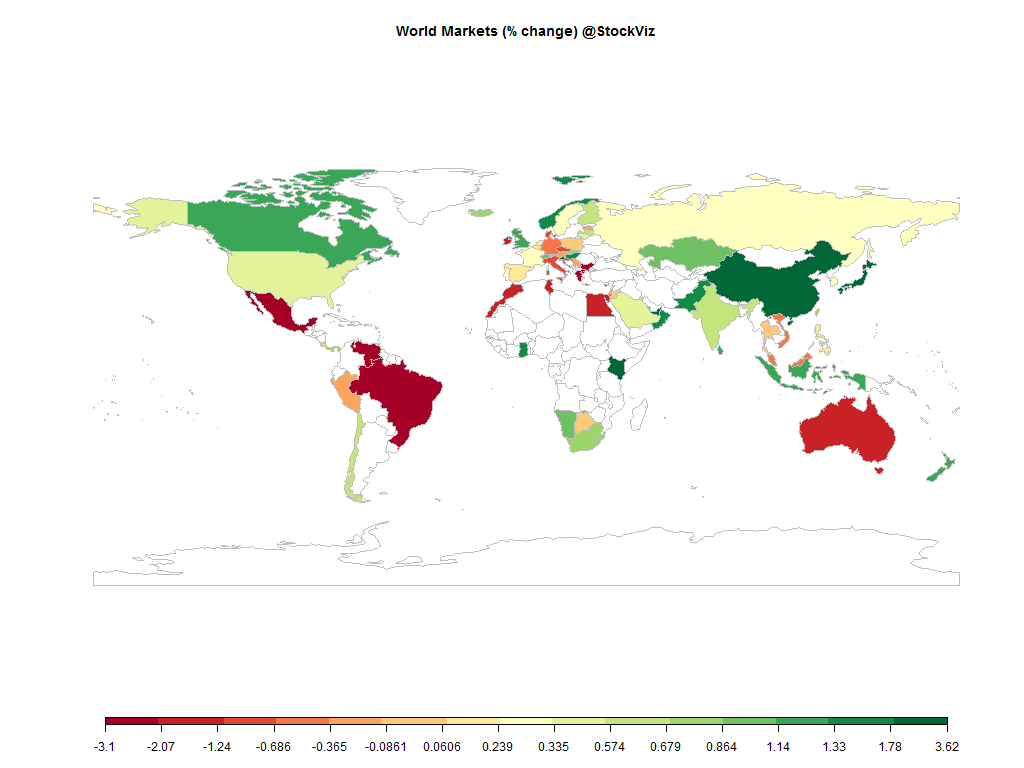
world.2014-09-26.2014-10-01

Equities

Major
DAX(DEU) -1.14%
CAC(FRA) -0.67%
UKX(GBR) -1.38%
NKY(JPN) -2.68%
SPX(USA) -1.69%
MINTs
JCI(IDN) -1.65%
INMEX(MEX) -0.89%
NGSEINDX(NGA) +0.96%
XU030(TUR) -0.78%
BRICS
IBOV(BRA) -7.82%
SHCOMP(CHN) +0.69%
NIFTY(IND) -0.29%
INDEXCF(RUS) -2.39%
TOP40(ZAF) -1.86%

Commodities

Energy
Brent Crude Oil -3.03%
Ethanol -2.97%
Heating Oil -1.53%
Natural Gas +1.03%
RBOB Gasoline -7.99%
WTI Crude Oil -2.79%
Metals
Copper +0.00%
Gold 100oz -0.16%
Palladium +0.80%
Platinum -0.69%
Silver 5000oz -1.15%

Currencies

USDEUR:+0.22% USDJPY:-0.59%

MINTs
USDIDR(IDN) +1.02%
USDMXN(MEX) -0.07%
USDNGN(NGA) -0.37%
USDTRY(TUR) +0.71%
BRICS
USDBRL(BRA) +2.67%
USDCNY(CHN) +0.22%
USDINR(IND) +0.74%
USDRUB(RUS) +1.33%
USDZAR(ZAF) -0.05%
Agricultural
Cattle +2.83%
Cocoa -4.47%
Coffee (Arabica) +8.16%
Coffee (Robusta) +5.12%
Corn -0.54%
Cotton -1.32%
Feeder Cattle +3.22%
Lean Hogs +0.54%
Lumber +5.46%
Orange Juice +0.35%
Soybean Meal -0.72%
Soybeans +0.96%
Sugar #11 +3.35%
Wheat +1.74%
White Sugar -2.27%

Credit Indices

Index Change
Markit CDX EM -1.00%
Markit CDX NA HY -0.63%
Markit CDX NA IG +5.15%
Markit CDX NA IG HVOL +10.77%
Markit iTraxx Asia ex-Japan IG +6.34%
Markit iTraxx Australia +3.53%
Markit iTraxx Europe +5.31%
Markit iTraxx Europe Crossover +15.46%
Markit iTraxx Japan +2.44%
Markit iTraxx SovX Western Europe +1.45%
Markit LCDX (Loan CDS) -0.06%
Markit MCDX (Municipal CDS) +6.13%
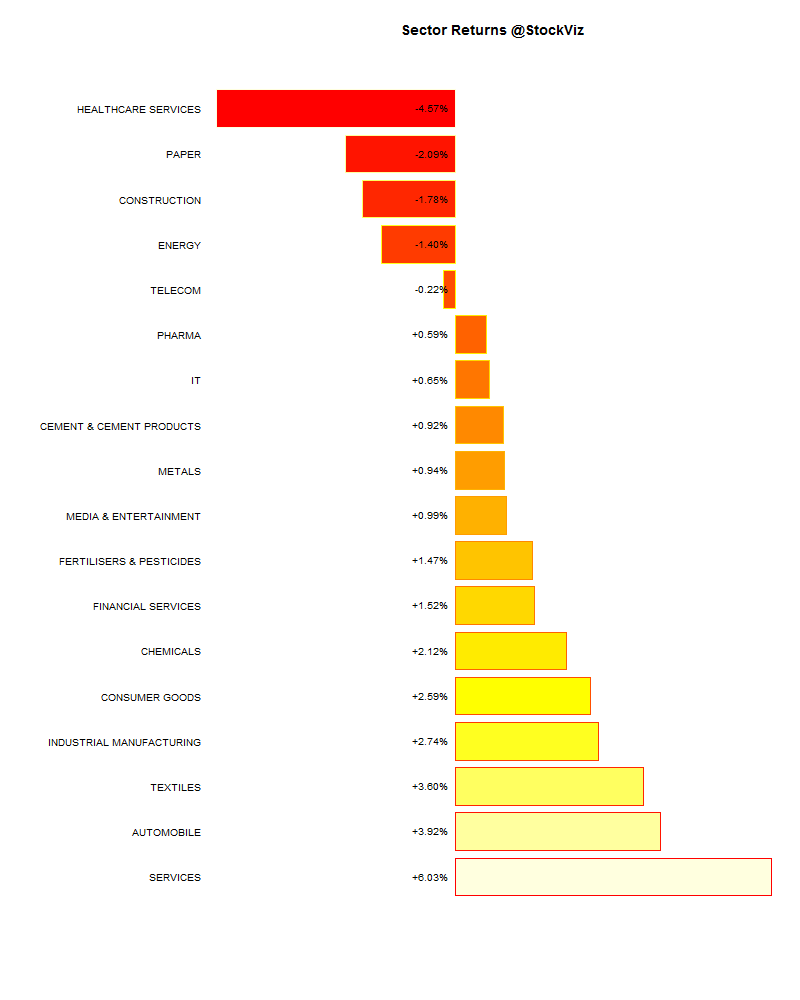
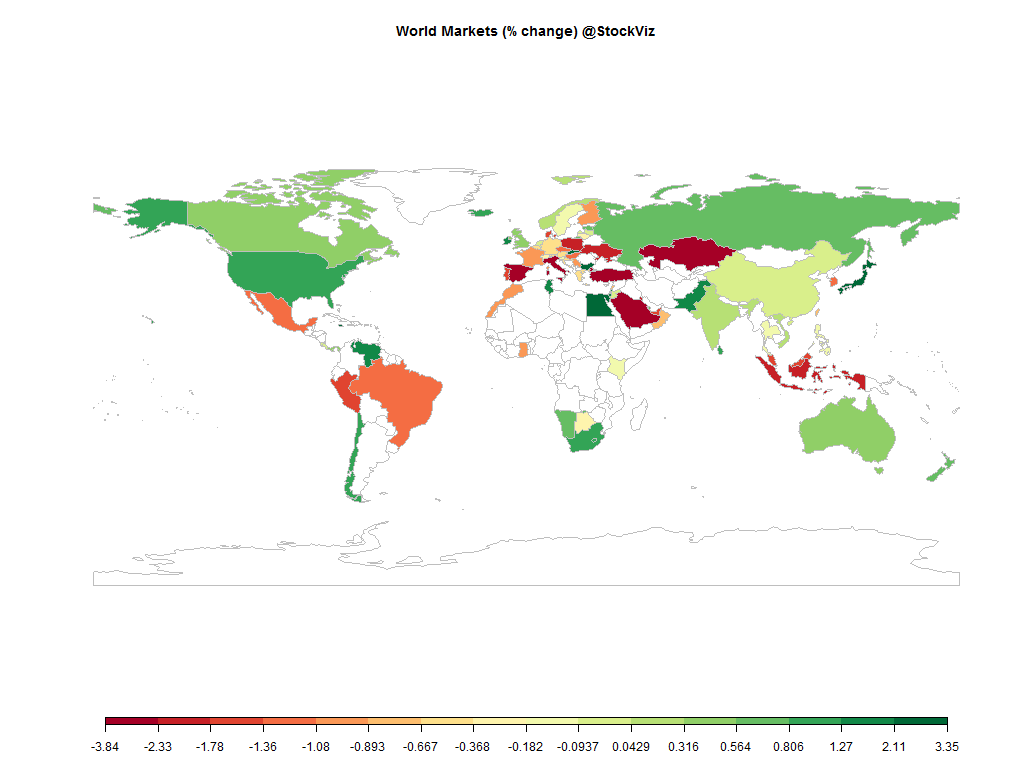
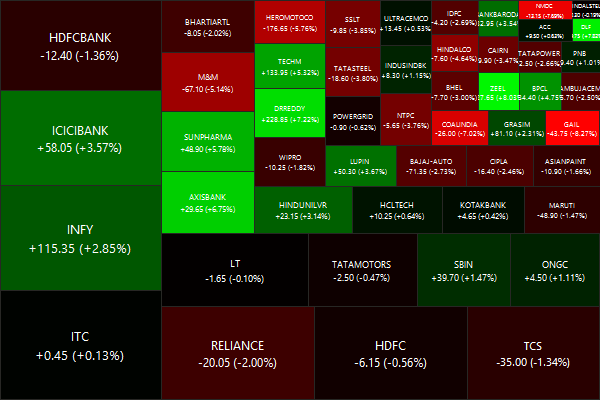
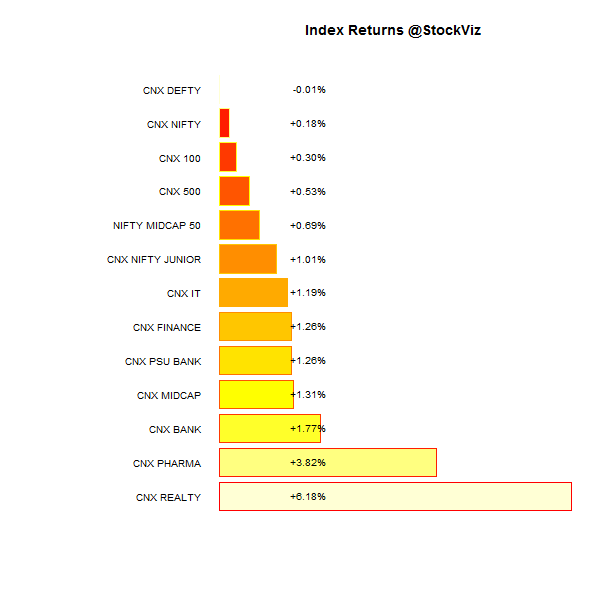
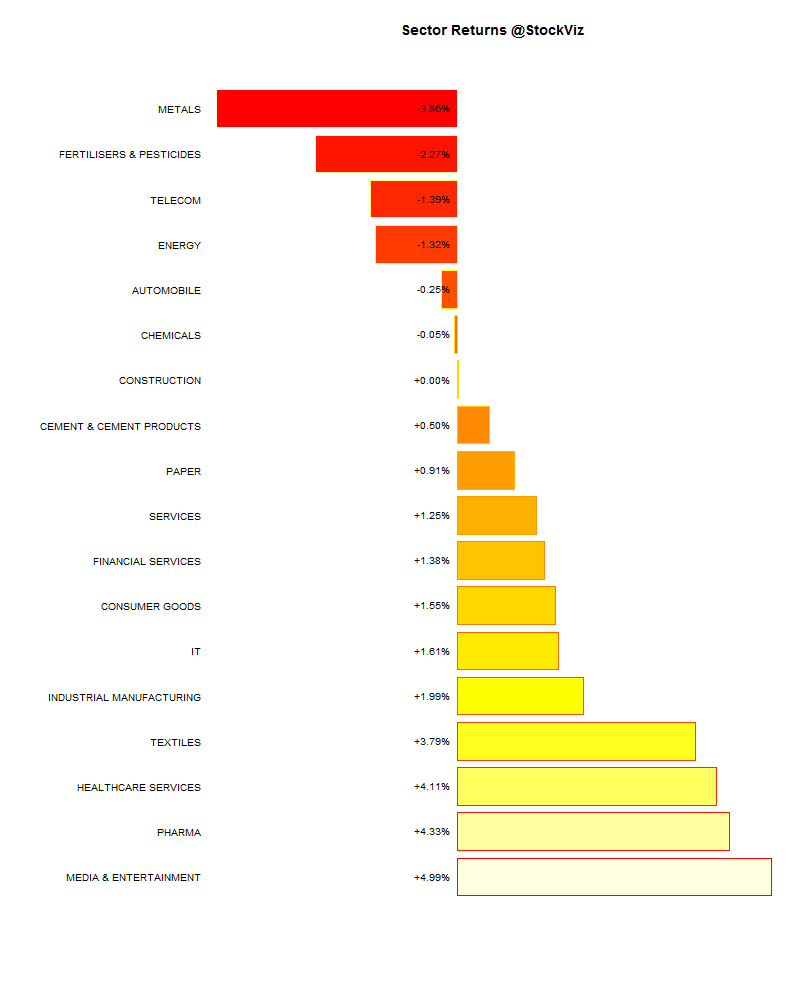
Rate sensitives took a dive. Credit spreads widened across the board. The dollar continued to strengthen. Indian IT and pharma continued to rally…

Nifty Heatmap

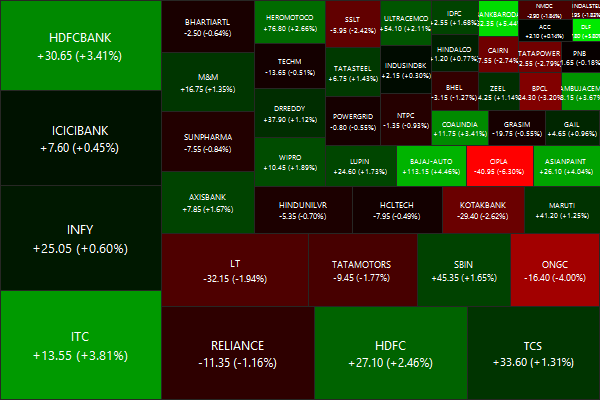
CNX NIFTY.2014-09-26.2014-10-01

Index Returns

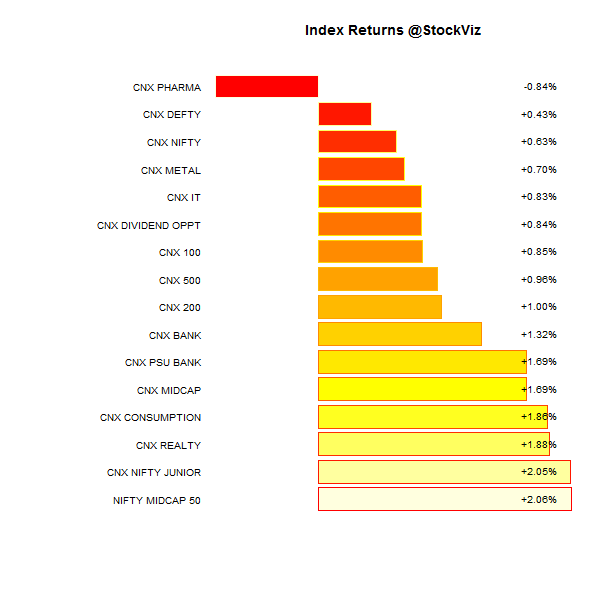
index performance.2014-09-26.2014-10-01

Sector Performance

sector performance.2014-09-26.2014-10-01

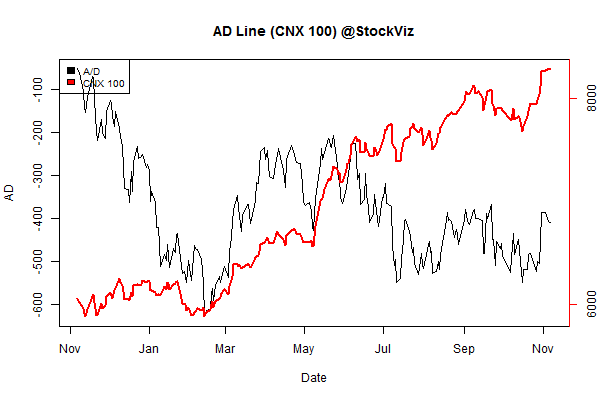
Advance Decline

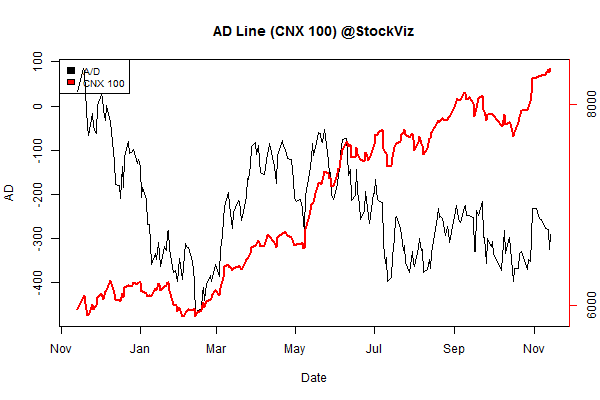
advance.decline.line2.2014-09-26.2014-10-01

Market Cap Decile Performance

Decile Mkt. Cap. Adv/Decl
1 (micro) -4.54% 76/59
2 +1.48% 74/61
3 +1.06% 71/65
4 +0.99% 66/68
5 +2.01% 70/65
6 -0.04% 70/65
7 +1.61% 71/64
8 +1.52% 72/63
9 +0.52% 64/71
10 (mega) -0.11% 65/71
Small and Mid-caps bounced back while Mega-caps remained under pressure.

Top Winners and Losers

COLPAL +5.87%
BAJAJFINSV +6.42%
SUNPHARMA +6.72%
DLF -7.47%
JINDALSTEL -7.15%
BANKINDIA -6.45%
RBI’s steadfast focus on inflation means we are in a holding pattern on rates. Whatever hopium that real-estate and banks were smoking is quickly fading away…

ETFs

INFRABEES +1.32%
JUNIORBEES +1.24%
PSUBNKBEES +0.26%
GOLDBEES -0.28%
NIFTYBEES -0.42%
CPSEETF -0.89%
BANKBEES -1.93%
Gold is getting totally pummeled by a rising US Dollar…

Gold Since 2008

Goldman - Gold ETF

Yield Curve

yield Curve.2014-09-26.2014-10-01

Bond Indices

Sub Index Change in YTM Total Return(%)
GSEC TB -0.10 +0.14%
GSEC SUB 1-3 +0.02 +0.20%
GSEC SUB 3-8 +0.09 -0.17%
GSEC SUB 8 +0.21 -1.57%
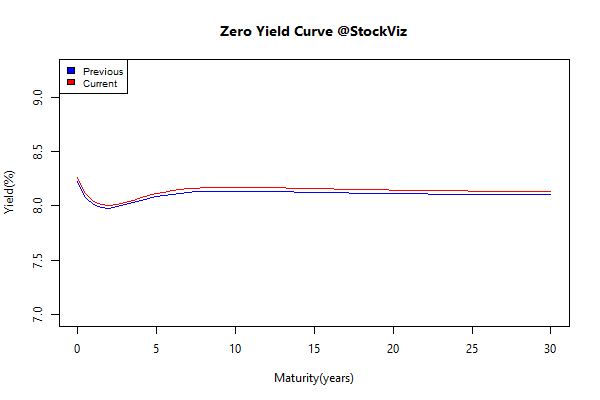
Is this the start of the curve getting steeper?

Nifty OI

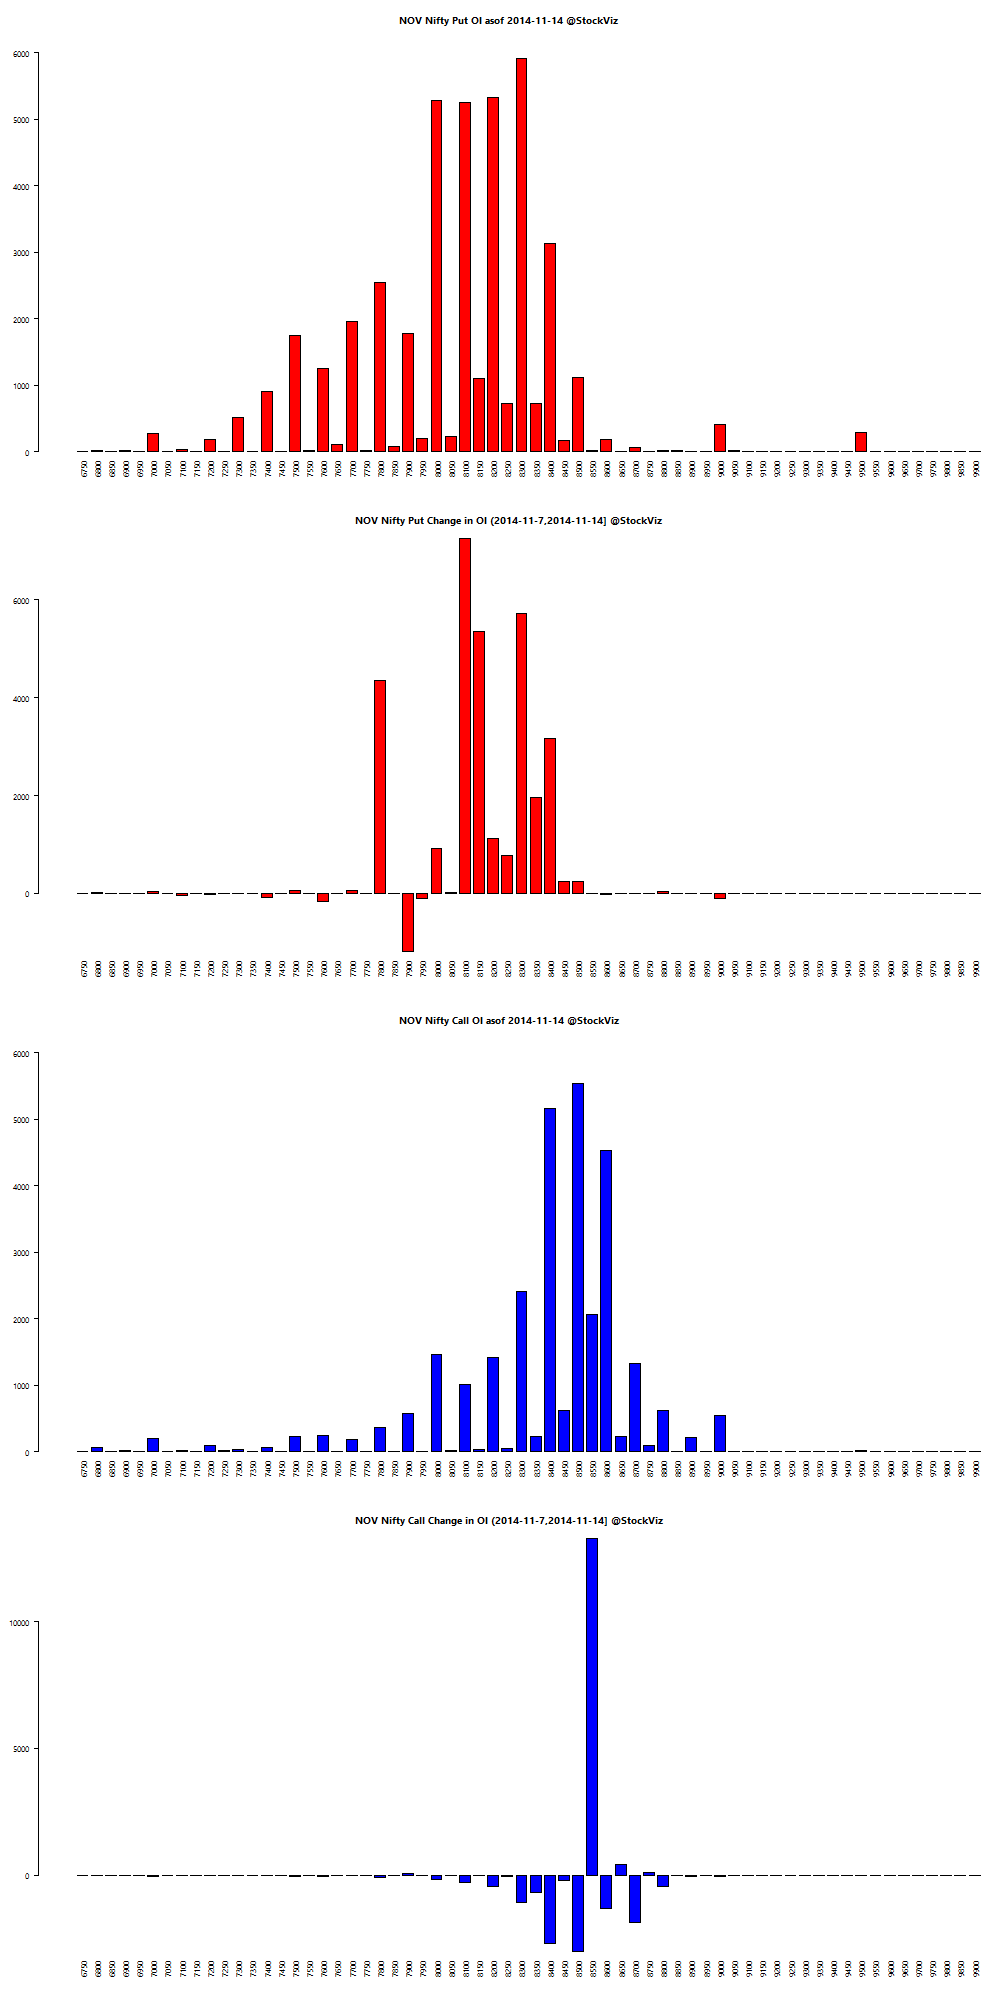
nifty.puts.calls.OCT.2014-09-26.2014-10-1

Bank Nifty OI

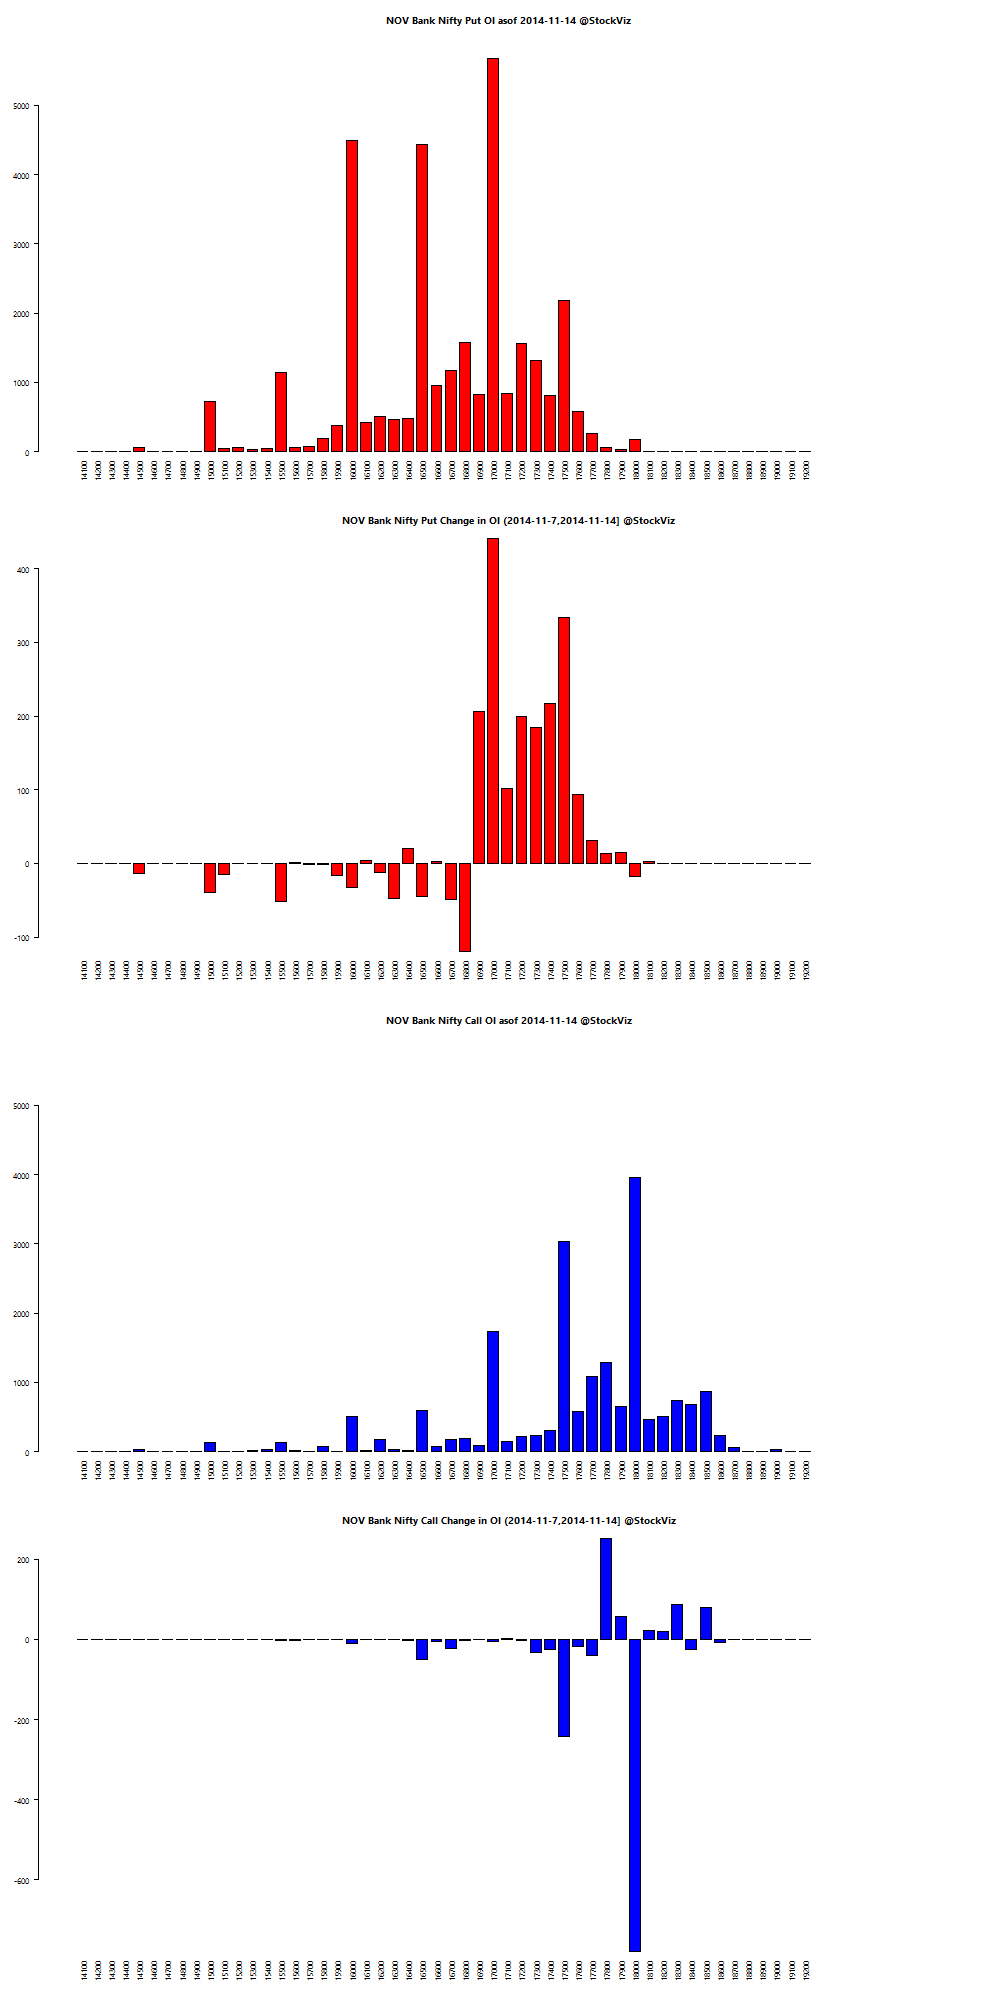
bank-nifty.puts.calls.OCT.2014-09-26.2014-10-1

Theme Performance

Thought for the weekend

We all make forecasts about the future. All of our portfolios are constructed by making forecasts and implicit assumptions about how certain asset class weightings will help us achieve our financial goals.

Of course, the future is extremely difficult to forecast. We don’t deal in certainties in life. We deal in probabilities.

Constructing a portfolio is a lot like forecasting the weather where you want to get married. You pick a place where it likely won’t rain, a time of year where it doesn’t rain much and then you cross your fingers and hope that your probabilistic forecast was smart. But you don’t just go and get married anywhere in the world just because the weather is difficult to predict.

Source: We Are All Charlatans!

Weekly Recap: Wiener’s Laws

world.2014-09-19.2014-09-26

Equities

Major
DAX(DEU) -3.15%
CAC(FRA) -1.49%
UKX(GBR) -2.76%
NKY(JPN) -0.56%
SPX(USA) -1.37%
MINTs
JCI(IDN) -1.82%
INMEX(MEX) -1.86%
NGSEINDX(NGA) -0.56%
XU030(TUR) -3.28%
BRICS
IBOV(BRA) -1.55%
SHCOMP(CHN) +0.78%
NIFTY(IND) -1.88%
INDEXCF(RUS) +0.18%
TOP40(ZAF) -3.59%

Commodities

Energy
Brent Crude Oil -0.96%
Ethanol -5.53%
Heating Oil -0.32%
Natural Gas +4.81%
RBOB Gasoline +2.21%
WTI Crude Oil +1.35%
Metals
Copper -1.62%
Gold 100oz +0.03%
Palladium -3.99%
Platinum -2.64%
Silver 5000oz -2.23%

Currencies

USDEUR:+1.21% USDJPY:+0.30%

MINTs
USDIDR(IDN) +0.65%
USDMXN(MEX) +1.59%
USDNGN(NGA) +0.35%
USDTRY(TUR) +1.23%
BRICS
USDBRL(BRA) +1.60%
USDCNY(CHN) -0.23%
USDINR(IND) +0.54%
USDRUB(RUS) +1.93%
USDZAR(ZAF) +1.31%
Agricultural
Cattle +1.71%
Cocoa +0.85%
Coffee (Arabica) +3.76%
Coffee (Robusta) +1.24%
Corn -2.56%
Cotton -3.36%
Feeder Cattle +1.22%
Lean Hogs +0.71%
Lumber -0.40%
Orange Juice +0.70%
Soybean Meal -5.19%
Soybeans -4.96%
Sugar #11 +14.81%
Wheat +0.11%
White Sugar +4.54%

Credit Indices

Index Change
Markit CDX EM +0.47%
Markit CDX NA HY -0.62%
Markit CDX NA IG +2.16%
Markit CDX NA IG HVOL +4.37%
Markit iTraxx Asia ex-Japan IG +2.42%
Markit iTraxx Australia +3.32%
Markit iTraxx Europe +1.58%
Markit iTraxx Europe Crossover +10.58%
Markit iTraxx Japan +2.76%
Markit iTraxx SovX Western Europe -1.81%
Markit LCDX (Loan CDS) -0.04%
Markit MCDX (Municipal CDS) +1.93%
The dollar rally continued and most equity markets ended the week in the red. It took S&P’s pat on the head for the Indian markets to post a decent number on the board. Things could have been much worse if not for that. This may not be “taper tantrum” but as the US embarks on tighter monetary policy, capital has a tendency to flee frontier/emerging markets.

Nifty Heatmap

CNX NIFTY.2014-09-19.2014-09-26

Index Returns

index performance.2014-09-19.2014-09-26

Sector Performance

sector performance.2014-09-19.2014-09-26

Advance Decline

advance.decline.line2.2014-09-19.2014-09-26

Market Cap Decile Performance

Decile Mkt. Cap. Adv/Decl
1 (micro) -10.46% 62/80
2 -6.95% 63/79
3 -7.08% 57/85
4 -6.95% 54/88
5 -6.63% 49/93
6 -5.12% 62/80
7 -6.80% 54/88
8 -6.25% 63/79
9 -5.39% 65/77
10 (mega) -2.06% 69/73
Midcaps and Smallcaps bled out. The Nifty maybe down 1.88% but just look at the rest of the market…

Top Winners and Losers

ITC +3.42%
GSKCONS +5.25%
GLAXO +8.18%
OFSS -15.09%
BANKINDIA -14.23%
JINDALSTEL -12.65%
Flight to safety? OFSS doesn’t count because it paid out a dividend of Rs 485/- per share… JSPL got dinged because of the coal verdict…

ETFs

GOLDBEES -0.13%
CPSEETF -0.40%
NIFTYBEES -1.50%
BANKBEES -2.53%
JUNIORBEES -3.50%
PSUBNKBEES -6.04%
INFRABEES -6.21%
WTF?! All ETFs in the red?

Yield Curve

yield Curve.2014-09-19.2014-09-26

Bond Indices

Sub Index Change in YTM Total Return(%)
GSEC TB +0.01 +0.15%
GSEC SUB 1-3 +0.02 +0.29%
GSEC SUB 3-8 -0.19 +0.66%
GSEC SUB 8 -0.35 +2.52%
Long end of the curve is probably over-bought at this point… But then again, falling inflation and an expectation of rate-cuts will do that.

Nifty OI

nifty.puts.calls.OCT.2014-09-19.2014-09-26

Bank Nifty OI

bank-nifty.puts.calls.OCT.2014-09-19.2014-09-26

Theme Performance

Thought for the weekend

To make planes safer these days, engineers have designed automated systems that basically allow the planes to fly themselves. An unintended consequence of increased safety for the plane is increased complexity for the pilots. Industry experts have warned of the side effects that can arise from this increased complexity for a number of years now. One of the cautionary voices was that of an engineer named Earl Wiener. Here’s “Wiener’s Laws” adapted to the financial markets:

Every device creates its own opportunity for human error.
Any financial model is only as good as the person or team using it.

Exotic devices create exotic problems.
Complex strategies can create unforeseen complications.

Digital devices tune out small errors while creating opportunities for large errors.
Risk comes in many forms and some models can lead to a false sense of security if you’re not aware of the imbedded risks.

Some problems have no solution.
You have to choose which form of risk you want to deal with, risk now or risk in the future.

It takes an airplane to bring out the worst in a pilot.
Financial markets magnify bad behavior in even some of the most intelligent people.

Whenever you solve a problem, you usually create one. You can only hope that the one you created is less critical than the one you eliminated.
There’s no such thing a perfect portfolio or process. Every strategy involves trade-offs.

Sources:
When Exotic Devices Create Exotic Problems
The Human Factor

Long-term Gilt Funds

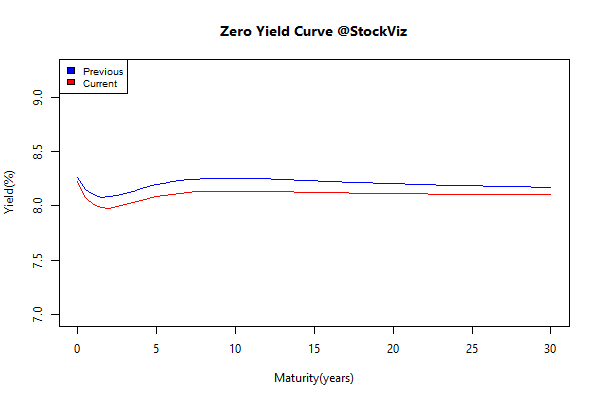
With the consensus on RBI rate cuts beginning next year, investors have been lapping up long-term government bonds (gsecs or gilts, if you wish.) The long-end has been bid so hard that the yield curve is flat as a pancake.

zero.curve.2012-01-05.2014-09-25

GSec Total Return Indices have tracked this, except for the hiccup back in May last year.

Short-term:

GSEC_SUB_1-3.2012-01-05.performance

Medium-term:

GSEC_SUB_3-8.2012-01-05.performance

Long-term:

GSEC_SUB_8.2012-01-05.performance

Drawdowns

May’13 was a rude reminder to investors who thought that you cannot lose money investing in government bonds. You can. Investors in the long-end of the curve are yet to recover from the drawdown last year.

gsec draws

Should you expect actively managed gilt funds to do better?

UTI – GILT ADVANTAGE vs. ICICI Prudential Long Term Gilt

UTI’s fund has a much shorter duration compared to ICICI’s (4.1 vs. 7.35 years.) And the returns that the funds have posted exemplify the importance of incorporating the fund portfolio’s duration into your decision making.

Since 2012-01-05, UTI – GILT ADVANTAGE-LONG TERM has returned a cumulative 24.59% vs. ICICI Prudential Long Term Gilt Fund’s cumulative return of 20.16%.

UTI – GILT ADVANTAGE vs. Birla Sun Life Gilt Plus

Since 2012-01-05, UTI – GILT ADVANTAGE has returned a cumulative 24.59% vs. Birla Sun Life Gilt Plus’s cumulative return of 14.79%. And BSL’s fund is yet to recover from the May’13 drawdown.

birla gilt drawdown

UTI – GILT ADVANTAGE vs. HDFC Gilt Fund-Long Term

Since 2012-01-05, UTI – GILT ADVANTAGE has returned a cumulative 24.59% vs. HDFC Gilt Fund-Long Term’s cumulative return of 22.01%. Of the three funds we compared, this is the closest any gilt fund has come to matching UTI’s returns.

UTI – GILT ADVANTAGE vs. GSEC SUB 3-8 TRI

Since 2012-01-05, UTI – GILT ADVANTAGE-LONG TERM has returned a cumulative 24.59% vs. GSEC SUB 3-8’s cumulative return of 18.55%. The fund beat the sub-index hands-down.

Conclusion

It looks like the UTI Gilt Advantage fund is a well managed fund that has beat its peers and benchmarks. But as the standard disclaimer reads, “past performance does not necessarily predict future results.”

You can run the comparison tool here: FundCompare


Please don’t treat the information here as investment advice.
If you want advice on investing in mutual funds, please get in touch with Shyam.
You can either WhatsApp him or call him at 080-2665-0232.
He is an AMFI registered IFA who can advice you on HDFC, ICICI Pru, UTI and Birla Sun Life funds.

Are Index Funds trying to beat the Index?

Ideally, Index Funds should just track an index. Its the holy-grail of passive indexing – don’t try to be smart picking stocks, just invest in an index tracking fund and let the market work for you. Index Funds are supposed to only focus on reducing tracking error and fees. The NIFTYBEES ETF does the job pretty well:

NIFTYBEES

Since 2005-01-03, Goldman – Nifty ETF has returned a cumulative 275.22% vs. CNX NIFTY’s cumulative return of 278.36%. Chalk up the difference to asset management fees. But the story with Index Funds offered by leading AMCs is a head scratcher.

IDFC Nifty Fund

Since 2010-05-03, IDFC Nifty Fund-Regular Plan-Growth has returned a cumulative 61.17% vs. CNX NIFTY’s cumulative return of 51.62%.

IDFC nifty

LIC NOMURA MF Nifty Index Fund

Since 2010-01-04, LIC NOMURA MF Index Fund-Nifty-Growth has returned a cumulative 54.78% vs. CNX NIFTY’s cumulative return of 52.95%.

lic nifty

Taurus Nifty Index Fund

Since 2010-06-21, Taurus Nifty Index Fund – Growth Option has returned a cumulative 46.82% vs. CNX NIFTY’s cumulative return of 52.06%. Oops!

taurus nifty

IDBI NIFTY Index Fund

Since 2010-06-30, IDBI NIFTY Index Fund Growth has returned a cumulative 49.48% vs. CNX NIFTY’s cumulative return of 52.25%.

IDBI Nifty

Question

If the NIFTYBEES ETF can track the index with a 0.09% tracking error and an expense ratio of 0.5%, why would anybody invest in any of the NIFTY Index Funds?

You can run the comparison tool here: FundCompare


Please don’t treat the information here as investment advice.
If you want advice on investing in mutual funds, please get in touch with Shyam.
You can either WhatsApp him or call him at 080-2665-0232.
He is an AMFI registered IFA who can advice you on HDFC, ICICI Pru, UTI and Birla Sun Life funds.

Lessons from the Latin American Debt Crisis

Excellent article at Pieria. Here’s the tl;dr:

Three times over the past thirty years the major banks have actually been bankrupt. This is what we have learnt:

  1. Short-term profits mean more to bankers than long-term risks.
  2. As long as banks are willing to roll over debts, silly loans are not dangerous to anyone.
  3. No matter how free market an ideologue a Central Banker is, he will overcome his inhibitions and do whatever it takes to save the big banks.
  4. The first thing the central bankers need to do when the banking system is effectively bankrupt is hide this truth.

Tools Central Bankers have used:

  • Get the taxpayers to buy the dumb loans from the banks.
  • Cut the short-term rates so that banks can borrow cheaply while letting long term rates remain high. Since banks borrow short and lend long, this means their profits skyrocket.
  • Impose austerity.

Read the whole thing here: LATIN AMERICA: THE ARCHETYPAL FINANCIAL CRISIS