Equities
| MINTs | |
|---|---|
| JCI(IDN) | +0.48% |
| INMEX(MEX) | +1.36% |
| NGSEINDX(NGA) | +6.52% |
| XU030(TUR) | -0.50% |
| BRICS | |
|---|---|
| IBOV(BRA) | +1.08% |
| SHCOMP(CHN) | +1.34% |
| NIFTY(IND) | +0.32% |
| INDEXCF(RUS) | -2.47% |
| TOP40(ZAF) | +0.30% |
Commodities
| Energy | |
|---|---|
| Brent Crude Oil | -1.67% |
| RBOB Gasoline | +1.77% |
| WTI Crude Oil | -3.96% |
| Heating Oil | +8.30% |
| Natural Gas | +5.42% |
| Ethanol | +0.28% |
| Metals | |
|---|---|
| Palladium | -1.69% |
| Platinum | -3.61% |
| Copper | +0.00% |
| Gold 100oz | -2.36% |
| Silver 5000oz | -3.53% |
Currencies
| MINTs | |
|---|---|
| USDIDR(IDN) | +0.21% |
| USDMXN(MEX) | +0.90% |
| USDNGN(NGA) | -1.94% |
| USDTRY(TUR) | -0.32% |
| BRICS | |
|---|---|
| USDBRL(BRA) | +1.21% |
| USDCNY(CHN) | +0.25% |
| USDINR(IND) | +0.04% |
| USDRUB(RUS) | -2.38% |
| USDZAR(ZAF) | +0.05% |
| Agricultural | |
|---|---|
| Cattle | -2.49% |
| Cocoa | +1.04% |
| Cotton | +2.94% |
| Lean Hogs | +8.86% |
| Soybean Meal | +4.14% |
| Soybeans | +0.83% |
| Sugar #11 | -3.09% |
| Wheat | -4.05% |
| White Sugar | -0.47% |
| Coffee (Arabica) | -9.31% |
| Feeder Cattle | -2.69% |
| Lumber | -2.84% |
| Corn | -0.13% |
| Orange Juice | -4.07% |
| Coffee (Robusta) | -3.28% |
Credit Indices
| Index | Change |
|---|---|
| Markit CDX EM | +0.20% |
| Markit CDX NA HY | -0.06% |
| Markit CDX NA IG | -1.35% |
| Markit iTraxx Asia ex-Japan IG | -4.89% |
| Markit iTraxx Australia | -4.29% |
| Markit iTraxx Europe | -3.72% |
| Markit iTraxx Europe Crossover | -12.07% |
| Markit iTraxx Japan | -1.86% |
| Markit iTraxx SovX Western Europe | +0.22% |
| Markit LCDX (Loan CDS) | +0.00% |
| Markit MCDX (Municipal CDS) | +1.66% |
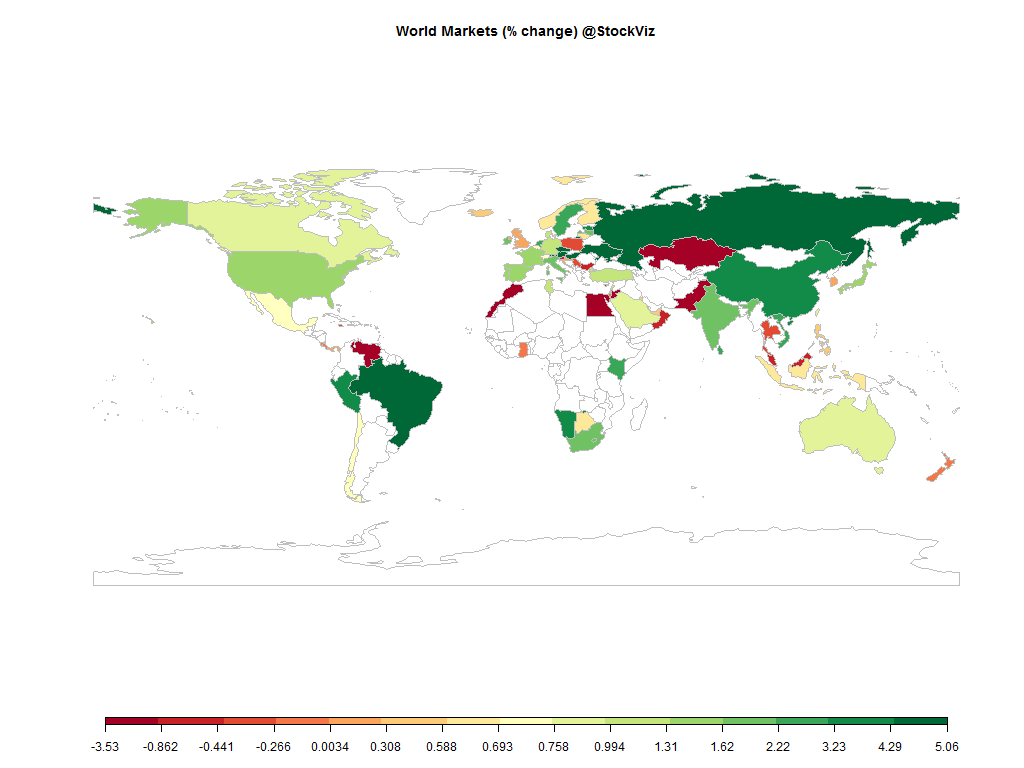
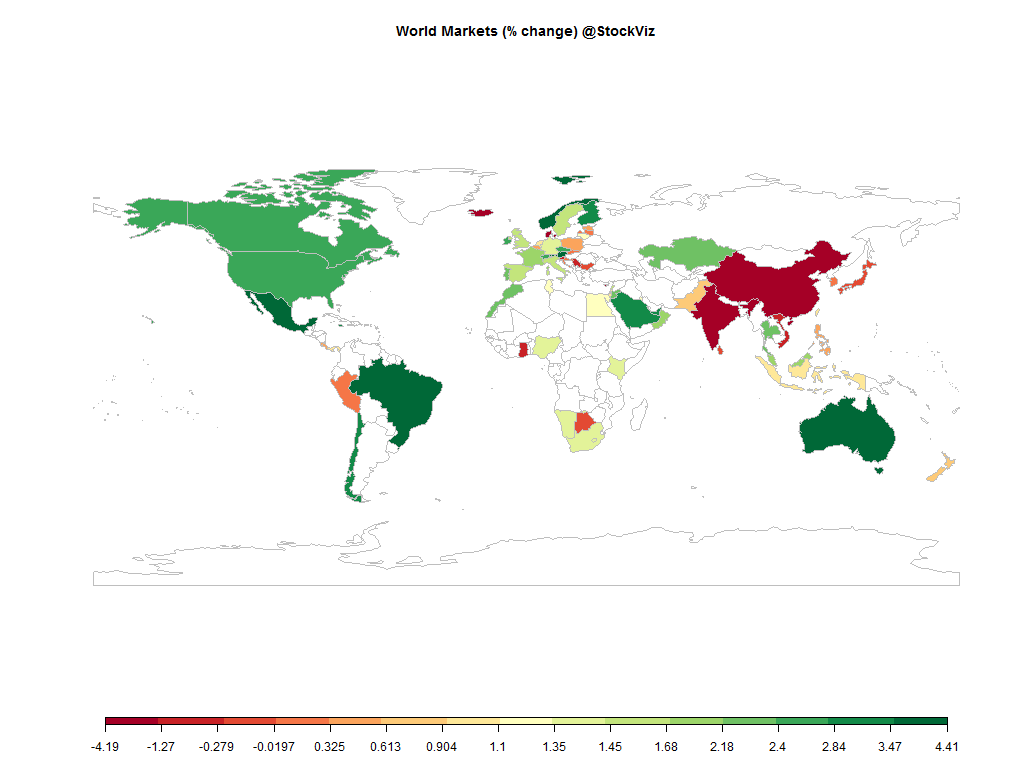
Most equity markets ended this week on a positive note. The precious metals complex, however, were gasping for breath. The US Dollar rally remained somewhat intact. Credit spreads mostly tighter…
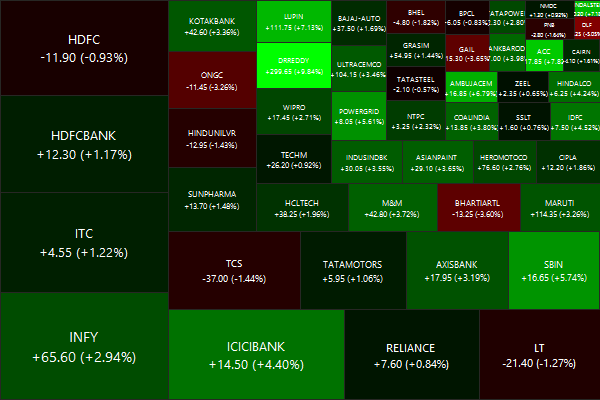
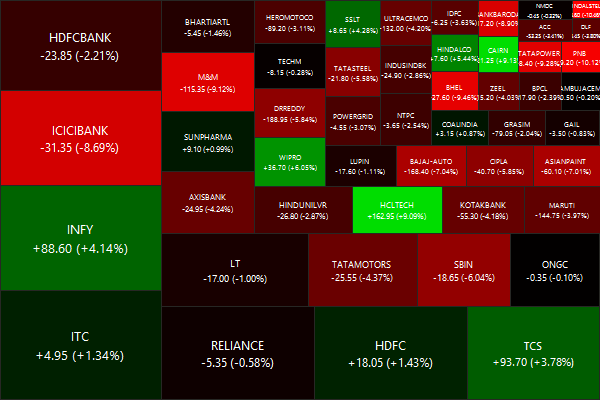
Nifty Heatmap
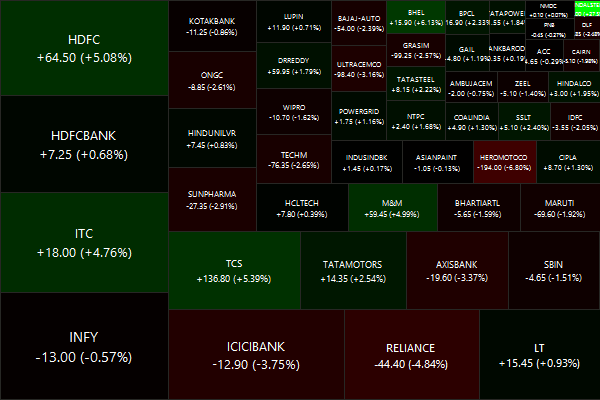
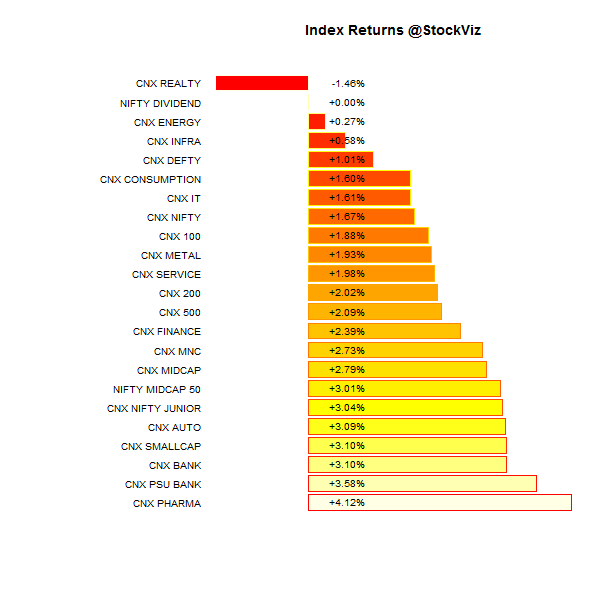
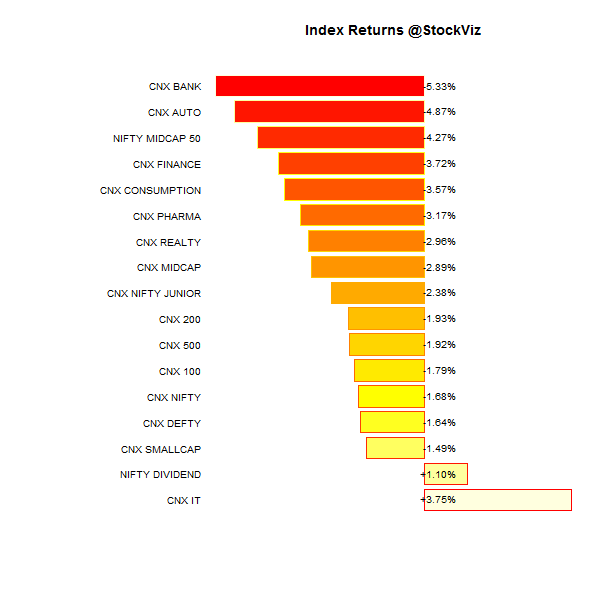
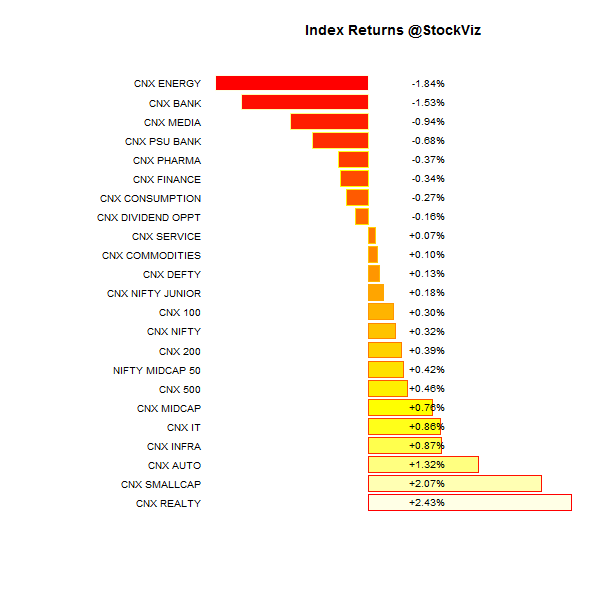
Index Returns
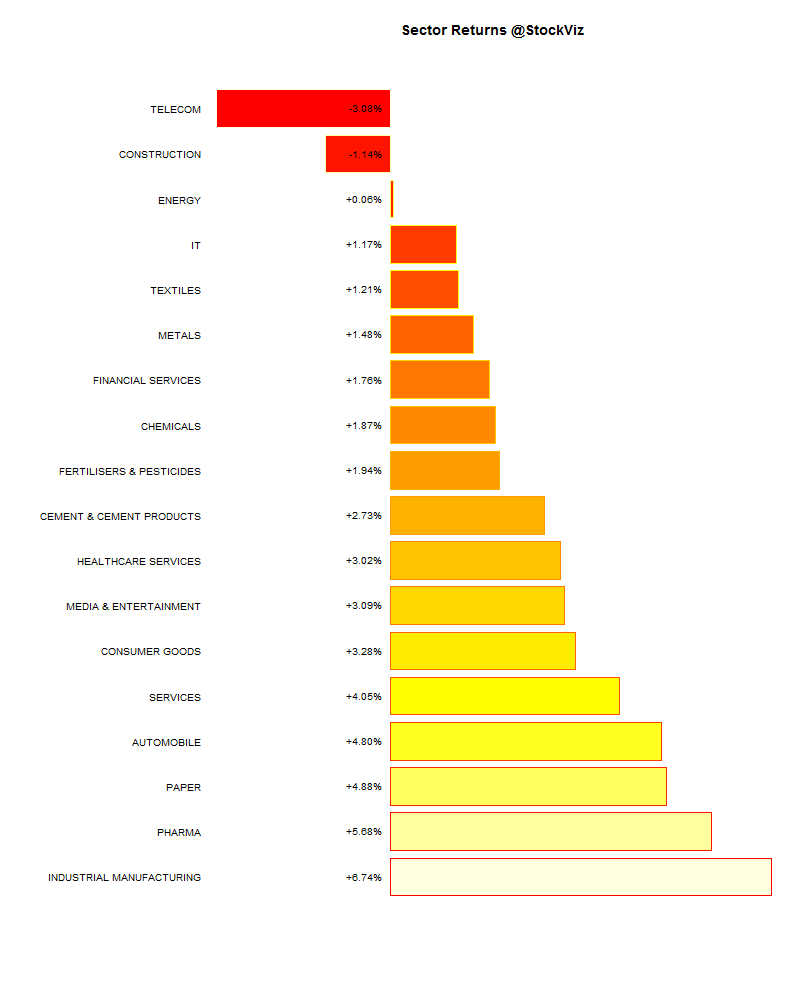
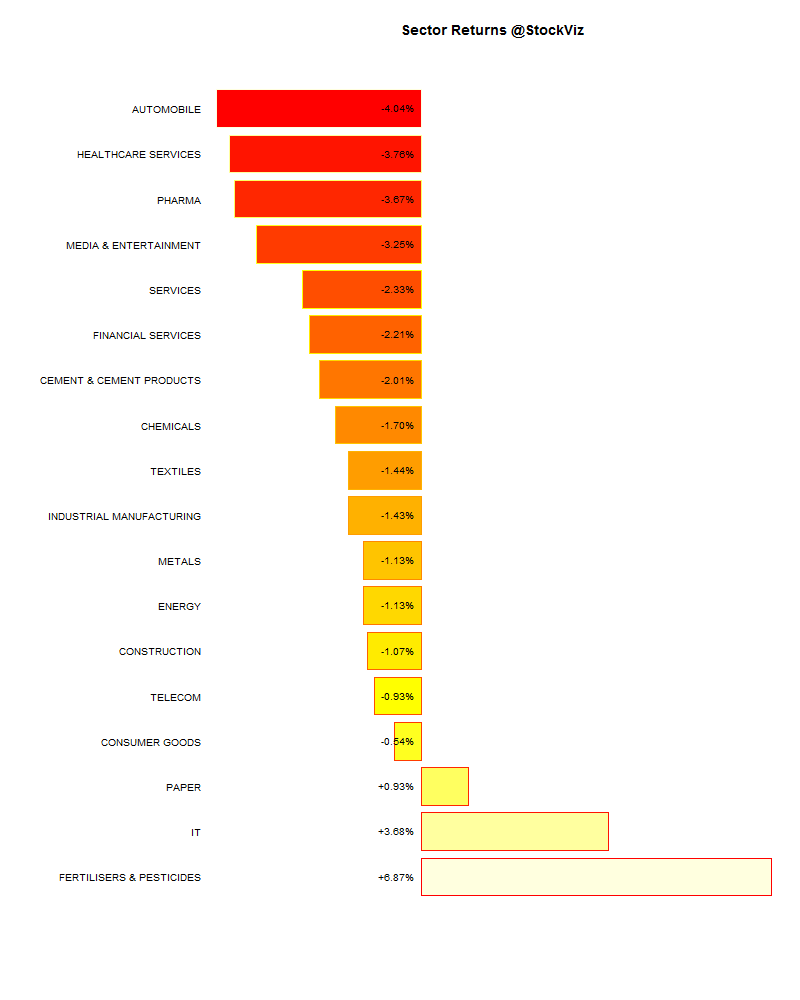
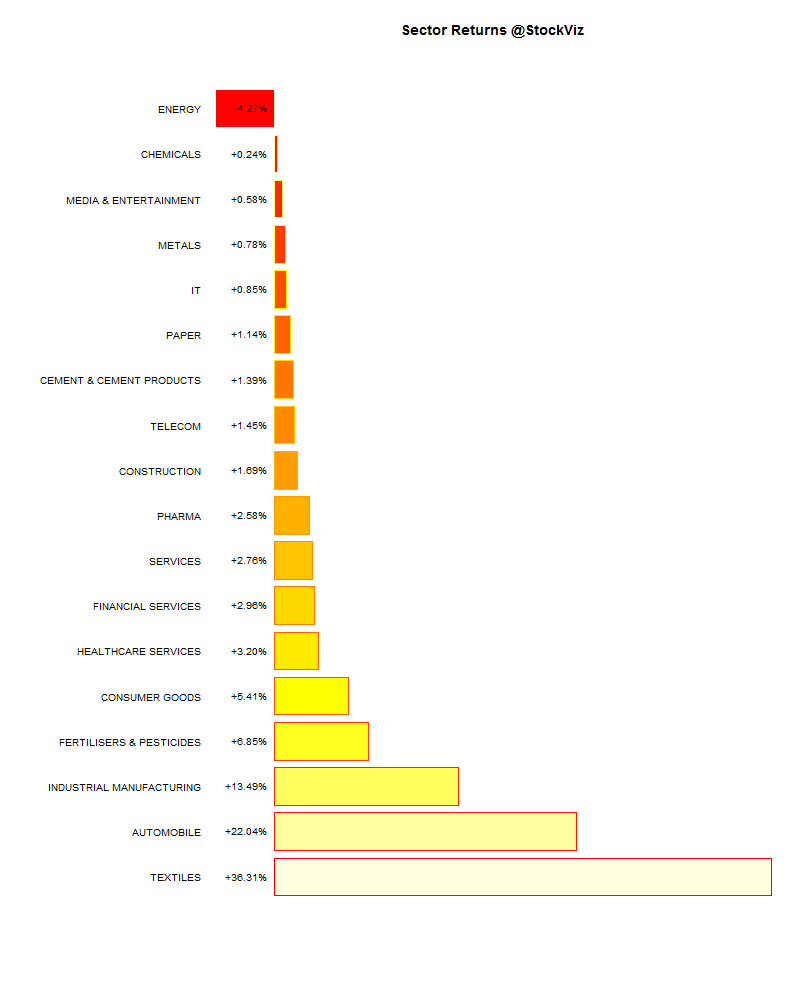
Sector Performance
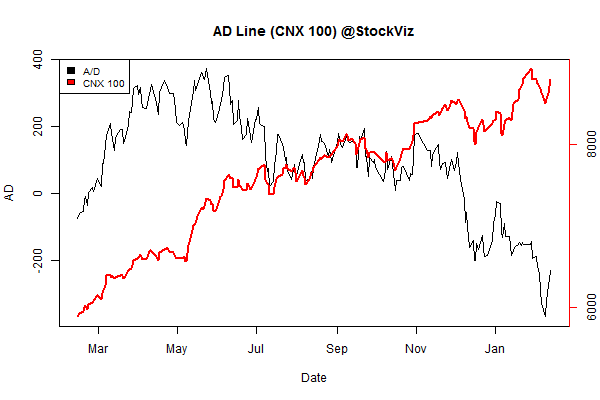
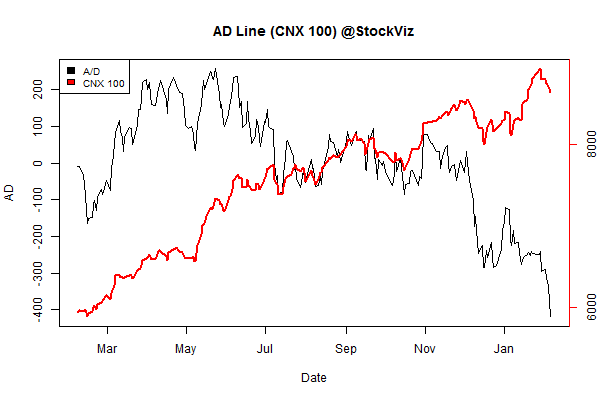
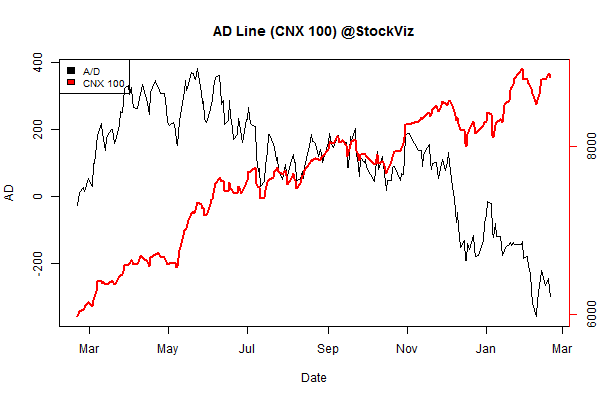
Advance Decline
Market Cap Decile Performance
| Decile | Mkt. Cap. | Adv/Decl |
|---|---|---|
| 1 (micro) | -0.96% | 71/62 |
| 2 | +0.48% | 62/71 |
| 3 | +5.52% | 72/61 |
| 4 | +3.51% | 75/58 |
| 5 | +2.91% | 69/64 |
| 6 | +2.53% | 69/64 |
| 7 | +2.77% | 69/64 |
| 8 | +2.84% | 70/63 |
| 9 | +3.18% | 68/65 |
| 10 (mega) | +2.73% | 66/67 |
Midcaps outperformed the large-caps.
Top Winners and Losers
| BHARATFORG | +7.76% |
| CONCOR | +11.59% |
| JINDALSTEL | +27.59% |
| HEROMOTOCO | -6.80% |
| GODREJCP | -6.25% |
| PETRONET | -5.68% |
Bharatforge was up on defense and joint-venture announcements; Hero Motors’ promoters are dumping their own stock and the market is not taking it lying down…
ETF Performance
| PSUBNKBEES | +2.11% |
| CPSEETF | +1.77% |
| INFRABEES | +0.54% |
| JUNIORBEES | +0.12% |
| NIFTYBEES | -0.24% |
| GOLDBEES | -1.10% |
| BANKBEES | -2.12% |
Private vs. Public sector banks: a delicate balance between the well and awfully managed; between efficiency and never-ending bailouts; profit-motive vs. political calculus; a cold-embrace where just when one tries to make a profit, the other can light tax-payer money on fire…
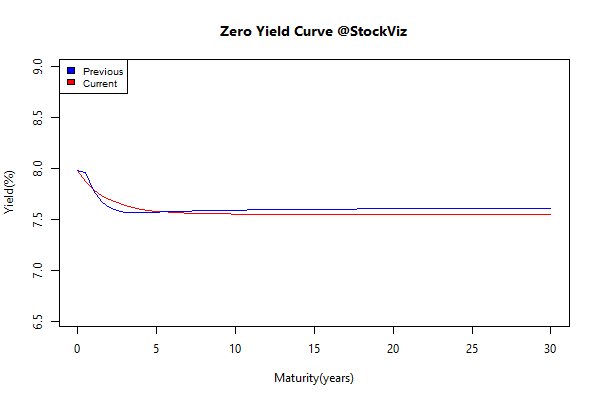
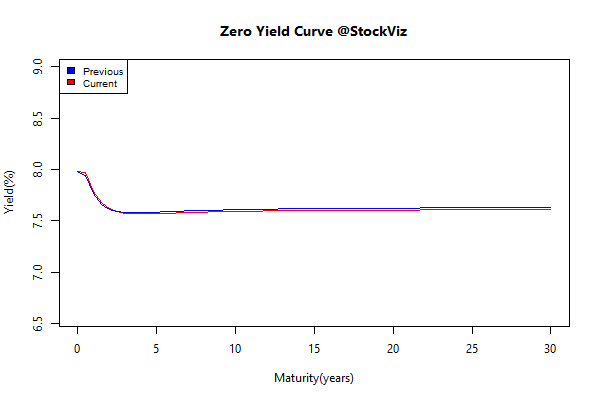
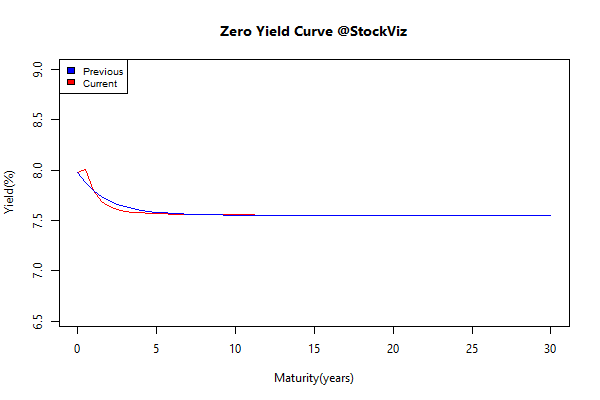
Yield Curve
Bond Indices
| Sub Index | Change in YTM | Total Return(%) |
|---|---|---|
| GSEC TB | -0.10 | +0.18% |
| GSEC SUB 1-3 | -0.21 | +0.05% |
| GSEC SUB 3-8 | -0.10 | +0.37% |
| GSEC SUB 8 | -0.04 | -0.21% |
Flat curve, flatter P&L
Investment Theme Performance
| Quality to Price | +5.35% |
| The Other Value | +3.47% |
| Market Elephants | +2.66% |
| Financial Strength Value | +2.54% |
| Market Fliers | +2.52% |
| ADAG Mania | +2.30% |
| IT 3rd Benchers | +1.82% |
| Momentum 200 | +1.67% |
| Growth with Moat | +1.59% |
| Efficient Growth | +1.33% |
| Auto | +0.58% |
| Balance-sheet Strength | +0.29% |
| Refract: PPFAS Long Term Value Fund | +0.28% |
| CNX 100 50-Day Tactical | -0.06% |
| Enterprise Yield | -0.36% |
| Piotroski ROC Small Caps | -0.49% |
| Old Economy Value | -0.72% |
| Magic Formula Investing | -2.12% |
Most investment strategies performed well.
Equity Mutual Funds
Bond Mutual Funds
Thought for the weekend
Why are there lots of single “boring Bernards and psycho Suzies?”
Because good couples stay together for longer.
Even if there is a large share of good romantic partners, most single people are crazy.
Even if only 50% of the population is crazy, in equilibrium around 63% of single people are crazy.