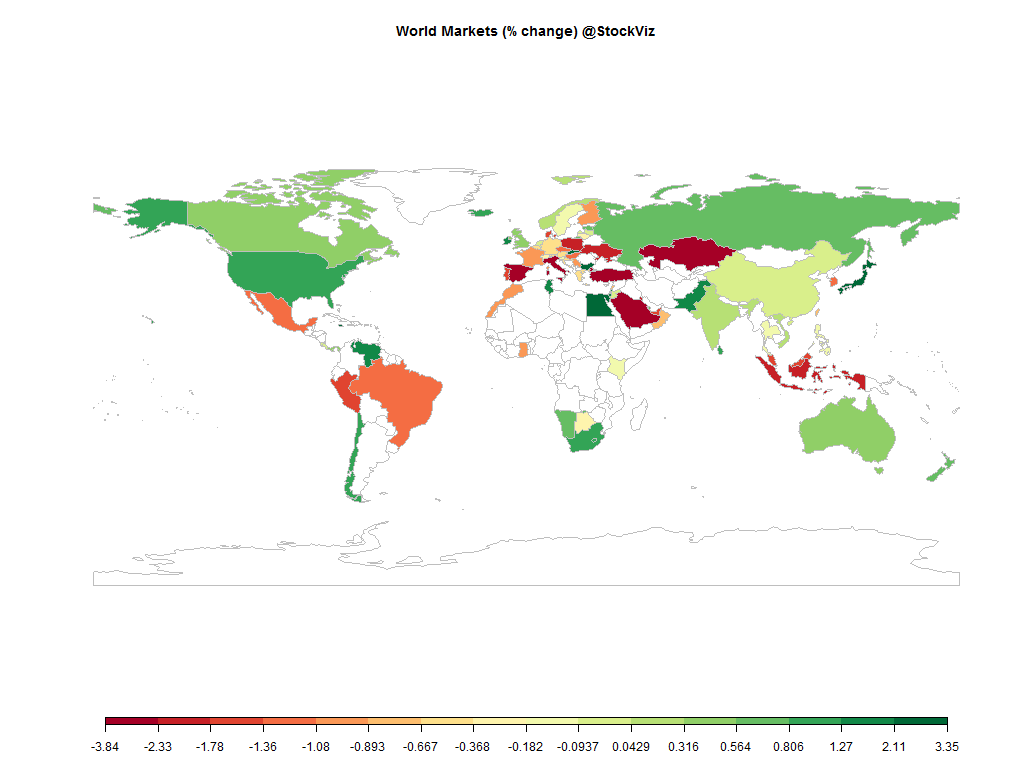
Equities
| MINTs | |
|---|---|
| JCI(IDN) | -2.01% |
| INMEX(MEX) | -1.17% |
| NGSEINDX(NGA) | -11.52% |
| XU030(TUR) | -3.38% |
| BRICS | |
|---|---|
| IBOV(BRA) | -1.09% |
| SHCOMP(CHN) | -0.08% |
| NIFTY(IND) | +0.18% |
| INDEXCF(RUS) | +0.58% |
| TOP40(ZAF) | +0.97% |
Commodities
| Energy | |
|---|---|
| Brent Crude Oil | -2.98% |
| Ethanol | +2.19% |
| Heating Oil | -1.20% |
| Natural Gas | +12.77% |
| RBOB Gasoline | -2.40% |
| WTI Crude Oil | -2.73% |
| Metals | |
|---|---|
| Copper | -0.33% |
| Gold 100oz | -0.03% |
| Palladium | -2.37% |
| Platinum | -1.35% |
| Silver 5000oz | -5.66% |
Currencies
| MINTs | |
|---|---|
| USDIDR(IDN) | +0.77% |
| USDMXN(MEX) | +0.60% |
| USDNGN(NGA) | +0.06% |
| USDTRY(TUR) | +1.77% |
| BRICS | |
|---|---|
| USDBRL(BRA) | +3.46% |
| USDCNY(CHN) | +0.15% |
| USDINR(IND) | +0.44% |
| USDRUB(RUS) | +8.63% |
| USDZAR(ZAF) | +2.38% |
| Agricultural | |
|---|---|
| Cattle | -1.60% |
| Cocoa | +0.78% |
| Coffee (Arabica) | -2.94% |
| Coffee (Robusta) | -1.56% |
| Corn | -2.33% |
| Cotton | +0.61% |
| Feeder Cattle | +1.73% |
| Lean Hogs | +0.70% |
| Lumber | +0.43% |
| Orange Juice | -5.07% |
| Soybean Meal | +1.32% |
| Soybeans | -2.50% |
| Sugar #11 | -2.06% |
| Wheat | -3.20% |
| White Sugar | -1.04% |
Credit Indices
| Index | Change |
|---|---|
| Markit CDX EM | +0.14% |
| Markit CDX NA HY | +0.38% |
| Markit CDX NA IG | -1.85% |
| Markit CDX NA IG HVOL | -0.83% |
| Markit iTraxx Asia ex-Japan IG | -4.08% |
| Markit iTraxx Australia | -2.75% |
| Markit iTraxx Europe | -2.67% |
| Markit iTraxx Europe Crossover | -8.85% |
| Markit iTraxx Japan | -4.21% |
| Markit iTraxx SovX Western Europe | -0.66% |
| Markit LCDX (Loan CDS) | +0.04% |
| Markit MCDX (Municipal CDS) | -2.00% |
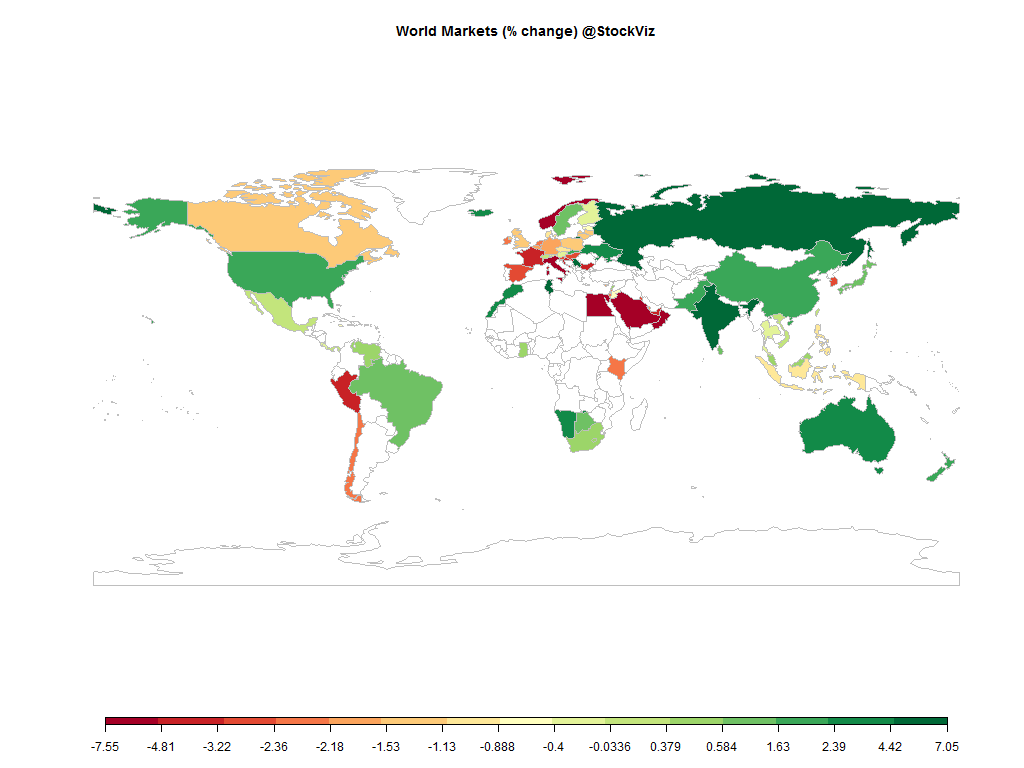
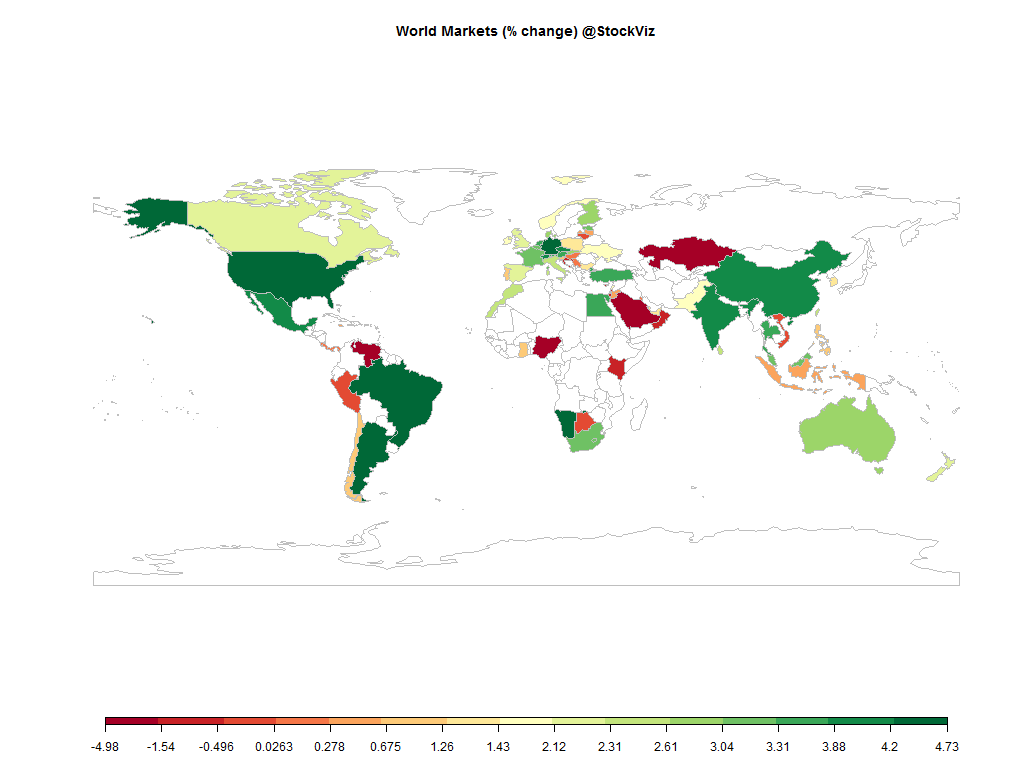
The US Dollar continued to rally with the Ruble and Yen bearing the brunt. Oil continued its slide.
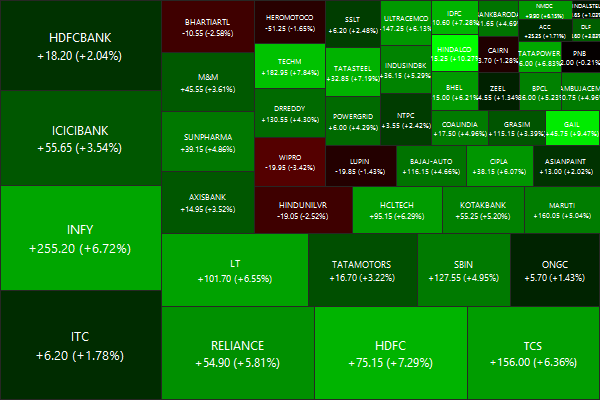
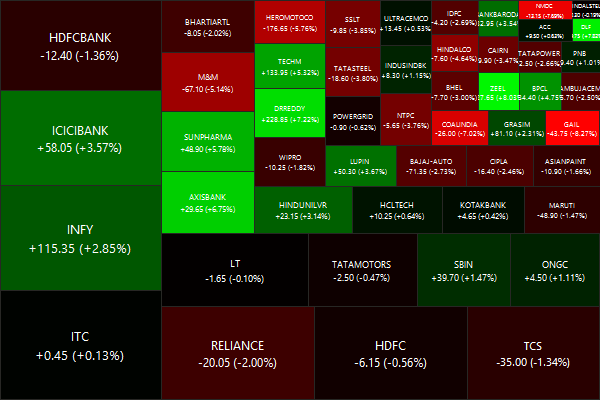
Nifty heatmap
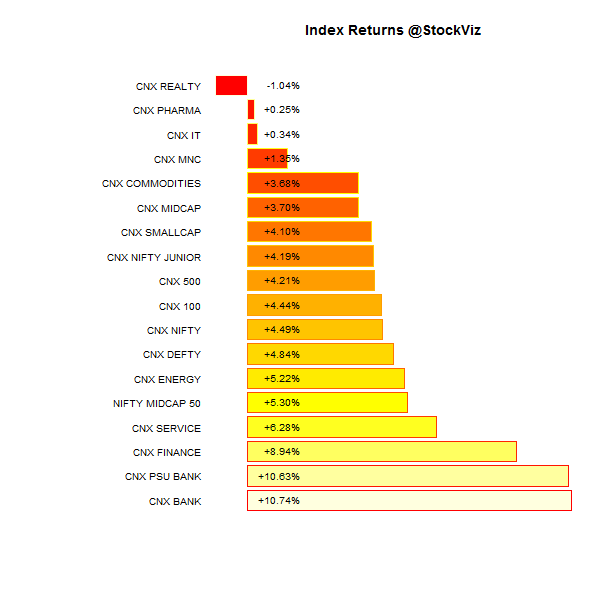
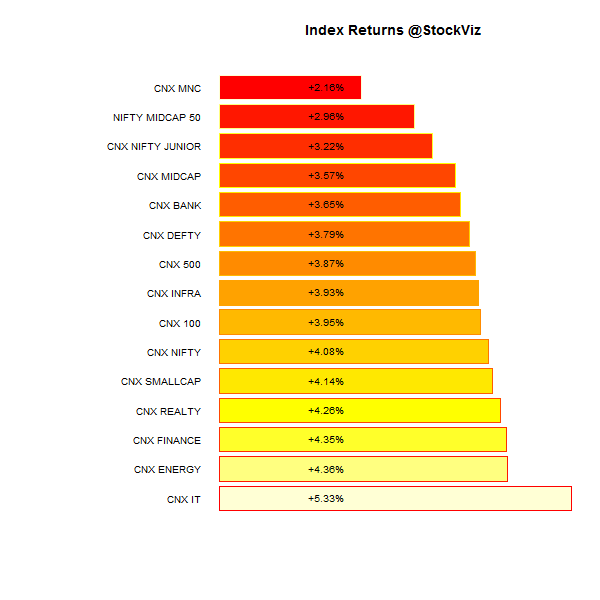
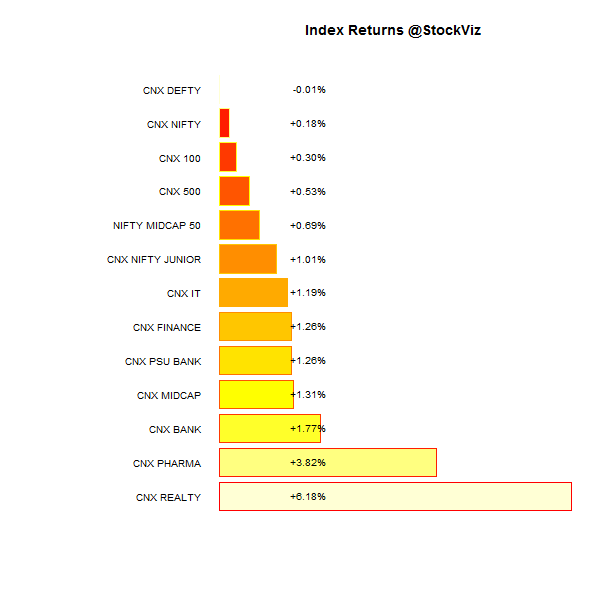
Index Returns
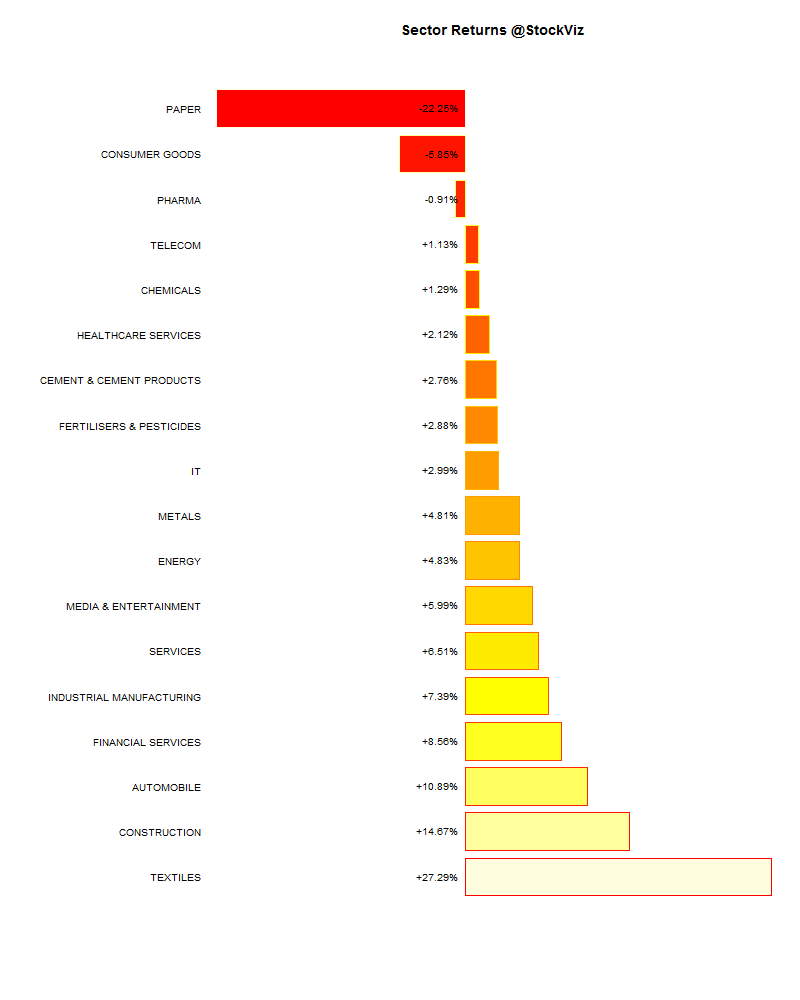
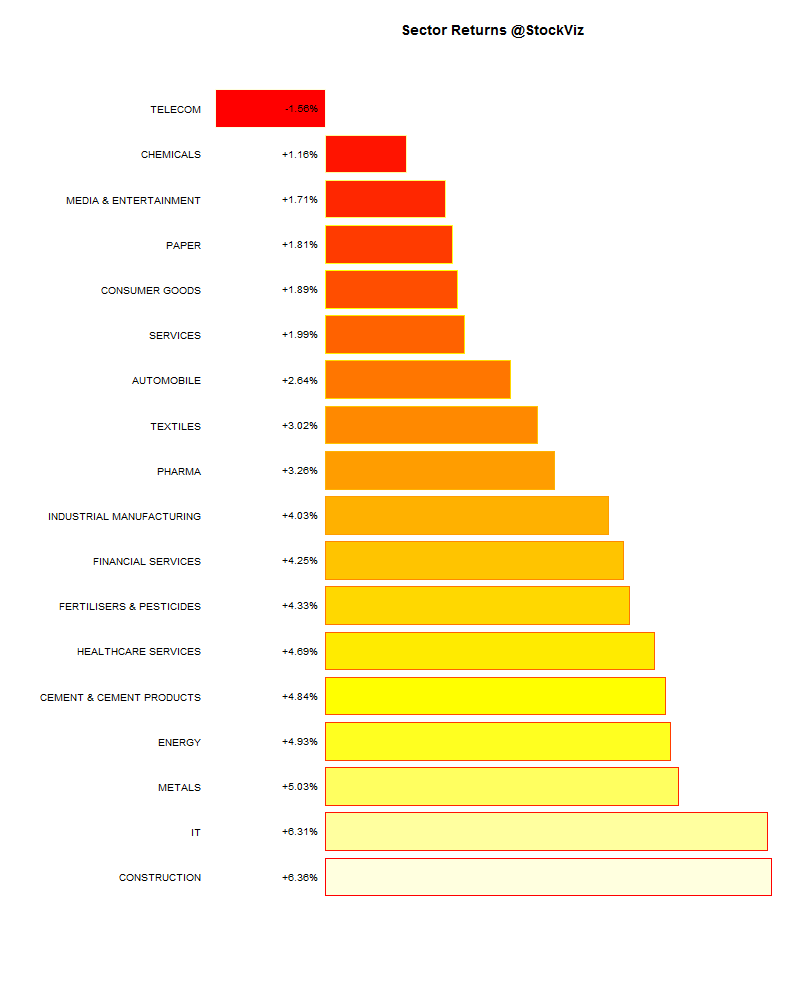
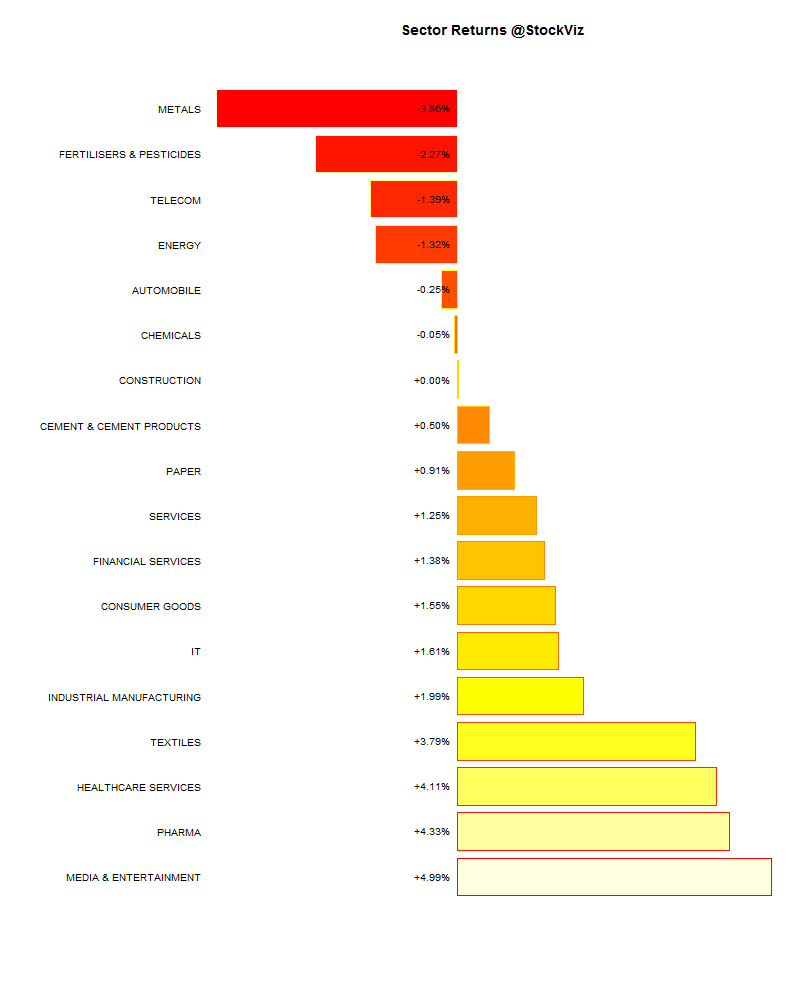
Sector Performance
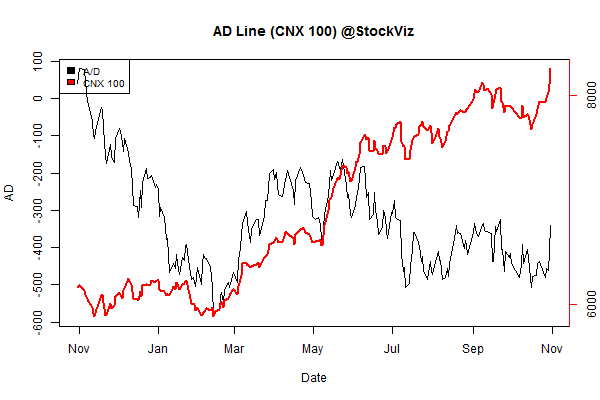
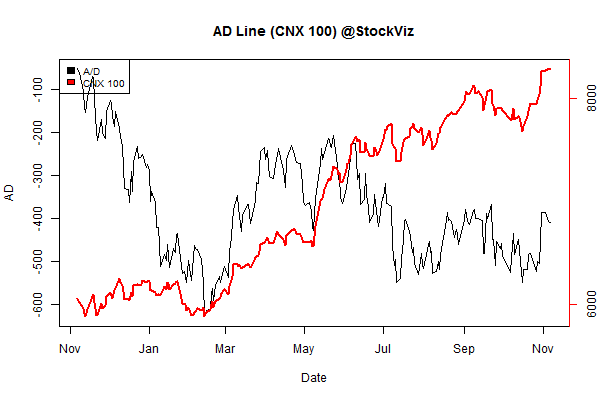
Advance Decline
Market cap decile performance
| Decile | Mkt. Cap. | Adv/Decl |
|---|---|---|
| 1 (micro) | -0.08% | 72/68 |
| 2 | +3.25% | 78/61 |
| 3 | +3.16% | 77/62 |
| 4 | +3.00% | 70/69 |
| 5 | +2.24% | 75/65 |
| 6 | +1.28% | 70/69 |
| 7 | +3.19% | 75/65 |
| 8 | +2.16% | 71/68 |
| 9 | +1.96% | 75/65 |
| 10 (mega) | +0.72% | 70/70 |
Midcaps outperformed the large caps this week…
Top winners and losers
Coal India – soon to be and irrelevant, strike-plagued ex-monopoly.
ETFs
| PSUBNKBEES | +2.83% |
| INFRABEES | +2.70% |
| BANKBEES | +1.30% |
| NIFTYBEES | +0.50% |
| JUNIORBEES | -0.79% |
| GOLDBEES | -1.52% |
| CPSEETF | -2.36% |
Banks continued to outperform the rest of the indices. PSU banks – turning around?
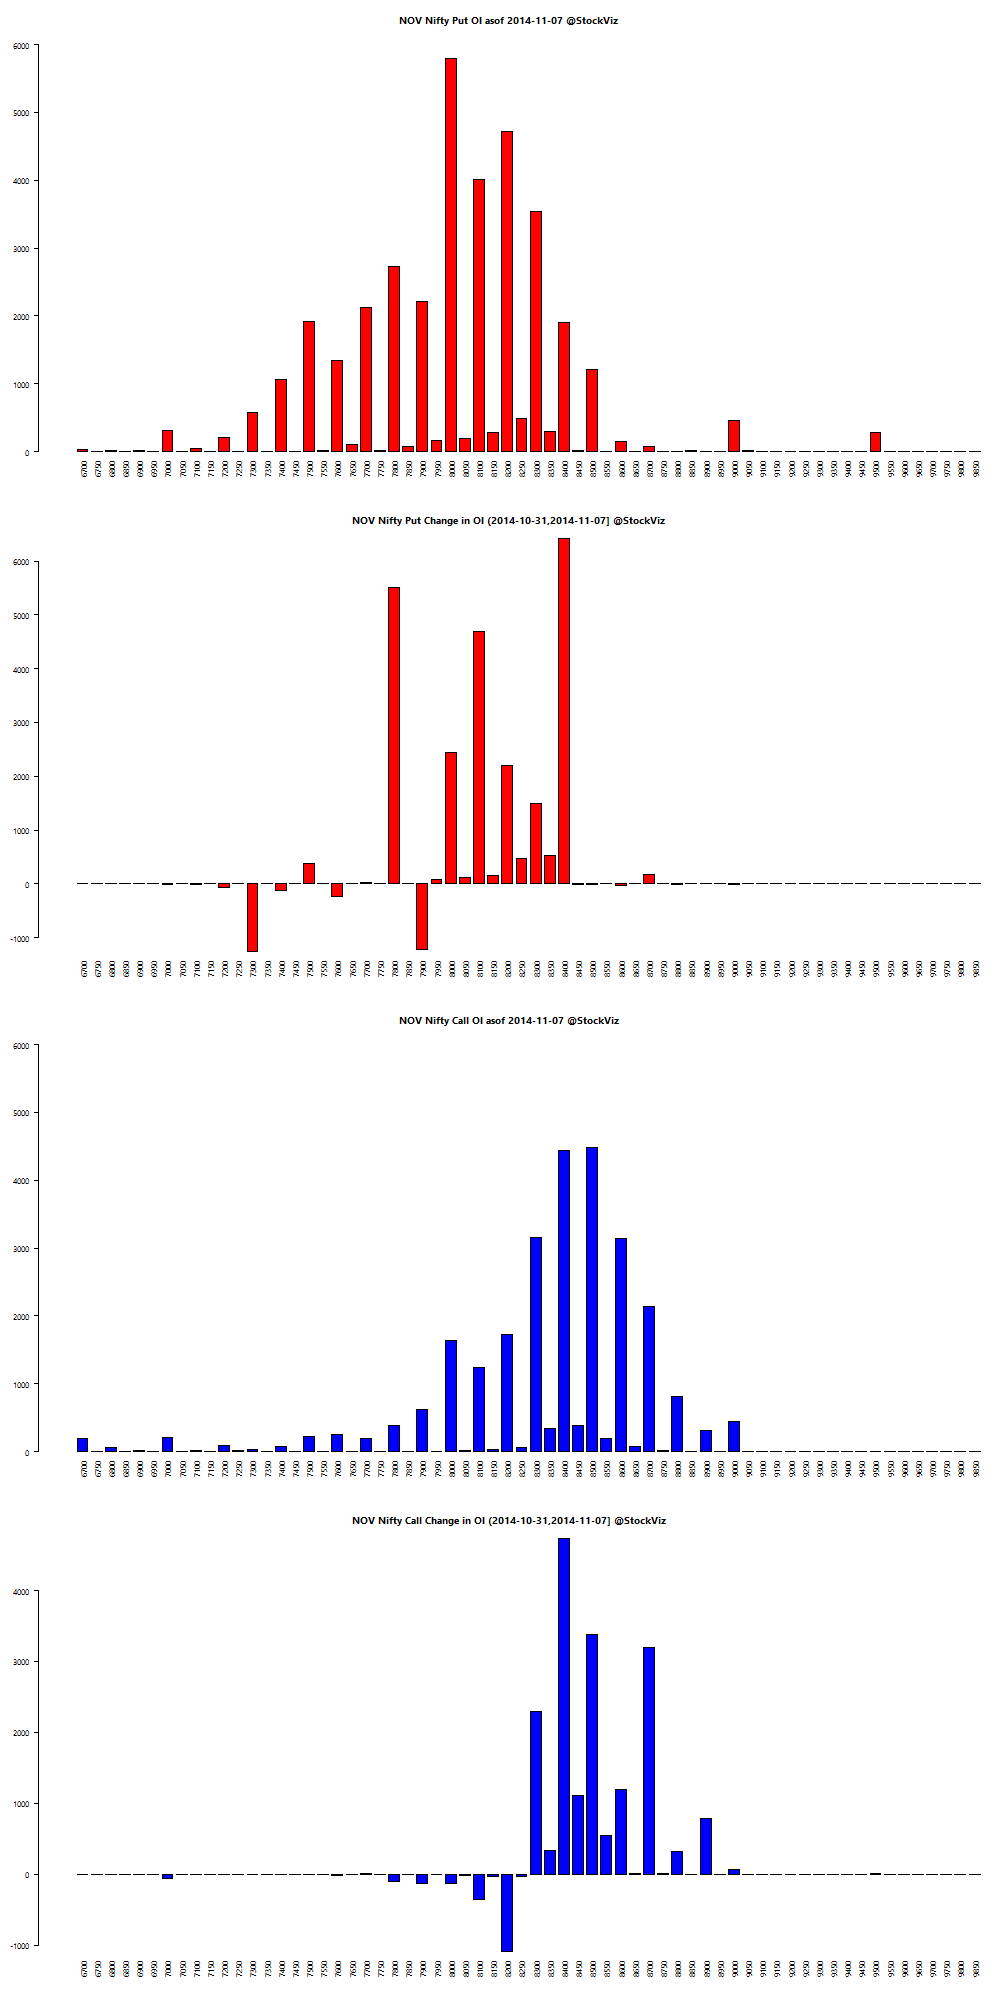
Nifty OI
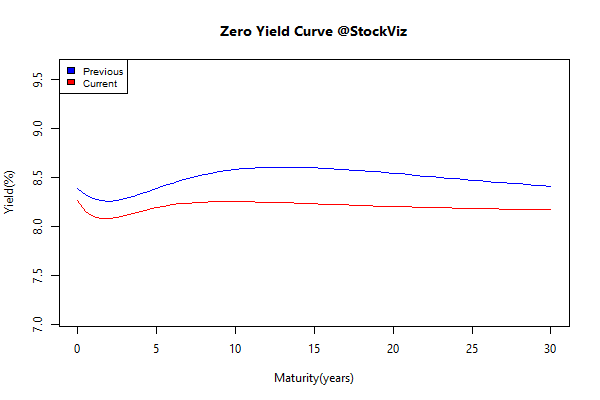
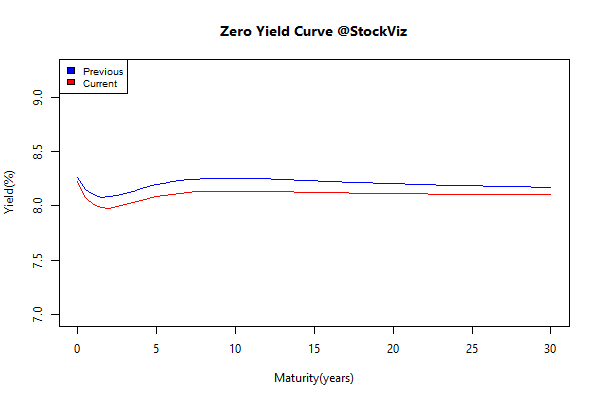
Yield Curve
Bond Indices
| Sub Index | Change in YTM | Total Return(%) |
|---|---|---|
| GSEC TB | -0.39 | +0.27% |
| GSEC SUB 1-3 | -0.21 | +0.68% |
| GSEC SUB 3-8 | -0.18 | +0.78% |
| GSEC SUB 8 | -0.07 | +0.81% |
The entire curve shifted down, and its now flat enough to crack some eggs and make an omelette.
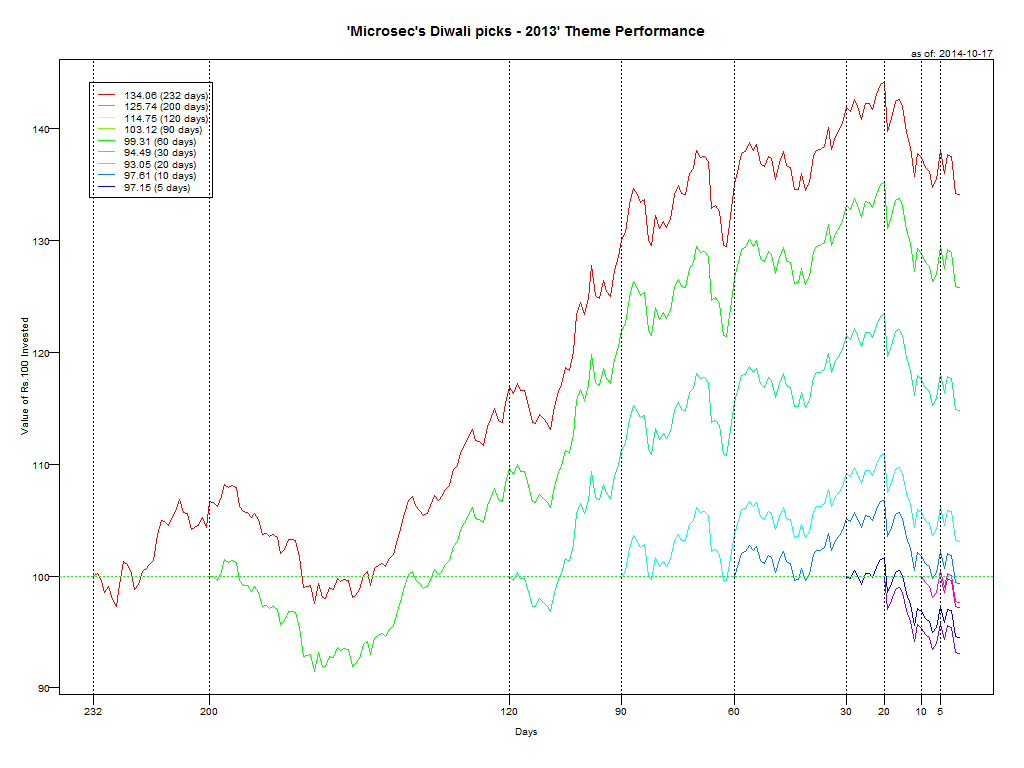
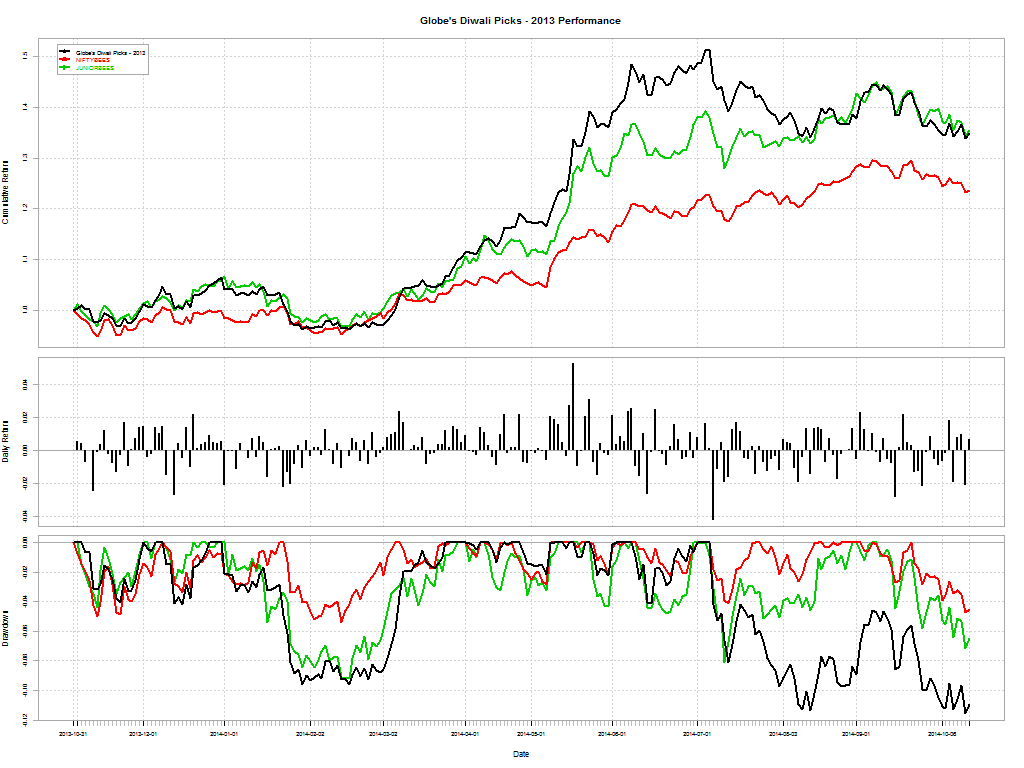
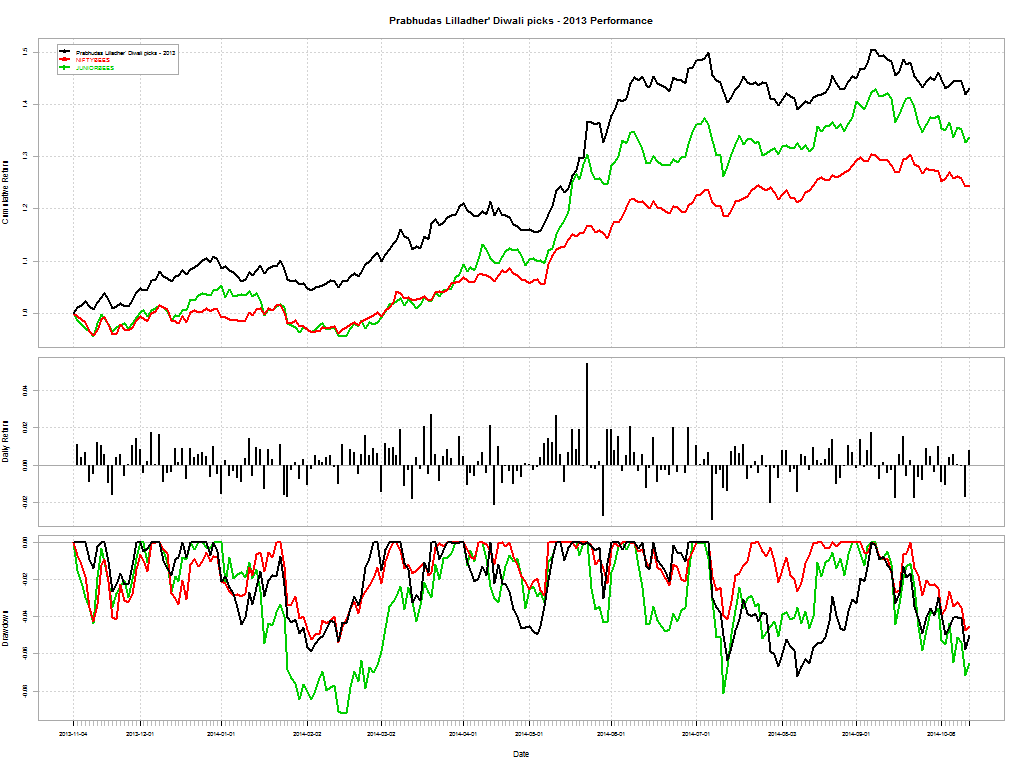
Theme Performance
| Momentum 200 | +7.17% |
| The Other Value | +2.95% |
| Auto | +2.84% |
| Growth with Moat | +2.48% |
| Market Fliers | +1.93% |
| Quality to Price | +1.70% |
| IT 3rd Benchers | +1.65% |
| Piotroski ROC Small Caps | +1.12% |
| Refract: PPFAS Long Term Value Fund | +1.02% |
| Market Elephants | +0.92% |
| Efficient Growth | +0.70% |
| Magic Formula Investing | +0.32% |
| Balance-sheet Strength | +0.19% |
| Industrial Value | +0.15% |
| Momentum Long-Short | +0.00% |
| Old Economy Value | -0.03% |
| CNX 100 50-Day Tactical | -0.15% |
| Financial Strength Value | -0.32% |
| ADAG Mania | -0.83% |
| Enterprise Yield | -1.37% |
Momentum continued its winning streak. Value flat-lined.
Thought for the weekend
When you’re in freedom to win mode, you’re constantly focused on improving your position, capabilities and odds of winning. You are always evaluating strategies, and making up clever lines of attack or defense. The activity that glues the rest of your activities together is keeping score.
In poker, due to the inherently probabilistic nature of the game, technically perfect game-play can still lead to a loss, so players of those finite games make sure they keep two kinds of score: actual wins/losses, and a separate score that measures whether or not they played correctly, whatever the outcome.
This separation of technical score-keeping and outcome score-keeping leads to a more dangerous place: score-keeping becoming sufficient to sustain finite-game mindsets even when the game is ambiguous or unclear, and there is no agreement among players about what the goal is.
Money is the classic example of a mechanism for keeping score that is divorced from outcomes.
Read the whole thing here: Don’t Surround Yourself With Smarter People