Author: Abhishek

Calculating Returns The Correct Way

You often hear this whenever someone is trying to sell you something: “Don’t worry, this investment will double in 5 years” or “You will not lose money on this.” But how can you tell if it’s the right investment for you? When you look at any investment, be it real estate, gold or stocks, you need to consider two things: risk and reward.

So lets dissect the first statement: what does doubling in 5 years really mean? Your cashflow looks something like this:

imageSpend 100 now, get 200 back 5 years from now. If you run this through the XIRR function on Excel, it shows that your reward is a 19% Internal Rate of Return. Sound good? Would you take this rate of return on gold? Yes. How about teak plantations? Perpetual motion machine?

Here’s where risk plays a part in helping you gauge whether something is a good investment or not. Gold, at a 19% IRR is way better than land at the same IRR. Land at 19% is better than teak plantations at the same rate and so on. The way you figure out if you are being compensated for the risk you are taking is by comparing it with the risk-free rate for the same time period. For example, if you keep the same money in a bank fixed deposit, you’ll earn about 9% for 5 years. So the additional risk that you are taking to get to the 19% return is worth 10%.

Negative returns are those that grow less than the base rate. Getting 5% when the risk-free rate is 9% is losing money. If a stock goes up by 10% while the NIFTY 50 goes up the 12%, that’s a bad stock pick. You always need to compare the returns you get to a risk-free or passive investment in order to figure out if it makes sense. In order to compare investments across different areas, people smarter than me have come up with a variety of metrics (each of which are flawed in its own unique way) and the concept of “risk adjusted returns” which I will attempt to explain in layman terms in the future.

Tomorrow’s post will discuss the effect of inflation and transaction costs on real returns. If you have any questions, please email me: abhi@stockviz.biz

India and China: Gold repertoire

This is the last of three posts by Abhishek Preetam on why he is bullish on the yellow metal. Please welcome him to StockViz and follow him on twitter @AbhiPreetam

The Q2 2011 gold demand trends report from World Gold Council reported a year-on-year volume growth in the total consumer demand of 38% in India and 25% in China, compared to a global growth rate of 7%.

According to the WGC report – India: Heart of gold: Revival and China gold report: Gold in the year of Tiger, China had a total demand of about 200 tonnes of gold in 2000 to around about 450 tonnes in 2009. For India the figures would be 300 tonnes and around 950 tonnes for the respective years. These two economies have always kept the demand primed, even as others were keeping gold at a distance.

clip_image002

clip_image004

Some of the drivers behind the increasing demand for gold appear to be:

  1. Cultural / Traditional values: Mode of gifts at various occasions and auspicious value related to gold on occasions like marriages (10% – 15% of total marriage expense) and festivals.
  2. Increase in the disposable income of the population.
  3. Economic growth

Other Asian economies like Vietnam, South Korea, Indonesia and Thailand as well are following on the footsteps of neighboring China. The fact that gold has both cultural and economic importance in these countries is the source of their demand. Also the fact that those with not that much spending potential are moving towards a lower carat gold product is again boosting the gold demand quantitatively.


Untapped potential

In the webcast – “case for investing in gold” Jason Toussaint of World Gold Council highlighted an interesting fact: Of the roughly 800 tons of gold imported to India each year, only the top 40 percent of Indian households purchase all of the country’s gold, says Toussaint. The other 60 percent of Indians, who may have the same adoration for gold and celebrate Ramadan and Diwali, historically may not have had access to purchase gold. This large population represents a huge untapped market. To fulfill demand, the WGC has created a program with Indian post offices to distribute coins and small pieces of gold. Toussaint says right now there are 700 post offices in the rural areas servicing 90,000 customers and he expects that number to grow. If purchase patterns continue, they expect from 2005 to 2025, a four times larger gold market in India.

Hence restating from the first blog, looking at the current gold price range of 1600 – 1800 $ per ounce, it can be said that it’s a good buying opportunity for the investors. With continuous demand from all across the world economies, both economic and individual interests, it is very likely that there is not going to be a sudden and a drastic decrease in the gold prices. Also the faith of economists all across the world, that this is no where close to the real estate bubble or the IT bubble of the last decade affirms that whether now or in the near future, it would be an intelligent decision to keep some eggs of gold in your investment basket.


Competitive Devaluation and a case for Gold

This is the second of three posts by Abhishek Preetam on why he is bullish on the yellow metal. Please welcome him to StockViz and follow him on twitter @AbhiPreetam

Throughout history, countries with high debt-to-GDP ratios are seen to have trouble getting back to their pre-crisis growth story. They can’t grow enough to repay their debts, and have little choice but to default.

A sovereign default usually comes in one of the following three forms:

  1. The country willfully does not repay, force its debtors to take a haircut to reduce its debt burden, readjust its policies and starts growing again (Russia, Argentina).
  2. The country starts printing more money and repays its debtors in worthless new currency (Brazil in the late 1980’s and early 1990’s)
  3. The country devalues its currency (Iceland) and goes through the trouble of cutting expenses, high unemployment levels, and decreased GDP growth in the short run and comes up well at last.

In all the these scenarios, countries will have high inflation for a brief time (brought on by increased money supply). During this period of hyperinflation, whoever is left holding the country’s debt (or its currency), gets wiped out. But, once the readjusted economy gets back on its foot, sound fiscal and monetary policies puts economic growth back on track.

Countries

Percent of GDP

Amt in (T = Trillion$, B = Billion$)

GDP (T = Trillion$, B = Billion$)

Per capita (in $)

Ireland

1382%

2.38 T

172.3 B

566756

UK

413.3%

8.981 T

2.173 T

146953

Switzerland

401.9%

1.304 T

324.5 B

171528

Netherlands

376.3%

2.55 T

676.9 B

152380

Belgium

335.9%

1.324 T

394.3 B

127197

Denmark

310%

626.1 B

201.7 B

113826

Sweden

282.2%

1.001 T

354.7 B

110479

Finland

271.5%

505.06 B

186 B

96197

Austria

261%

867.14 B

332 B

105616

Norway

251%

640.7 B

255.3 B

137476

HongKong

250.4%

815.65 B

325.8 B

115612

France

250%

5.37 T

2.15 T

83781

Portugal

223.6%

552.23 B

247 B

51572

Germany

185.1%

5.44 T

2.94 T

51572

Greece

182.2%

579.7 B

318.1 B

53984

Spain

179.4%

2.46 T

1.37 T

60614

Italy

146.6%

2.602 T

1.77 T

44760

Australia

138.9%

1.23 T

882.4 B

57641

Hungary

120.1%

225.54 B

187.6 B

22739

USA

101.1%

14.825 T

14.66 T

48258

During the period of readjustment, there is usually a rush into hard assets (gold and commodities in general) whose value cannot be touched by the devaluation/default. Let’s look at the present debt to GDP ratio of various world economies.

We all are aware of Greece’s condition and its upcoming obligation to start making payments on its earlier debts. According to the updates from the Greek government this October, they were not in line with the necessary economic reforms and are also predicted to be stuck in the same rut of economic stagnation in the coming months.

Currency devaluation could have been a way out for Greece. However, it is not feasible for EU economies (thanks to the Euro), and big economies like US. The Euro cannot be devalued because of the diverse set of countries involved, and the impact it will have on the other well off countries (Germany, for example). If Greece, decides to devalue their currency alone, they will have to move out of the union, which will have serious impact on its trade and economic relation with other countries.

The US could get rid of its high debt load by printing more money. This will help it get rid of its debt in the short run, but the dollar will lose its value compared to other world currencies. This also would mean that no other country will buy US bonds and hence won’t lend to US in the future. In short, the USD will lose its reserve currency status and result in a permanent global shift in power.

Looking at the present conditions and hoping that the current turmoil will be over soon seems too optimistic. We seem to be headed down a path that involves Greek default, maybe the abandonment of the Euro and more money-printing in the US.

Some strategists believe that market forgets these issues pretty fast. Just like when Brazil, that had lot of debt during the late 80’s and early 90’s, hyper inflated its way to a 7% Debt-to-GDP ratio. Investors quickly put the past behind and made Brazil one of the shining stars of world’s emerging economies. This story can happen in the case of US as well.

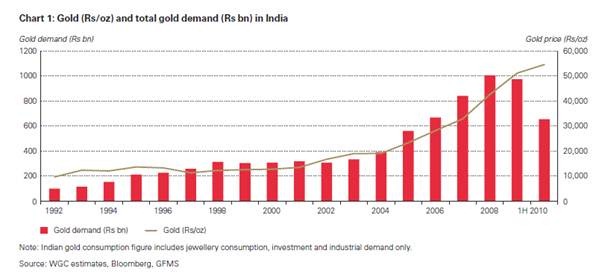
No matter what the outcome, during periods of uncertainty and hyperinflation, investors will look toward Gold as a haven and a preserve of wealth. This looks to me like a pretty good factor driving demand and yet another reason for gold prices to surge. Investors the world over increased their allocation to the yellow metal starting in 2008, and the current lull in the market after the Aug 31st correction in prices may provide investors with enough reason to start buying again.
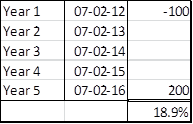
Why Gold?

This is the first of three posts by Abhishek Preetam on why he is bullish on the yellow metal. Please welcome him to StockViz and enjoy the post!

Gold has been in news for quite some time. With prices touching their highest values recently, the yellow metal is becoming red hot day by day. What is causing this sudden spur in the price?

Let’s look at the trend of gold prices (In USD and Euro) for the last 3 decades:

clip_image002

Prices were initially range bound nearly for two decades. Starting from 2001, prices have risen almost non-stop and have been on an absolute tear since 2003, rising over 325% and 150% since 2007. Following the trend, Gold just reached an all time high of $1813.5 an ounce on August this year. Let’s look for the reasons of this trend.

Supply side

Historically gold and silver were used as currencies and it was not until a few centuries ago that fiat currencies came into existence. The value of gold and silver did not lose their actual values, but instead were looked as commodities (a barter resource) and not actual money. Almost all currencies around the world are now fiat currencies.

Gold and silver are non-renewable resources, and with their production decreasing, the supply side of market looks shallow. Looking at the long term production level of gold, we can see the dipping production levels from 2000 till 2007. clip_image004

Mining on an average contributes 63% of gold production; the rest comes from recycling of gold. Recycling takes place majorly in South East Asian countries. In the Q2 2011, 429.3 tons of gold was recycled. This is 3% down Y-O-Y and slightly above for the trailing 10 months average of 407.3 tones.

Global demand report from WCG for Q2 2011 states “Over the ten years that preceded the 1997/98 Asian financial crisis, net new jewelry and investment demand amounted to more than double the tonnage accumulated during the ten years to the end of 2010. This suggests a considerably lower stock of gold to supply the market through recycling.”

As per the data from World gold council, supply of gold for the year 2010 increased by 1.81% whereas the demand shot up by 10% compared with 2009. For Q1 11, supply decreased by 4% whereas demand increased by 10% compared to year ago period.

Demand Side:

clip_image006

Gold is used for 3 main purposes – Jewelry, Technology (Electronics and Dentistry) and Investments. Pre 2008, Jewelry formed 69% and % investments formed 11.5% of the total demand, but after that they form 53% and 25% respectively.

For the last 2 year central banks have turned into the net buyers of gold. Even European countries have started buying up gold for their reserves. The central banks currently stand as the largest holder of gold at 16.5% of all the gold produced.

Finally, applying simple economics lesson of supply and demand on gold, the future looks promising. With almost stagnating supply (mining and recycling) and continuous rise in the investment related interest of central banks and also various end users, there will be a huge gap to fill. There might be some correction in the short run, but long term outlook of the asset seems bright.

So, whether paper or real, they should form some part of your portfolio.