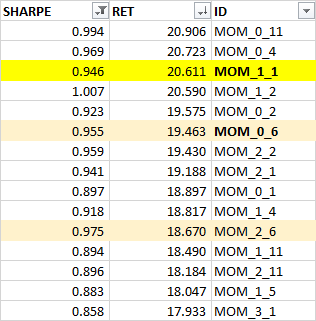
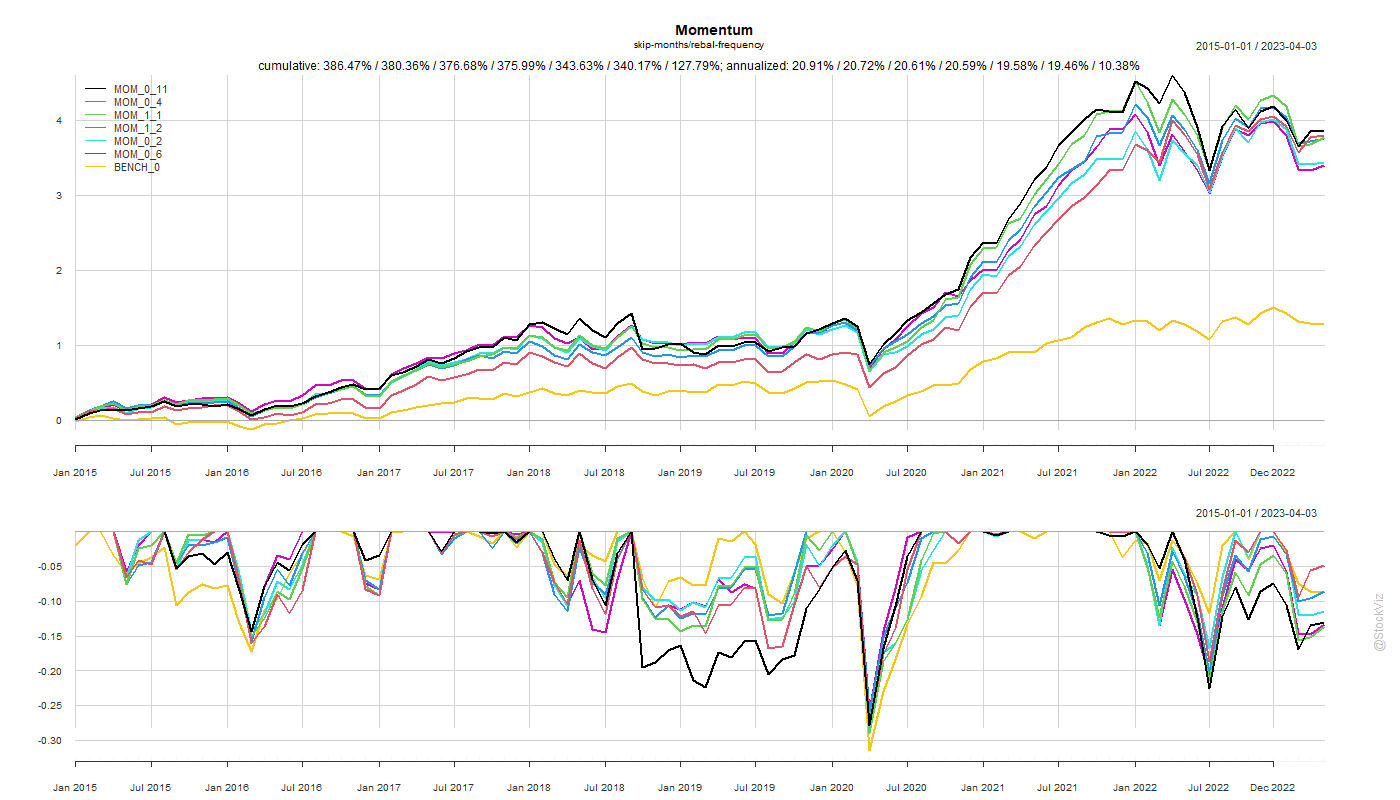
Previously, we found that the traditional 12_1 momentum configuration, where you look at the previous 12-month performance while skipping the most recent month and rebalancing every month, was indeed an ideal config (MOM_1_1). However, there are momentum index funds that rebalance once in 6-months (MOM_[0,1]_6). Is there any performance give-up if you rebalance infrequently?
Turns out that the traditional config is quantifiably better than others. However, there’s isn’t much of a performance give-up even if you rebalance once in 6-months (MOM_0_6).
Besides, the analysis here doesn’t factor in transaction costs which would be a bigger drag on the monthly rebalance config. When you add the tax-advantage and low-cost of index funds into the mix, the current crop of momentum index funds don’t look all that shabby.
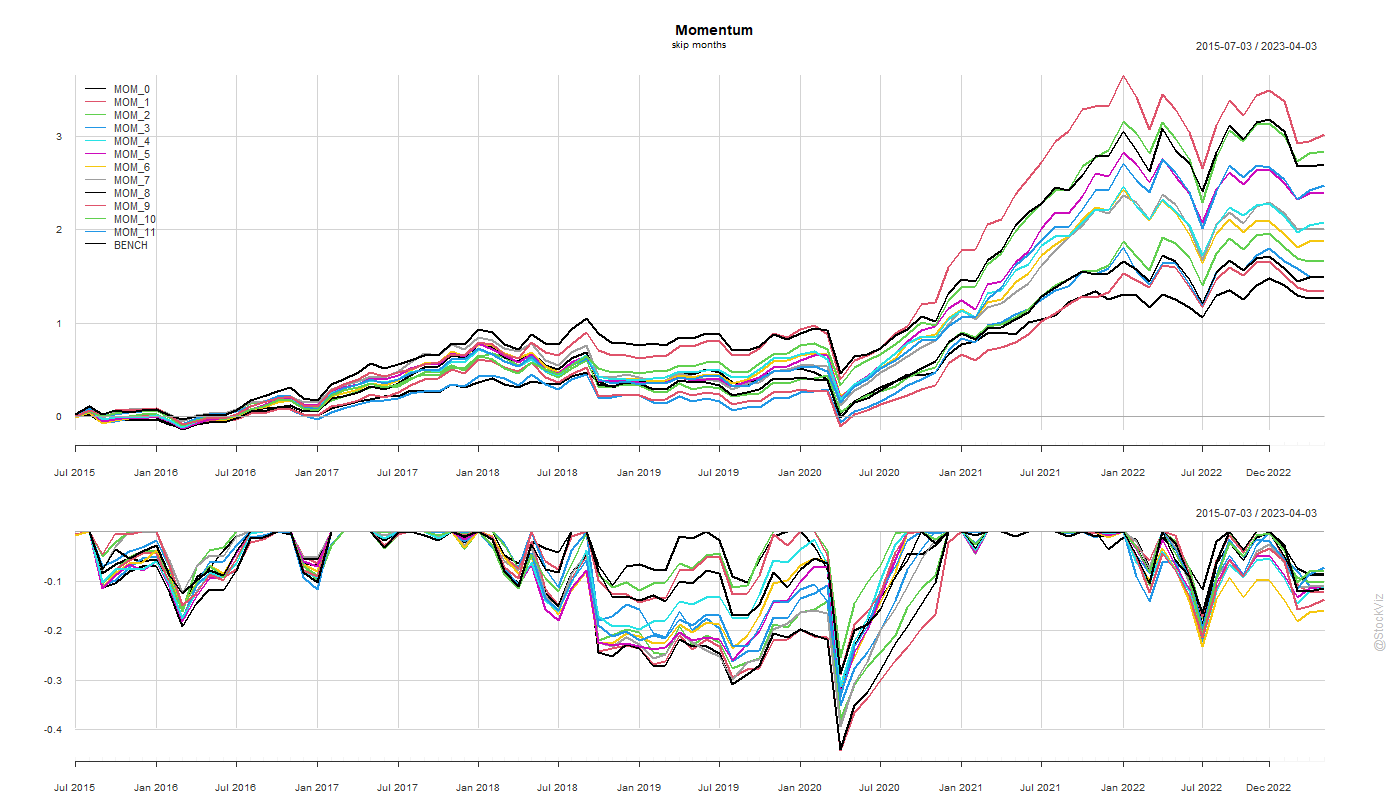
The original Jegadeesh and Titman momentum paper (pdf) used a “skip month” to manage the reversal effect (quant.stackexchange). However, why is it one month and not two, or three or four?
Here’s what the equity curves of different skip month configs look like.
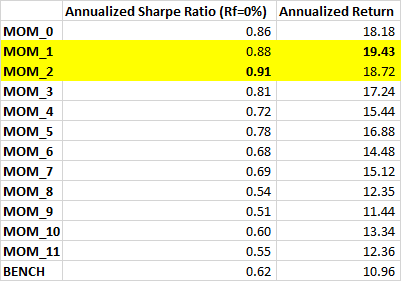
The “skip one month” is indeed a magical config. Also, if you are optimizing for Sharpe, skip two.
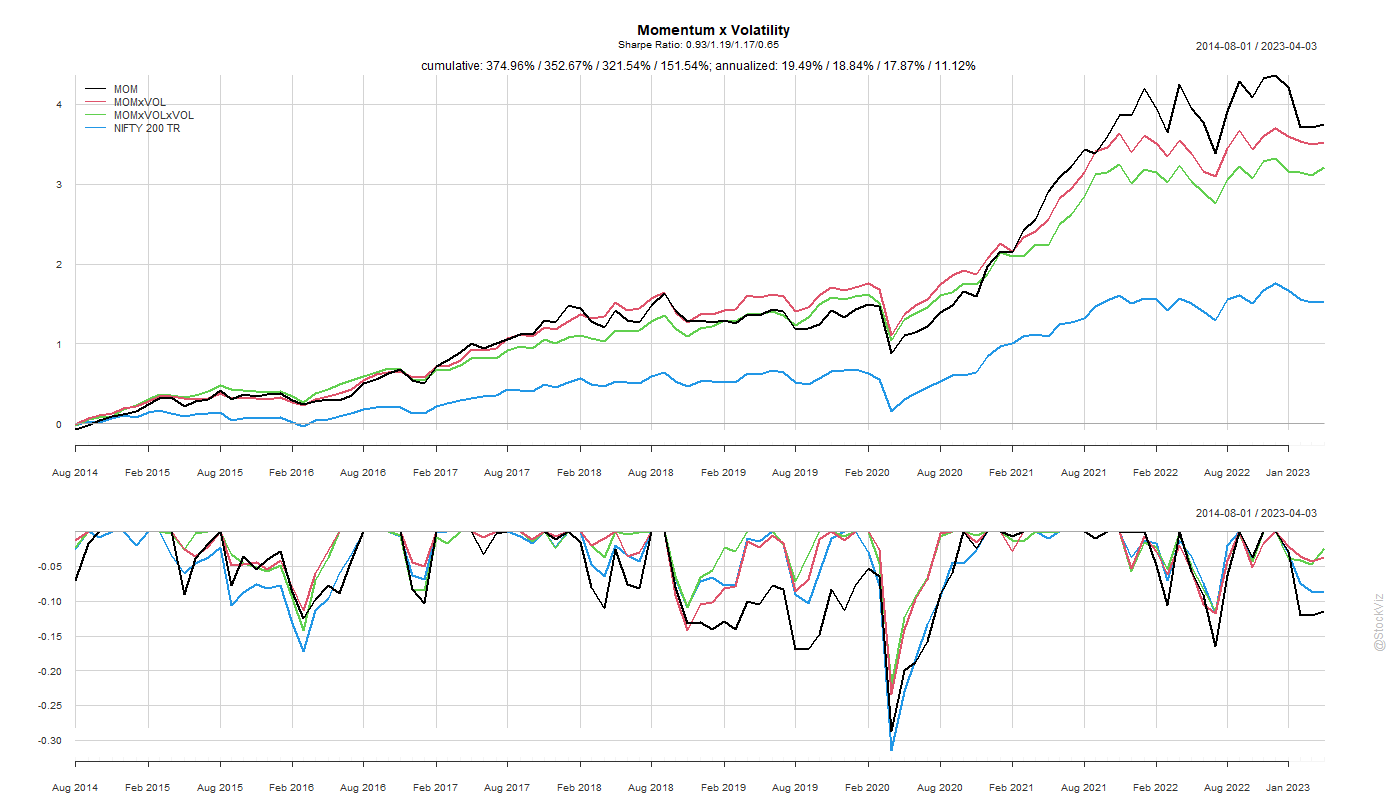
Momentum has proved to be the premier anomaly in different markets. And so has low-volatility. What happens if you combine both of them? Also, what if you also add low volatility of volatility into the mix?
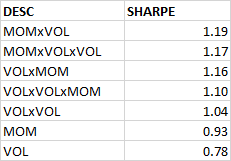
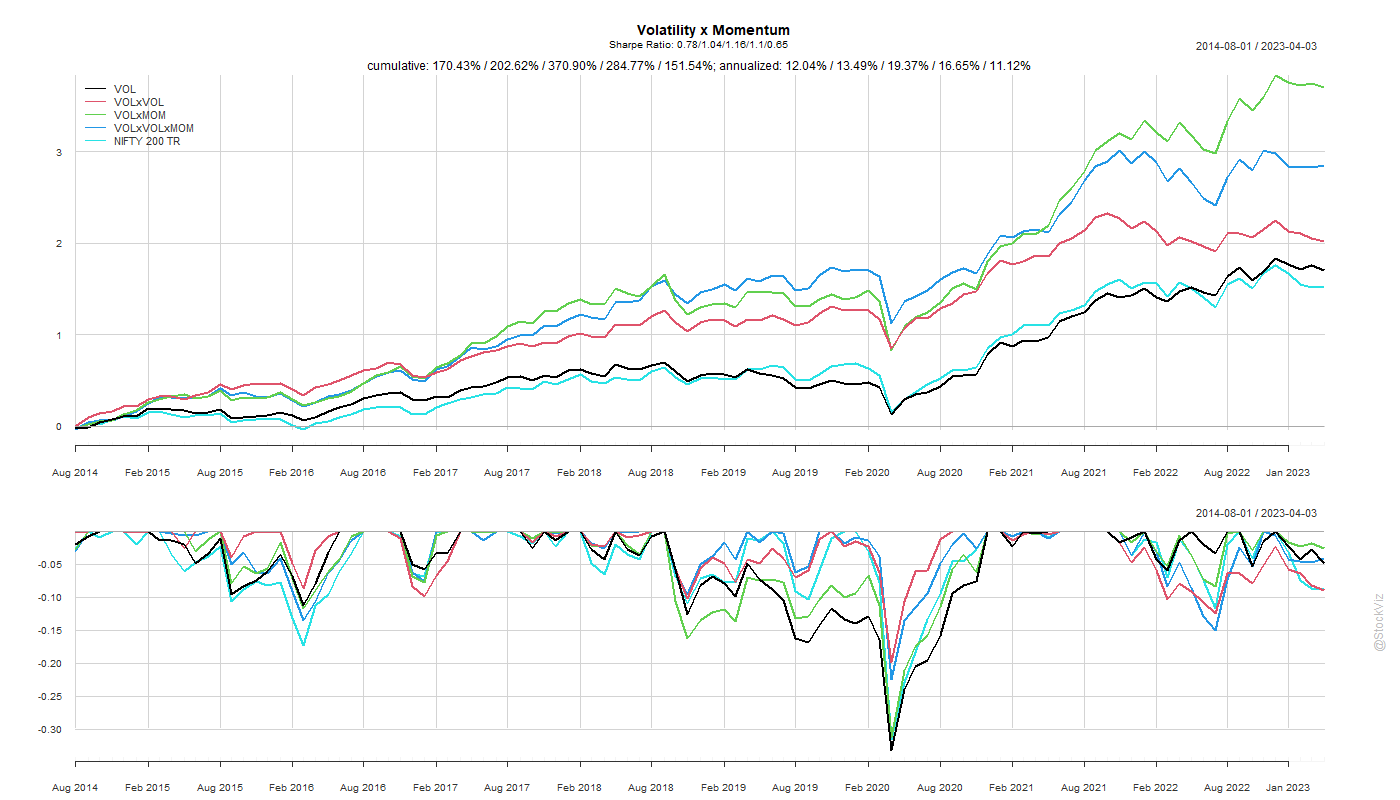
There are a couple of ways to skin this cat. You can start with low-volatility and add momentum. Or, you could go the other way – start with momentum and then add a volatility sort.
tl;dr: go with low-volatility first, momentum second (VOLxMOM).
While a simple momentum sort gives the highest return, adding a low-volatility filter to it gets you a better risk-adjusted return.
The order of the sort – first volatility and then momentum or first momentum and then volatility – doesn’t seem to matter much for the Sharpe rankings but the former ended up with slightly better returns.
Investors love the returns of momentum strategies but hate its crashes. And there have been numerous attempts at making momentum investing smoother. After all, where there is demand, supply will be created. But, what if, momentum and crashes are two sides of the same coin? Is Momentum without crashes even possible? What if Volatility is Nature, not Nurture?
Last year, we had a look at the The High-To-Price (HTP) Momentum Strategy (backtest, live model). It lived up to its promise of low-drawdowns by staying in cash during the most recent market downturn. However, if it ends up being slow to react to market recoveries, then it will underperform at the beginnings of new bull-markets. It is yet to go through a full cycle (bull-bear-bull) for us to be 100% confident about it.
More recently, we back-tested trend overlays on momentum strategies (Part I, II, III). It is still early days.
Broadly, the biggest problem with the momentum strategies is that they are path agnostic – they all look only at asset returns. The raw signal treats a stock making a parabolic move and a stock making a gradual climb the same. The filters come in later. What if there was a way to incorporate the path as well?
We took a shot at this problem with our Dynamic Linear Model strategy that simply regressed prices to a 45* line and ranked them based on goodness of fit. The performance has been good but not great.
So, it was with great expectations that we teared through Momentum Without Crashes (SSRN). The authors take a fractional differencing approach to overcome the loss of path information. The fractionally differenced log price series is i.i.d. so the next period prediction of the differenced series is simply the mean of the series. This “predicted value” is then inverted to arrive at a prediction for the next-period log return. These predicted log returns are ranked and a portfolio is constructed. The differencing parameter d is computed empirically. Intuitively, d=1 will result in a traditional momentum portfolio and d=0 yields a reversal portfolio. The authors find that d=0.9 is optimal.
Back-test
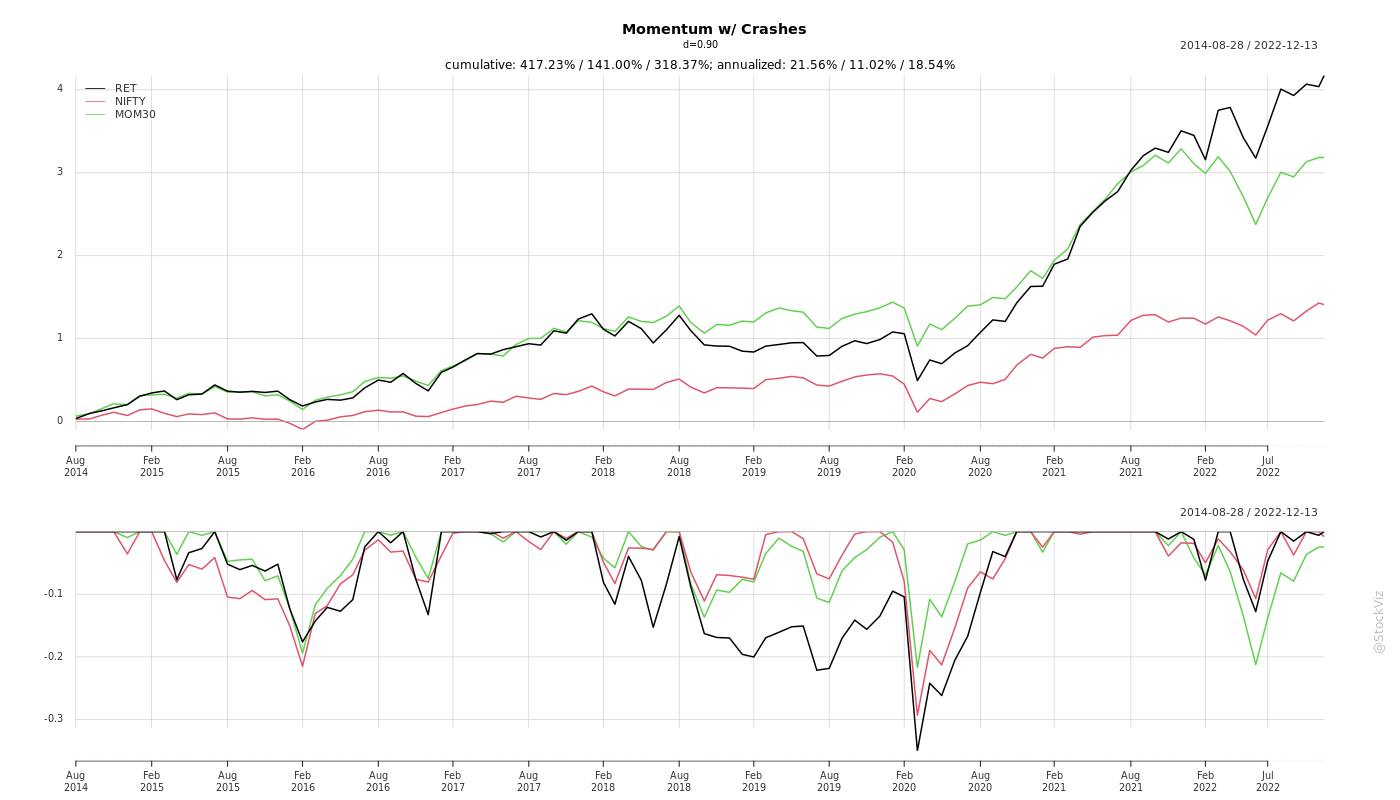
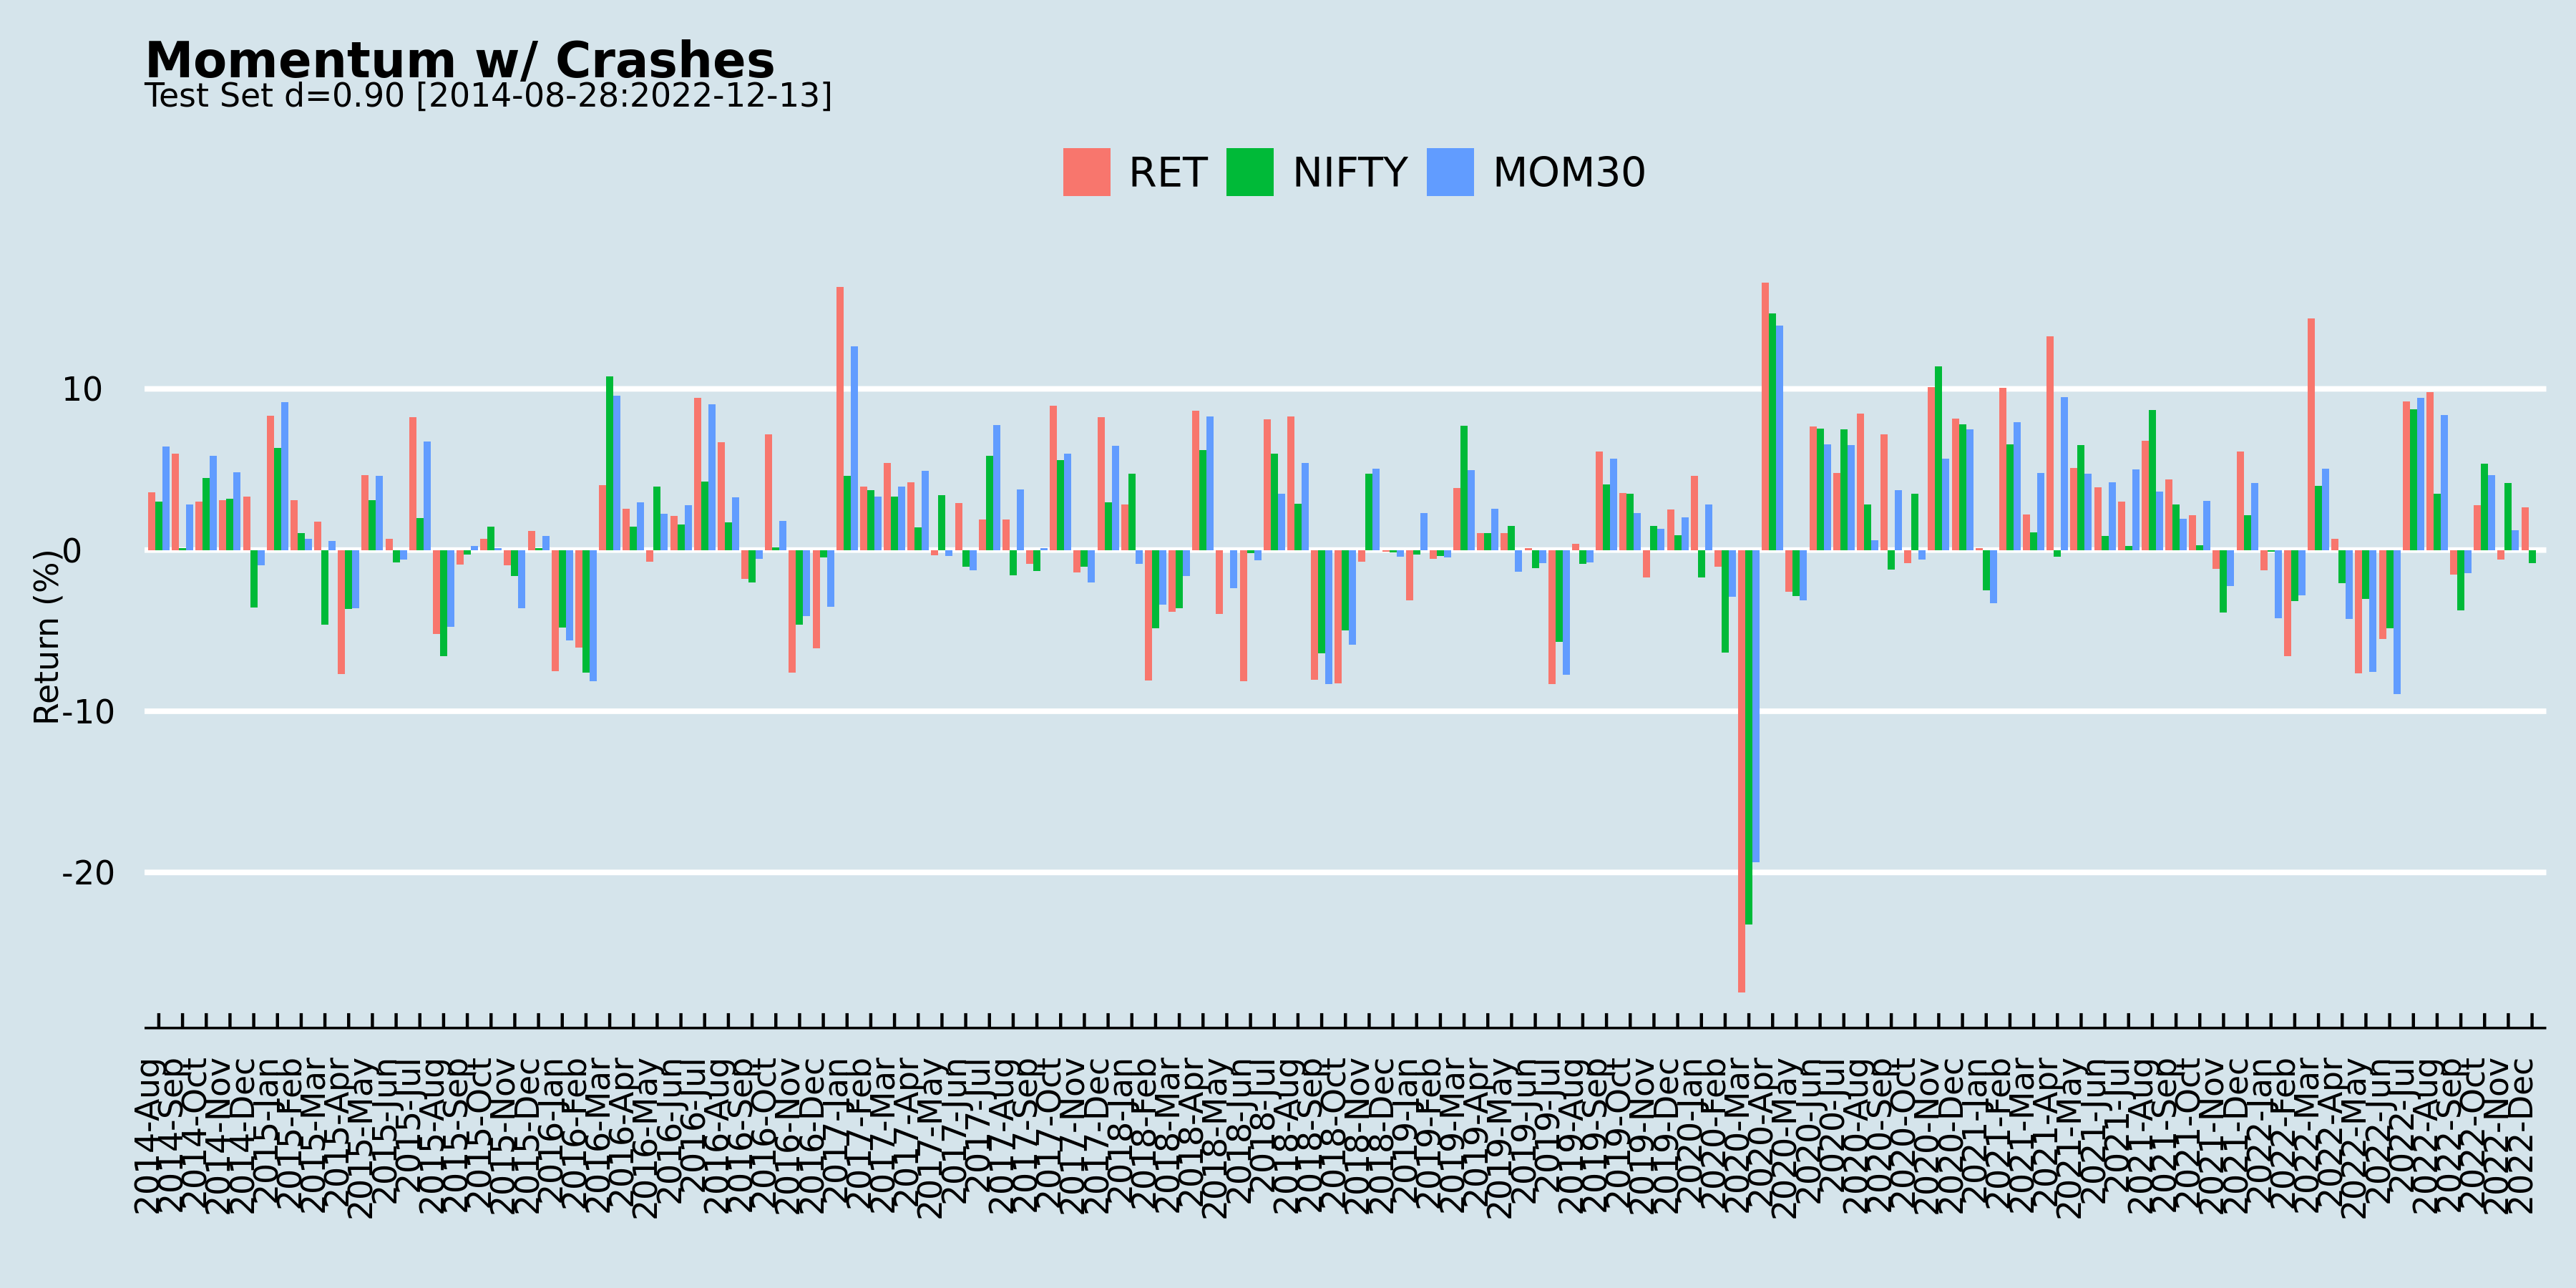
We did a full-sample back-test on monthly returns for the top 200 stocks by free-float market-cap between 2014 and now for d=0.9.
The Fractional Momentum strategy, as the authors call it, out-performs the NIFTY 50 index and the NIFTY 200 Momentum 30 index. However, it does have its periods of under-performance and it doesn’t quite live up its promise of avoiding crashes.
The approach is pretty interesting and they have tested it across multiple markets so we created monthly-rebalanced and momo versions of this strategy to see how it tracks in the real world.
You can find the charts for d in [0, 1] on github.
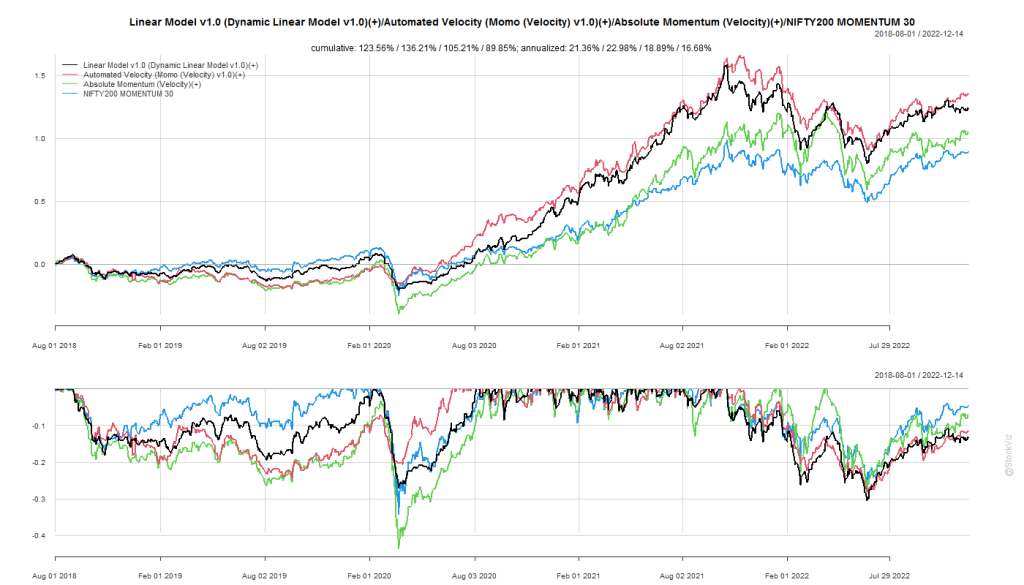
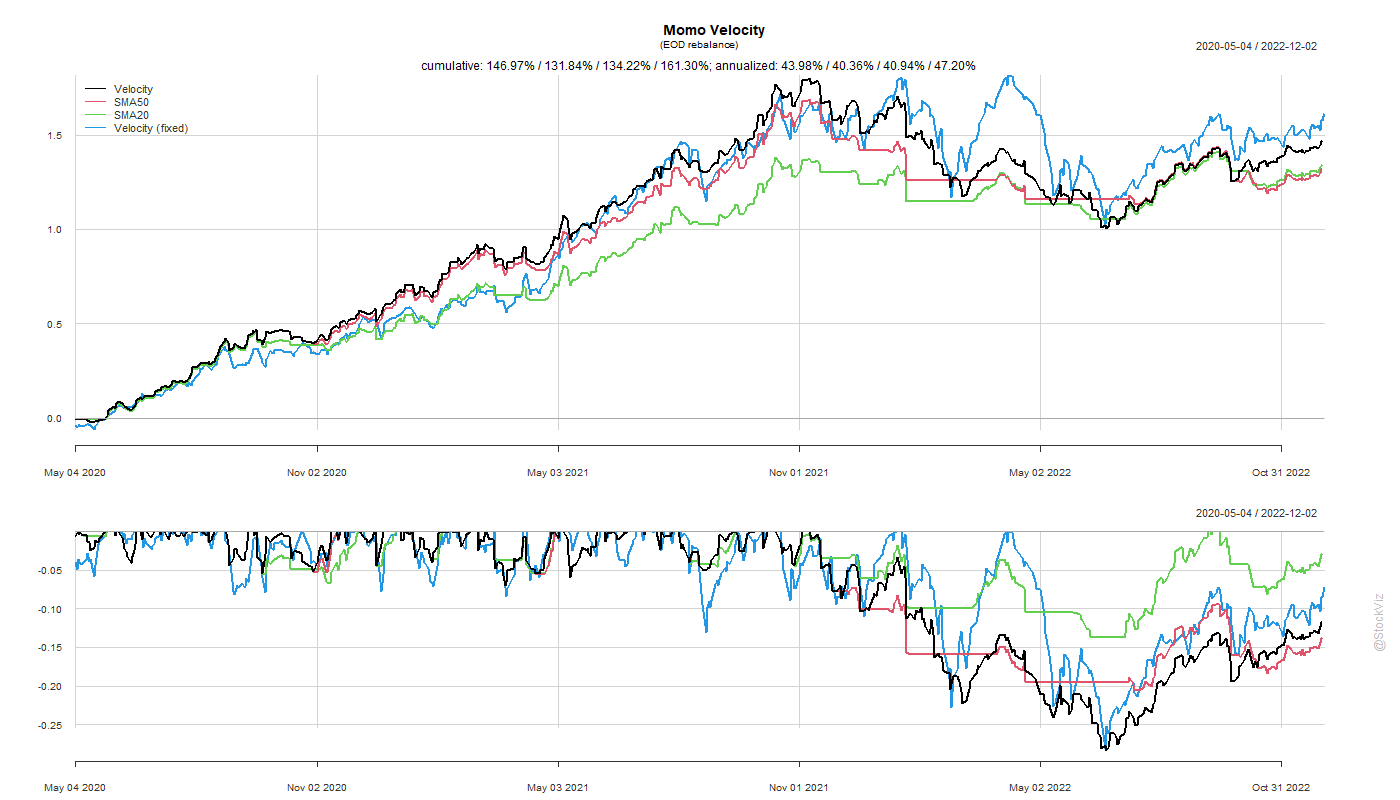
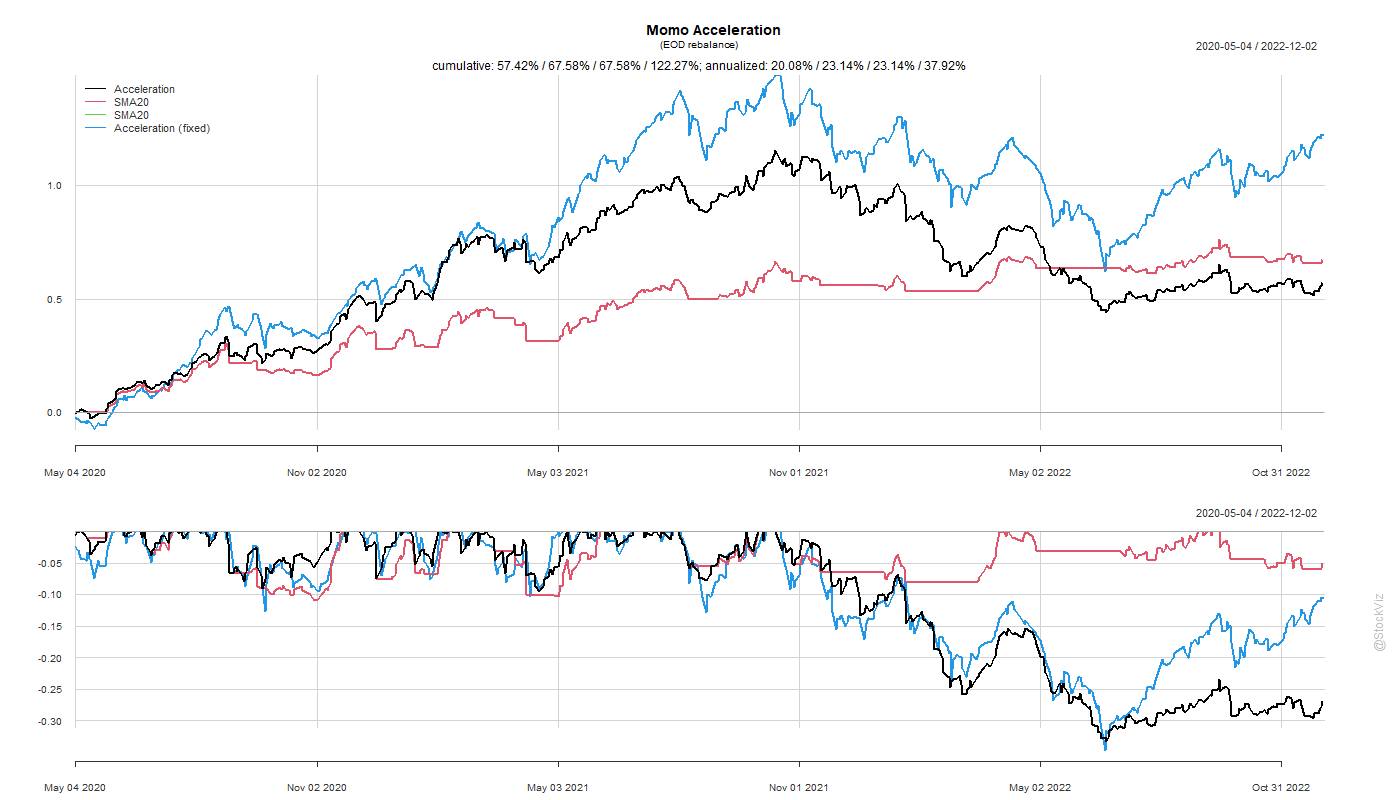
Previously, we discussed how applying a trend filter to a midcap momentum index could make sense. Then, we extended that to our homegrown momentum models. In both cases, there are certain situations where trended momentum side-steps deep drawdowns. However, if you are only looking at “raw” returns, you would be better off with monthly rebalanced momentum versions.
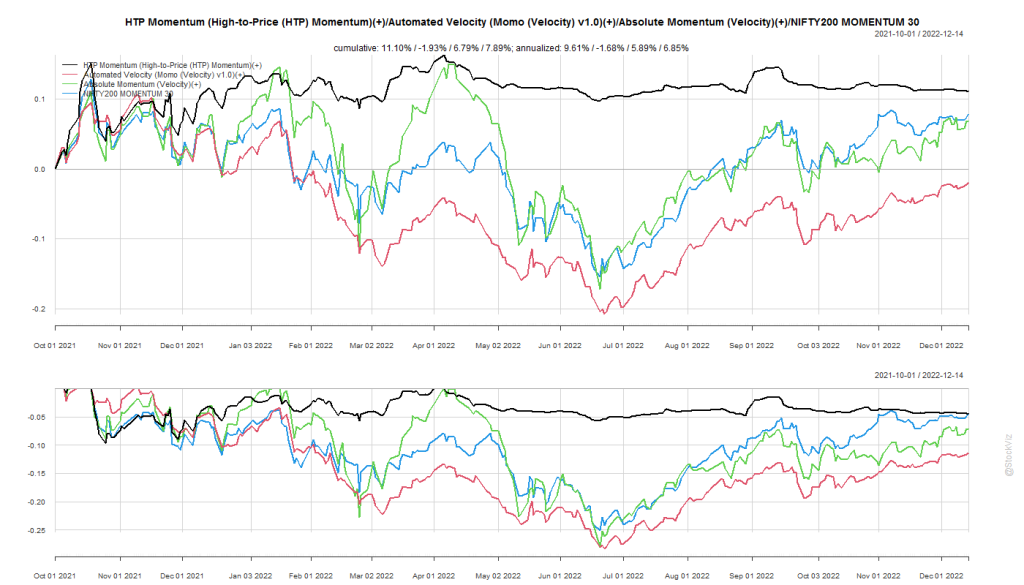
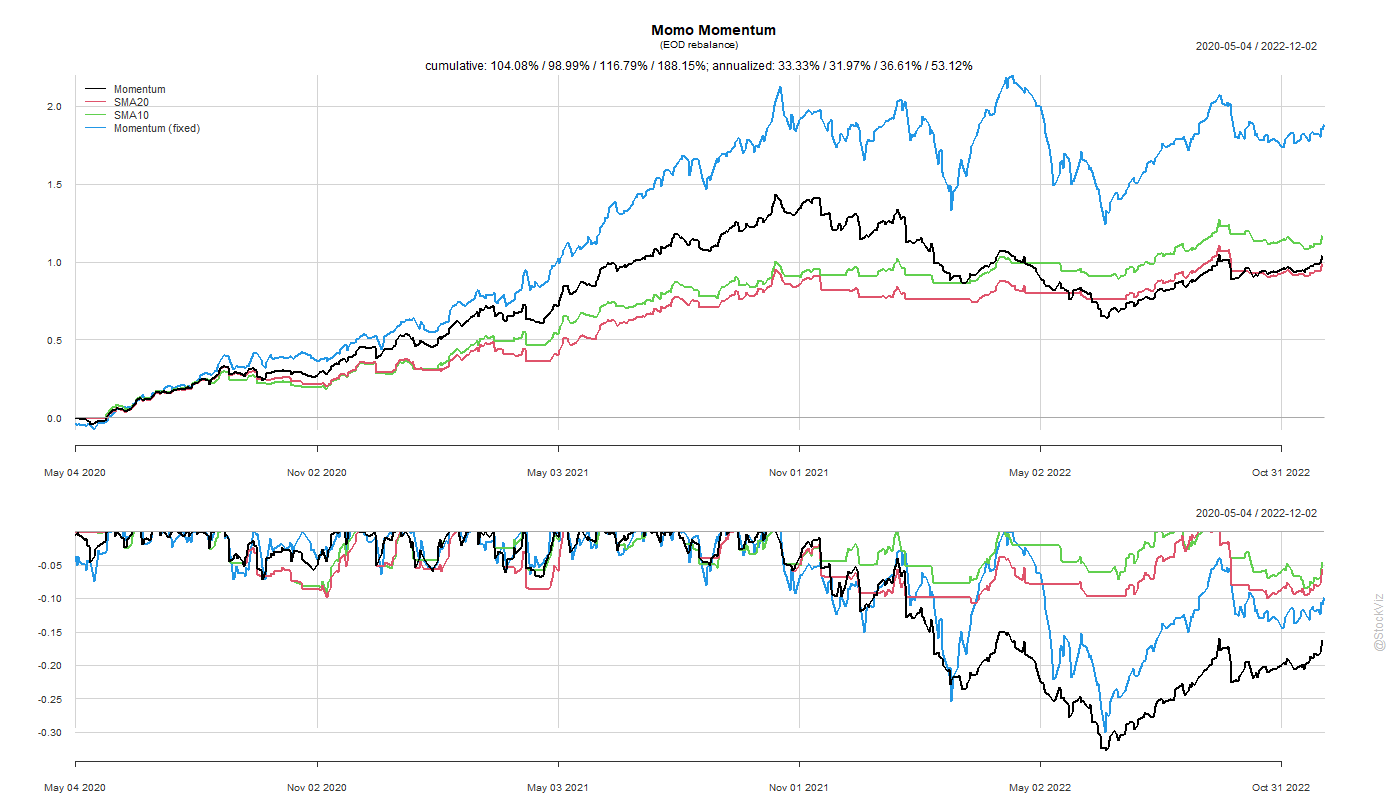
In this post, we run a similar test on the Momo versions of our homegrown momentum models.
Momentum (momo)Velocity (momo)Acceleration (momo)
The problem with high turnover strategies, beyond transaction costs, is the higher operational risk it entails. You could probably get away with postponing trades by a day or two in the monthly rebalance strategies but with these, you need automated trading systems.