Tag: ICICIBANK

Banks: Where do we go from here?

India, the third largest economy in Asia, saw its lowest growth rate in a decade for the fiscal year ending March 2013. The yearly average of 5% was only a tad higher than the last quarter growth rate of 4.8%. Slow economic growth has also affected banks, drastically so for state-run sectors. Loan defaults are piling up as companies go bankrupt. And the companies that can pay via their loaded promoters are trying to wheedle out through corporate data restructuring (CDR).

Private or public, the graph slopes down

Banks saw a 51% hike in non-performing assets (NPA) in 2012-13, with the scale tipping towards public sector banks (PSB) that lend funds out of noblesse oblige. Since the government holds a majority stake in PSBs, the banks have to finance groups and projects that may not be commercially viable but need to be supported for “social good” or “nation building.” The fact that these government initiatives are eventually funded by the taxpayer makes no difference.

Furthermore, state-run banks have a different investment agenda from private players that’s often triggered by a “me too” mindset. It’s common for PSBs to pool funds into industries backed by the government or supported by other state-run banks. Risk assessment checks are inadequate even though public sector banks typically involve more documentation and longer approval cycles, at least for the common man.

The net profit of 38 listed banks in the private and public domain showed a mild rise of 3.63% in the March quarter with private banks outpacing their public counterparts. The net profit of PSBs actually fell by 6.64% while that of private banks rose by 24.63%. The growth rate for the fiscal year amounts to -2.63% and +28% for respective sectors.


Net profit drop in United Bank


State Bank of India, Punjab National Bank, Bank of Baroda, Bank of India and Canara Bank – all showed loss in the March quarter though SBI’s net profit rose 20.5% over the year. Private sector banks such as ICICI Bank Ltd, HDFC Bank Ltd, Axis Bank Ltd, Kotak Mahindra Bank Ltd, Yes Bank Ltd and IndusInd Bank Ltd saw quarter and year net profit rate hikes ranging from 21% to 47%.

Next up, operating profits across banks rose by 6.78% through the March quarter, with private banks experiencing close to 25.41% growth and PNBs only 0.52%. The underlying difference seems to be better control of bad loans by private banks. Public sector banks have had to set aside hefty amounts to cover bad debt, impacting their net profit substantially.

CDR misuse

Indian banks have recast over ₹2 trillion under the CDR mechanism that gives companies under stress some relaxation through lower lending rate and extension of repayment periods. While the objective of CDR is to give debt-laden companies a second chance, it is being grossly misused by companies with affluent promoters well able to infuse funds into the dying business. Kingfisher Airlines is one such case.

In a bid to control CDR misuse and reduce bad debt, Finance Minister P Chidambaram has come down hard on loan defaulters, recommending strict steps for banks to recover funds without hurting the industry. The RBI too is working on the final guidelines to increase the promoter’s contribution in restructuring to a minimum of 15% of the diminution or 2% of the restructured debt, whichever is higher. Banks can demand more from promoters depending on the risk of the project and the promoter’s financial ability to commit.

As a result, banks are showing some clout to recover debts – UCO Bank issued a public notice against Nitin Kasliwal, chairman and MD of S Kumars Nationwide Ltd, guarantor of a ₹110.07 crore loan taken by Reid & Taylor. The ad carries Kasliwal’s picture as well in a bid to “name and shame.” Kingfisher Airlines is not having it easy either.

The banking slowdown hasn’t bottomed out yet as the chances of accelerated economic growth is dim for another few quarters. Regulatory tightening and control of willful loan defaulters will help banks to a degree but no respite is expected from the RBI this time in view of inflation and high current account deficit. Banks will just need to cut their loss and swim with the tide for now.


[stockquote]AXISBANK[/stockquote] [stockquote]BANKBARODA[/stockquote] [stockquote]BANKBEES[/stockquote] [stockquote]BANKINDIA[/stockquote] [stockquote]CANBK[/stockquote] [stockquote]HDFCBANK[/stockquote] [stockquote]ICICIBANK[/stockquote] [stockquote]INDUSINDBK[/stockquote] [stockquote]KFA[/stockquote] [stockquote]KOTAKBANK[/stockquote] [stockquote]PNB[/stockquote] [stockquote]PSUBNKBEES[/stockquote] [stockquote]SBIN[/stockquote] [stockquote]UCOBANK[/stockquote] [stockquote]YESBANK[/stockquote]

Analysis: ICICIBANK (IBN)

Today’s pick is ICICIBANK [stockquote]ICICIBANK[/stockquote]. The stock started the year with a downward move to reach Rs. 800 levels. After finding support for a couple of weeks the stock started its up-ward movement. It saw the 52 weeks high of Rs. 1,210 in February, but since then was on a down-trend to find support on the trend-line. In the last three months, the stock moved +2% same as that of the Nifty’s.

ICICIBANK technical analysis chart

Oscillator RSI and CMO are in no man’s land. The stock is currently trading in the upper side of Bollinger bands. Short-term technical just saw 4X9 and 4X18 bullish SMA cross-over.

The MACD line has just penetrated the signal line in a bullish manner. However, the Long-term and short-term GMMA lines are contracting, unable to provide any outlook for the stock.

ICICIBANK correlation chart

ICICIBANK’s average correlation with the Nifty is 0.82 which is positive and very strong. The scrip will be closely replicating movement of Nifty. [stockquote]NIFTYBEES[/stockquote]

ICICIBANK volatility chart

ICICIBANK has a historical volatility in the range of 0.3 to 0.8. The scrip’s volatility is currently in the lower end of the range.

ICICIBANK analysts coverage

Analysts have positive expectations regarding this stock. Less than expected earnings might hit the street expectations in the coming reviews and might impact the stock as well.

Given these technicals, we suggest a short-term Hold. A long-term call could be taken depending on the price action around Rs. 1,200 levels. It is also suggested to have tight trailing stop-losses level to book profits in case of a sudden trend-reversal.

Analysis: ICICIBANK (IBN)

Today’s pick is ICICIBANK [stockquote]ICICIBANK[/stockquote]. The stock started the year with an uptrend to see Rs. 1,000 levels in February, but lost its mojo to find support at Rs. 800 levels by June. Since then the stock again started its up-move and saw its 52 weeks high of Rs. 1,200 a couple of weeks ago. In the last three months, the stock has moved +12% vs. +7% of the Nifty’s.

ICICIBANK technical analysis chart

Oscillators RSI and CMO are hovering in no man’s land and hence are not suggesting any direction. The stock is trading in the middle of its Bollinger band. Short-term technical just saw 18×4 and 18×9 bearish cross-over.

The MACD line and signal line are moving away from each other and unable to suggest any short-term direction. Long-term GMMA lines are moving away from each other and hence are giving a bullish bias for the stock.

ICICIBANK correlation chart

ICICIBANK’s average correlation with the Nifty is 0.82 which is positive and very strong. The scrip will be closely replicating movement of Nifty. [stockquote]NIFTYBEES[/stockquote]

ICICIBANK volatility chart

ICICIBANK has a historical volatility in the range of 0.3 to 0.8. The scrip’s volatility is currently in the lower end of the range.

It appears that only one bulge-bracket analyst (Credit Suisse) is covering this stock and has an “out-perform” on it.

Given these technicals, we suggest a short-term Watch. A longer term call could be taken based on the directional break-out of the flag under formation.

Enhanced by Zemanta

Analysis: ICICIBANK (IBN)

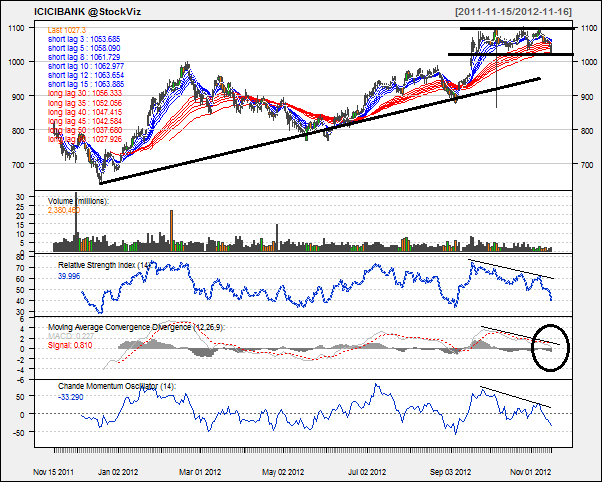
Today’s pick is [stockquote]ICICIBANK[/stockquote]. The stock has been in an up-trend since lows of last December. However, the last one and a half month has seen a range bound movement for the stock. In the last three month period, the stock was up 6% Vs. Nifty’s 4%.

image

Oscillators RSI and CMO are at currently at 40 and -33 are hovering around the over-sold territory but are not suggesting any direction.

MACD line and the signal line are moving away from each other and are not suggesting any trend. The 18X9 cross-over is currently bearish.

Every technical chart currently is showing a divergence with the price chart. This is not a very good sign for the near-term.

The GMMA long-term lines were running parallel to each other but are closing in because of the range-bound movement in the recent past. This is a bearish sign for the stock.

image

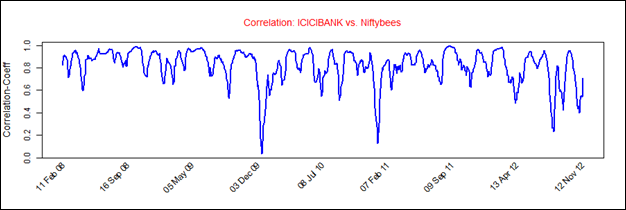
ICICIBANK’s average correlation of 0.82 with the Nifty is positive and quite strong. The stock will replicate the movements of Nifty closely because of the high co-efficient. [stockquote]NIFTYBEES[/stockquote]

image

ICICIBANK has a historical volatility in the range of 0.3 to 0.8. The scrip’s volatility is currently towards the higher side of the range.

Analysts have mixed expectations regarding this stock. Next set of earnings can help bring a different picture on the charts.

Looking at these technicals, keep off this scrip for the short-term. A break-out of the flag in either direction will trigger a longer-term call.

Enhanced by Zemanta

Race for savings amidst rise in bad loans

While banks have always been aggressive in shoring up their CASA (current account/savings account) ratio, the chase for less expensive deposits has picked up post savings rate deregulation.

image

For biggies like State Bank of India [stockquote]SBIN[/stockquote], Punjab National Bank [stockquote]PNB[/stockquote], HDFC Bank [stockquote]HDFCBANK[/stockquote], and ICICI Bank [stockquote]ICICIBANK[/stockquote], savings accounts make up 30-35% of their total deposits. For relatively smaller banks like Corporation Bank and Oriental Bank of Commerce, it is lower at 15-20%. Although retail deposits are the cheapest form of funding for banks, it comes with the millstone of having to operate a vast retail presence – a network of branches across the country.

While new entrants like Yes Bank [stockquote]YESBANK[/stockquote] and Kotak Mahindra Bank [stockquote]KOTAKBANK[/stockquote] raised their savings account deposit rates in a flash to 6%, big boys like SBI and ICICI played the waiting game. Late last year, SBI launched an innovative FD scheme, ‘unfixed’ deposit product, through which it has garnered over Rs 30,000 crore till March. The lender lured savers by offering 8.5% interest rate along with the flexibility to withdraw without penalties.

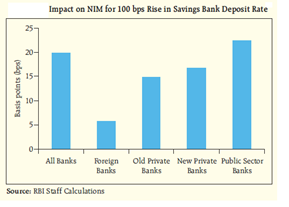
clip_image001Even though many banks are yet to tinker with their savings rate, it is unlikely to significantly impact their net interest margin (NIM).

While banks have aggressively wooed depositors, borrowers have given them a tough time. The Gross Non-Performing Assets (NPAs) of nationalized banks rose to 2.4% of advances as on December 31, 2011 from 1.9% as on March 31, 2011. However, private banks saw their NPAs moderating to 2.1% in Q3 against 2.3% in the same period last fiscal.

Bad loans have risen as credit to sectors like aviation, telecom, power clip_image001[6]and agriculture have gone sour. Market leader SBI’s gross NPAs for agriculture during the December quarter surged to 9.45% as against overall bad loans of 4.61%.

The gross NPA ratio for all banks in respect to the agriculture segment rose to 3.3% in March 2011 as against 2.4% in March 2010.

Despite pressure on margins due to higher deposit rates and concerns over asset quality, the banking sector as a whole will continue to display resilience, says a report by Care Rating based on the performance of 39 banks during the first nine months of this fiscal (FY 12).

With the Reserve Bank of India getting an assurance from top bankers in February that all is well on NPAs and there is no systemic threat, I guess, we can take it easy just like Big Brother.