Tag: ACC

Algorithms At Work!

The last few weeks have been brutal to cash-only equity investors. The NIFTY has gone nowhere even while swinging wildly on a daily basis. Is there a way to turn a profit given what has been going on?

Yes! With the help of option strategies it is possible to profit from stocks you expect to go side-ways. Here’s what we did.

ACC technical analysis chart

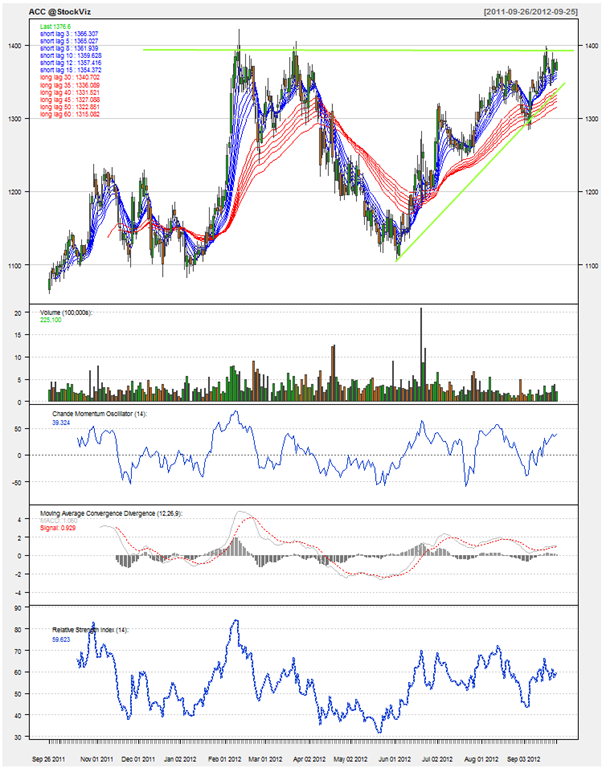
StockViz Option Ideas drew our attention to the ACC Long Call Butterfly around the 10th of December. The stock was under a pennant formation, and was on a decline from its 5 day high of Rs. 1445. With Bollinger bands enveloping 1450 and 1360 levels, there was a strong possibility that that stock was going to be range-bound for a bit.

We entered a long call butterfly trade for December expiry. With an outlay of Rs. 26,750 we bought 5 contracts (market lot of 250).

ACC long call butterfly trade P&L

The payoff chart for our butterfly looked something like this:

ACC long call butterfly payoff

With ACC ending at Rs. 1402 at option expiry, the position made us Rs. 9,950 (38%) profit in just 17 days even as equity holders sucked wind.

Here’s what your New Year’s resolution should be:

KEEP CALM trade options

[stockquote]ACC[/stockquote]

Analysis: ACC

image

This week’s pick is [stockquote]ACC[/stockquote] limited. Trading somewhere close to it’s 52 week high, the return over the last 9 month period is about 16%. Recently, the stock saw a close below the level of 1300, but picked up quite strongly the next day, signaling a support at those levels.

Currently oscillators like RSI and CMO are at 59 and 39, which is in the mid zone for this particular scrip. It has still got some time to reach the overbought/oversold signals and hence they don’t suggest much. MACD line and signal line are moving very close to each other and hence again are not giving any signal currently.

Looking at GMMA for a medium to long term outlook proves to be quite positive. The long term lines are holding quite distinctly and are separated from each other (signaling a continuing long term trend). Also the increasing separation in the short term lines backs up the positive outlook given by the long term lines for the near term. It would be suggested to hold your breath and be long the stock until you come across the squeezing long term lines following the overlaps in the short term lines.

Looking at the trend-line we can say that it is in the right place. Also, the stock has tested 1400 levels quite many times during the last 3 quarters. It can act as a strong resistance for the up-move, but a breakout above this level might prove to be a real deal for the portfolios. So this stock currently is a hold from our side and can continue the current uptrend if it closes successfully above 1400 levels.