Bollinger Bands is one of the most widely used volatility indicators. The band is developed by John Bollinger and as the name suggests these are bands (ranges) above and below the price movements. The bands widen when the volatility increases and narrow when volatility decreases. They can be used to identify M tops and W bottoms or to determine the strength of the underlying trend.
The band uses 20 day SMA’s for the calculation of the middle band and for the upper and lower band, SMA plus or minus 2 standard deviations of the past 20 days prices. A simple moving average is used because the standard deviation formula also uses a simple moving average. 95% of the price data should fall between the two bands. The prices are considered to be overextended on the upside (overbought) when they touch the upper band. They are considered to be overextended on the downside (oversold) when they touch the lower band.
“W” Bottoms
Arthur Merrill developed 16 patterns with a basic W shape. A W bottom forms in a downward and involves two reaction lows. In particular you should look for W bottoms where the second low is lower than the first, but holds above the lower band. There are a four steps to confirm a W bottom with Bollinger bands.
- A reaction low is formed (usually below the lower band, but not necessary)
- Bounce towards the middle band
- There is a new price low in the security, this low holds above the lower band (shows less weakness on the last decline)
- The pattern is confirmed with strong move off the second low and a resistance break.
“M” Tops
According to Bollinger, tops are usually more complicated and drawn out than bottoms. M top is very similar to a double top, though the highs might not always be equal. The second high can be lower or higher than the first high, but Bollinger suggests looking for a sign of non-confirmation when a security is making new highs. A non confirmation occurs with three steps:
- A reaction high is forged above the upper band
- Pullback towards the middle band
- Prices move above the previous high but fail to reach the upper band
The inability of 2nd set of price to reach the upper band shows waning movement, which can foreshadow a trend reversal. Final confirmation comes with a support break or bearish indicator signal.
Walking the bands
Moves above or below are not signals per se, but rather act as tags. A move to the upper band shows strength while a move towards the lower band shows weakness. According to the momentum oscillators overbought and oversold signals do not necessarily provide a bullish or bearish signal. Hence the prices can actually walk the band with numerous touches during a strong uptrend and not face the trend reversals.
During this period, prices won’t close above upper band if in a downtrend or won’t close below the lower band if in an uptrend. Such a pattern of the prices staying within the bands (in sync with the underlying trend is called walking the trend.
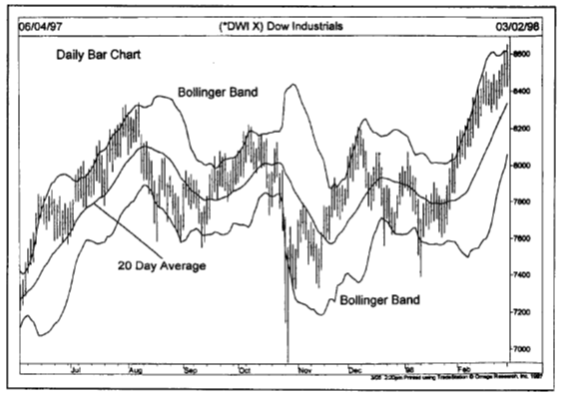
Let us now look at an example of the above 3 signals and understand how it looks like when it is happening.
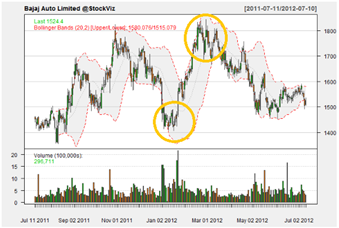
In the above chart you can see how we have the W bottoms and the M tops at work. With the top you can see the pullback move (the 3rd spike) and how it was unable to cross the last high and also the upper band.
In the above chart you can see how in the walking the bands for the underlying uptrend the prices are not able to close past the lower band, and hence they keep under the band all this time. 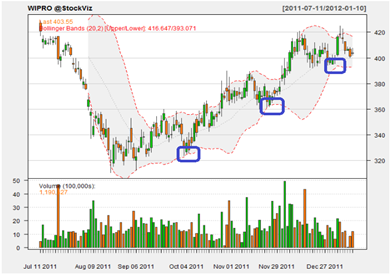
In your trades, Bollinger bands can be of great help in understanding the price moves. According to Bollinger, the prices for 89 – 90% of the time should be within the bands, the rest can act as your cue for next move.
Utilize them to see how volatile the last 20 days have been to make an informed judgment about your scrip.
Bollinger Bands can be used to decide on option trades as well. Narrowing Bollingers indicate that volatility is falling. If the bands have narrowed significantly over their 2-3 month average, it could be time to buy volatility on that stock. Compression of Bollinger Bands is usually signal of a coming volatility surge.