Open sourced by Meta back in 2017, Prophet is a procedure for forecasting time series data. How does it compare to GARCH(1,1) and locf (last one carried forward) for forecasting VIX 20 days out?
We fit 500-days of rolling VIX data using Prophet and GARCH(1,1) and forecast forward 20-days. We then calculate the RMSE (Root Mean Squared Error) of the forecast vs. actual of both the models and locf. Plot RMSE of all three.
Ideally, you want the error to be low and the tail of errors to be as short as possible. GARCH(1,1) looks worse than Prophet. However, locf beat both?
There are a number of ways to construct low-volatility portfolios. You could either use a bottom-up approach of selecting individual stocks that have low-volatility or you could you could run them through a portfolio optimizer (Low Volatility: Stock vs. Portfolio) to get target weights. However, if you are trading a single index, then you could use its own volatility to scale your exposure up and down. The advantage here is that if you trade index futures, you can set the volatility and leverage dials to the risk that you are most comfortable with.
Let’s take our own NIFTY 50, for example. Calculate the std-dev of daily returns over a sensible window. The index exposure is simply the ratio of the median std-dev vs. the current std-dev. Use a scaling factor (tvf) to further fine-tune the risk. To reduce transaction costs, rebalance once a week.
A tvf of 0.25 has roughly half the returns of buy & hold but with superior risk metrics that makes it receptive to leverage.
The problem with this approach is that the weights are continuous. What if you want them discrete so that it directly maps to how many lots of NIFTY you need to trade?
Here, we bucket the std. dev. into quintiles and use that to set our exposures in discrete steps.
At 2x leverage, you will outperform buy & hold by 5% with only half its drawdown.
The same for NIFTY MIDCAP SELECT looks like this:
The stats for this index looks worse than buy & hold. However, volatility sizing has resulted in lower drawdowns.
Stats and charts for different indices and code are on github.
Previously, we discussed how overnight volatility is not necessarily the scary boogeyman that it is made out to be. However, what maybe true for the NIFTY may not be true for other indices. For example, commodity stocks could carry larger overnight risks than, say, FMCG stocks.
If you look at the median volatilities of the two indices, commodity stocks have larger close-close volatility than FMCG stocks. However, FMCG stocks have lower volatility in general, so not sure if the differences are meaningful.
What about QQQs (US tech) and XLE (US Energy)?
Most energy related reports are released during US market hours while earnings reports are not. That could explain why XLE relative overnight volatility is lower than QQQ’s? Also, weekend risks averaging less than daily and overnight risks is surprising as well.
Our previous post discussed how the implied volatility (IV) of OTM puts are often higher than the IV of OTM calls. We would like to add that this “smirk” is very much warranted – it is not an invitation to sell OTM puts. Returns of financial instruments often have negative skew – a fancy way to say that they often take an escalator up, and an elevator down.
Here are the daily and weekly return skews of the NIFTY 50 TR index and the SPY ETF:
The market is willing to pay up to hedge against this risk. If you sell the skew, you’ll have to hedge against it by some other means. Otherwise, it is like picking up pennies in front of a bulldozer.
When you use the Black-Scholes-Merton (BSM) model, you end up with theoretical prices that assumes that volatility affects all strikes uniformly. i.e., strikes have no bearing on implied volatility (IV). This was largely true in the market as well until the crash of 1987. However, after the October 1987 crash, the implied volatility computed from option prices using the BSM model started differing between puts and calls. This is called “volatility smile“, or the smirk, given its actual shape.
The reason for this is quite simple, markets take the stairs up and the elevator down. Fat tails, if you must. So, put options sellers require a little bit of an incentive to take on that risk.
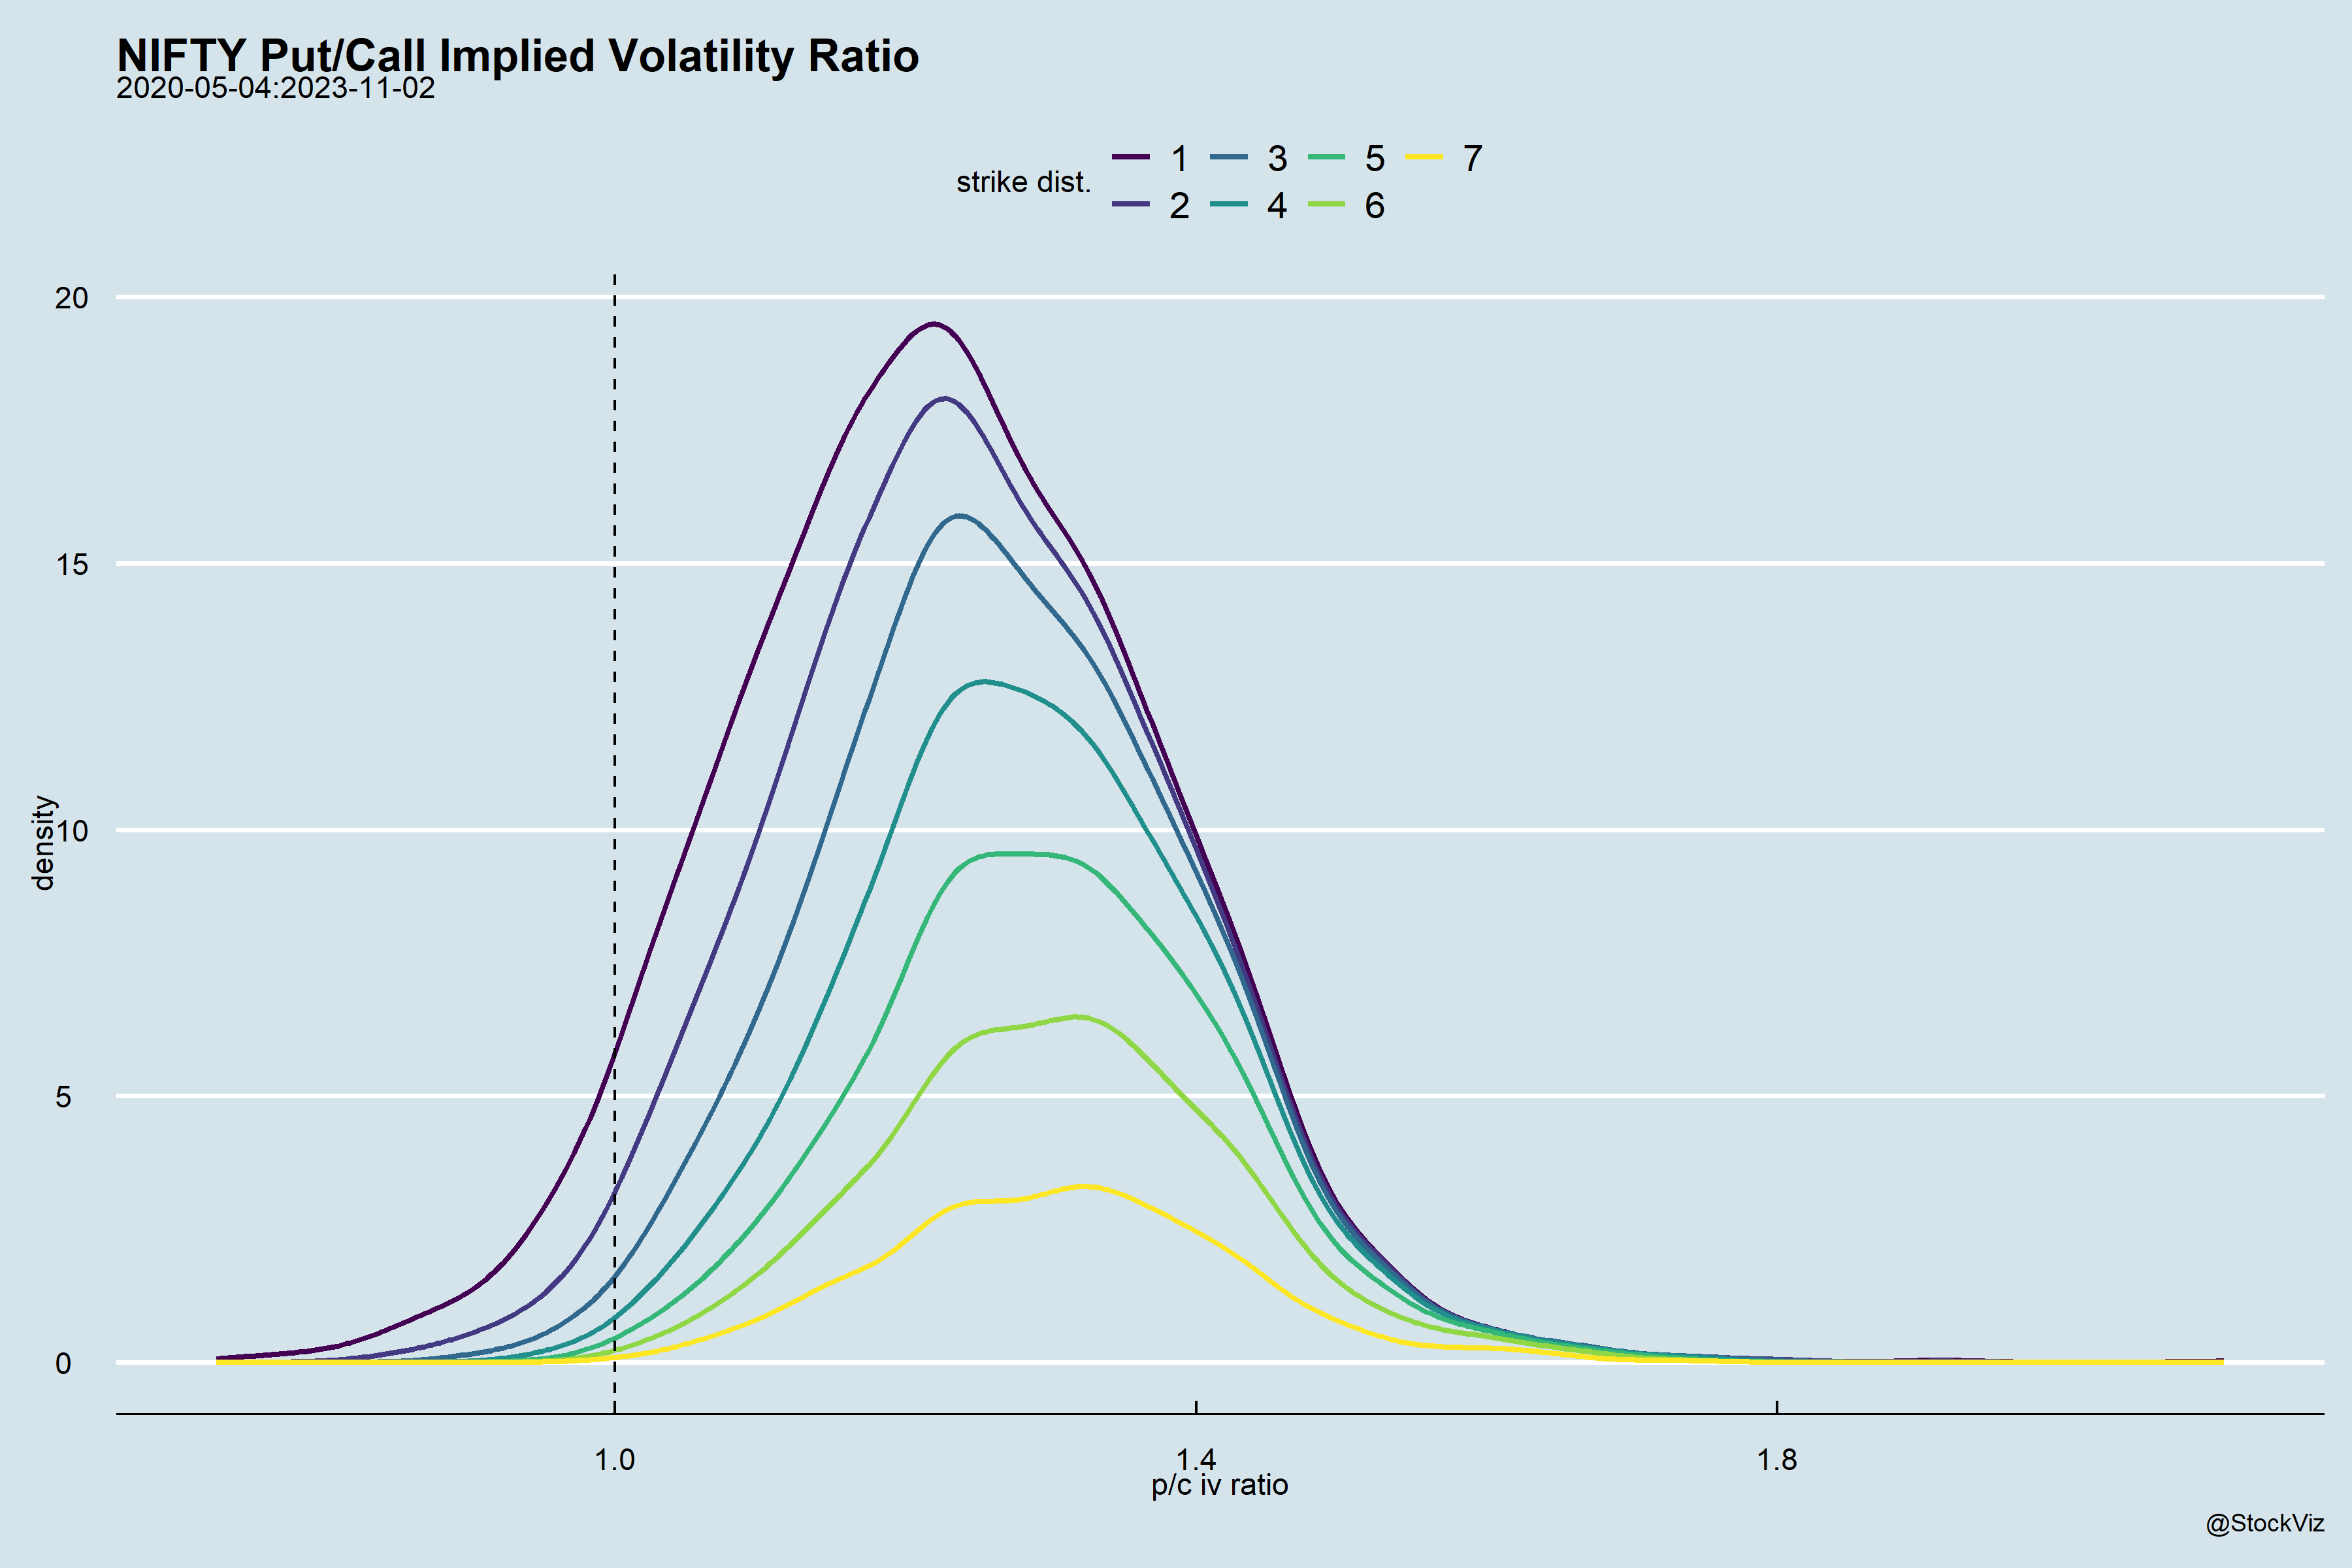
How crooked is the smirk? If you take the ratio of the IVs of OTM puts to OTM calls and plot them, you’ll notice that as you get farther away from spot, the distribution flattens out.
Notice the area below 1.0? Those are the days when the calls were trading at a higher IV than the puts.
On the left of zero are the calls with descending order of strikes and on the right are puts with ascending order of strikes. The farther away from zero, the more OTM they are.
Also, unlike the stylized charts of IV you might have seen with sweet smiles, the reality is quite different.
If this tickles your curiosity, do read The Risk-Reversal Premium, Hull and Sinclair (SSRN)