Tag: tools

Mutual fund portfolio overlap in UpSet charts

Mutual funds come in different shapes and sizes. Very often, fund investors end up being exposed to the same set of stocks even if they invest in different funds. And not only can there be significant overlap in mutual fund portfolios, some fund managers could be “hugging” the benchmark index. For example, a mid-cap fund could have too much of an overlap with the mid-cap index, effectively making it a more expensive version of an index fund. Therefore, it makes sense for investors to check the portfolio overlap of funds that they are considering not only with each other but also with index constituents.

A common way to visualize overlaps is with a Venn diagram. However, when you have more than five sets (portfolios,) a Venn diagram becomes hard to read. Enter UpSet charts. Here is an UpSet chart that our Overlap Tool creates for the HDFC Mid-Cap Opportunities Fund and SBI Magnum Mid-Cap Fund portfolios:
HDFC Mid-Cap Opportunities Fund and SBI Magnum Mid-Cap Fund portfolio upset chart

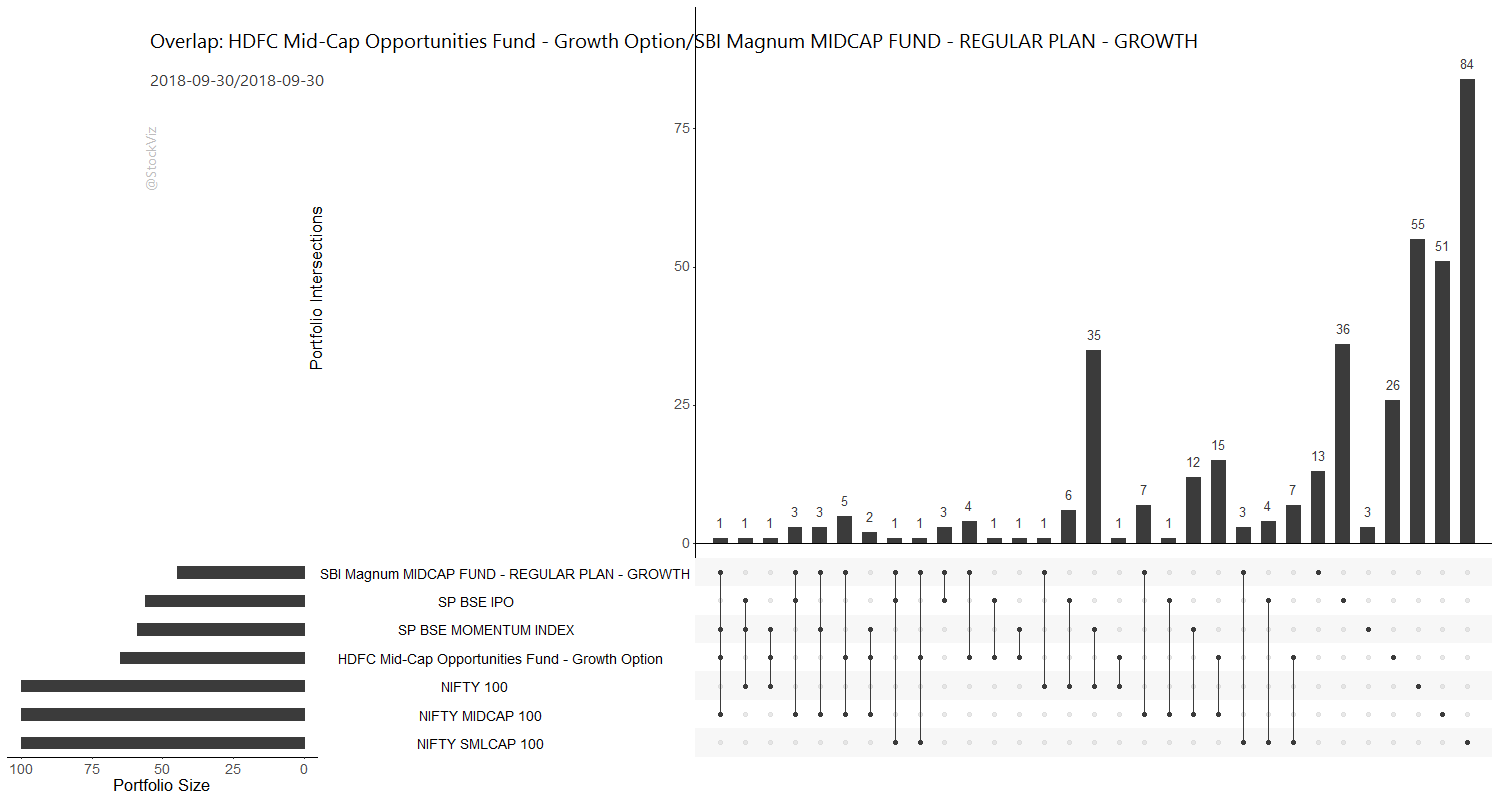
Key regions of the chart:

  • Bottom-left: size of each portfolio.
  • Bottom-right: the intersection under consideration.
  • Top-right: the size of the intersection.
  • Titles: Funds being analyzed and their portfolio disclosure dates.

In this example, to see the overlap between the two funds, search for the connection between the 1st and the 4th rows in the bottom-right region and look up – you will see the size of the intersection to be 4. i.e., the funds only have four stocks in common even through each one has more than 50 stocks in its portfolio.

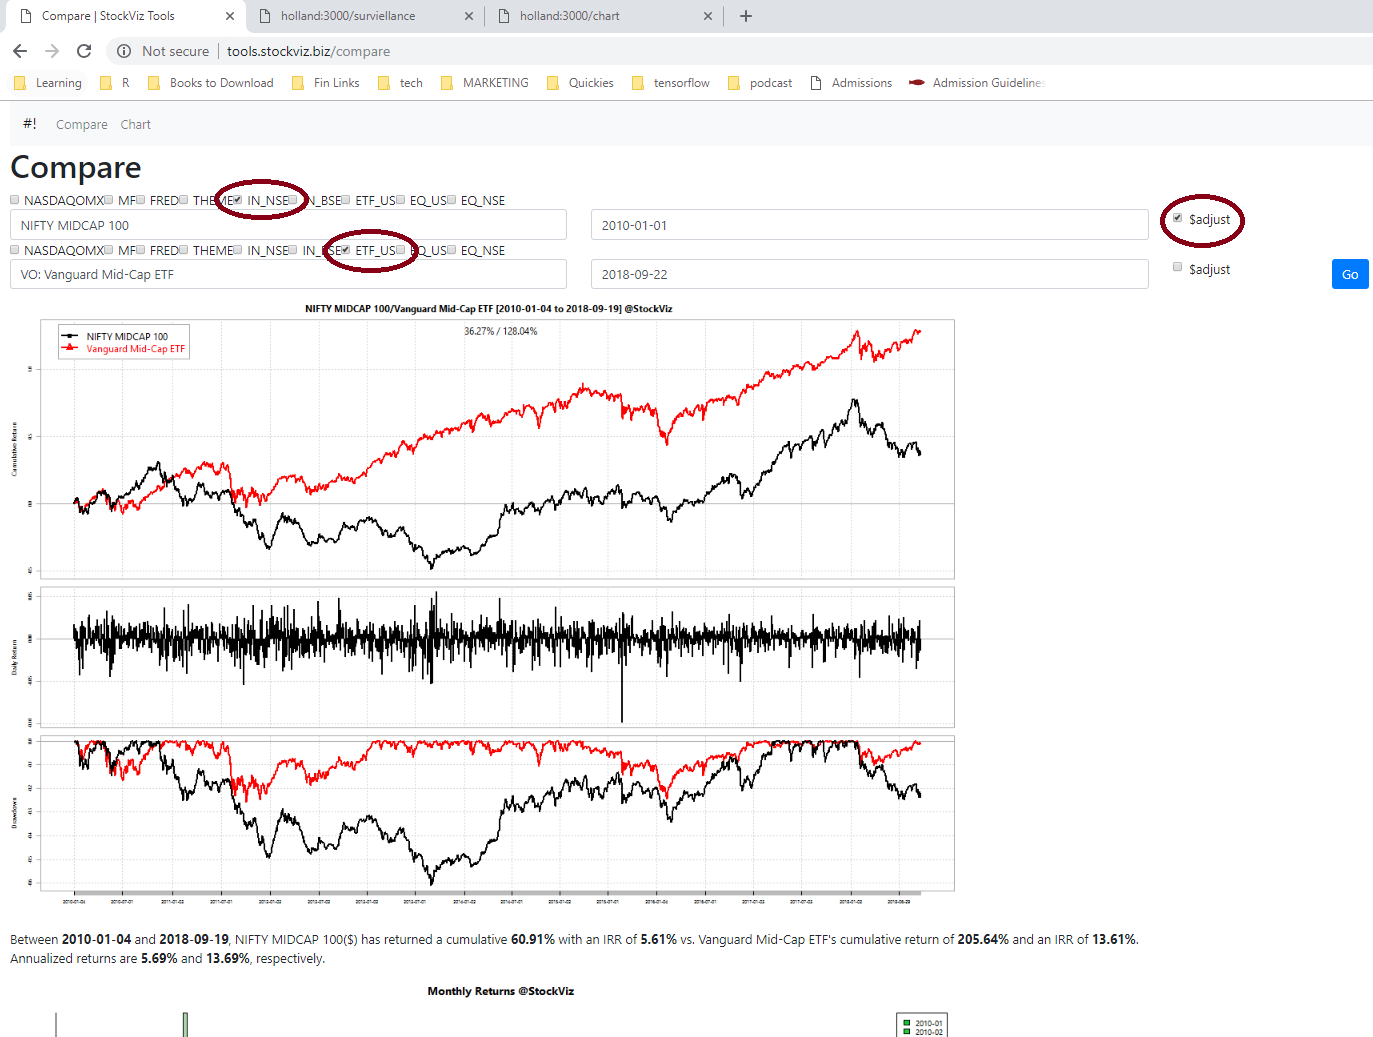
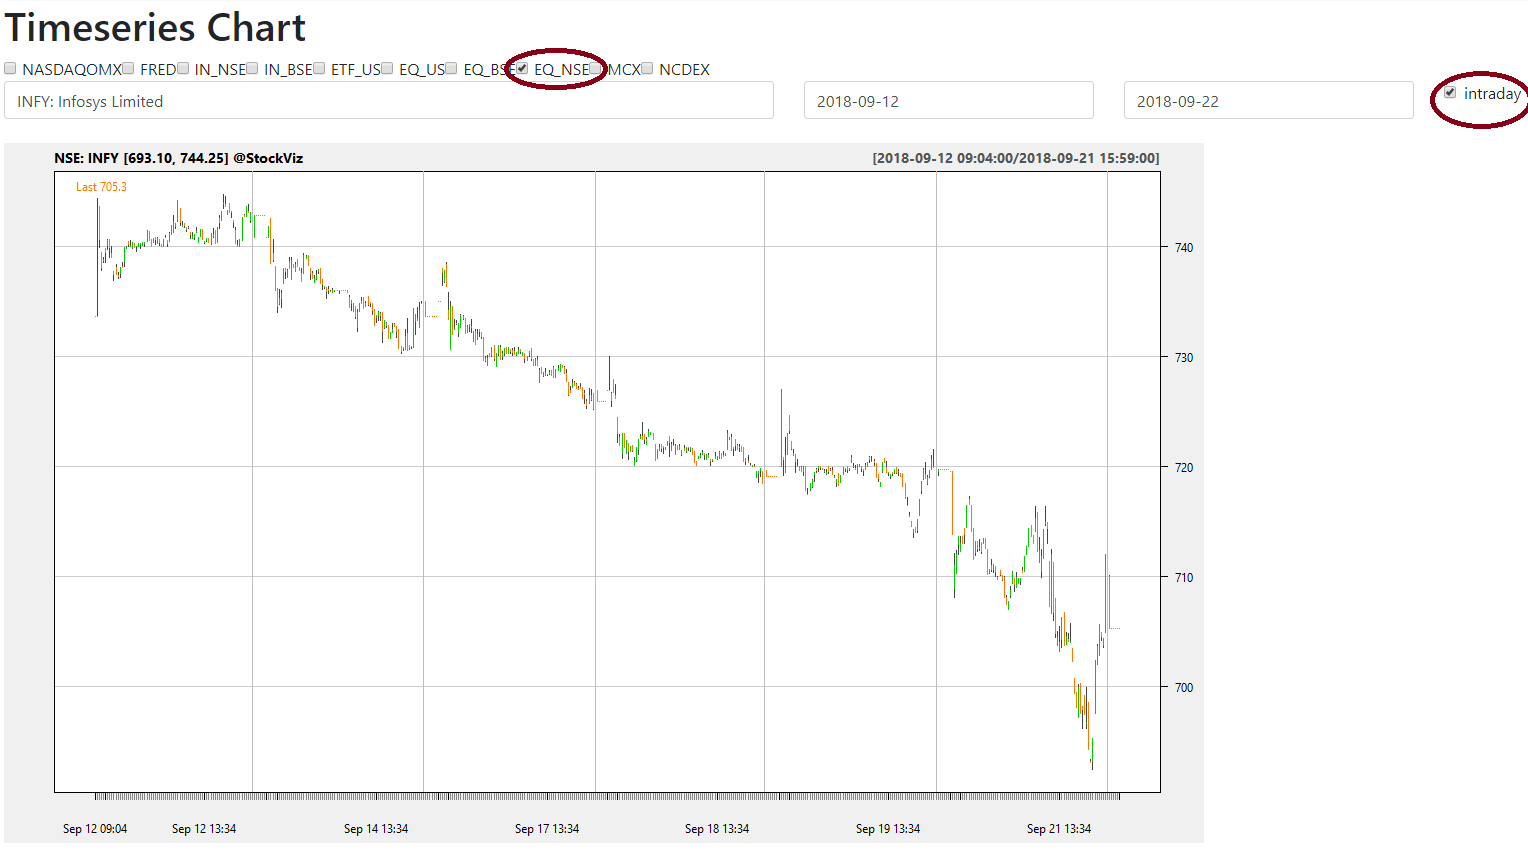
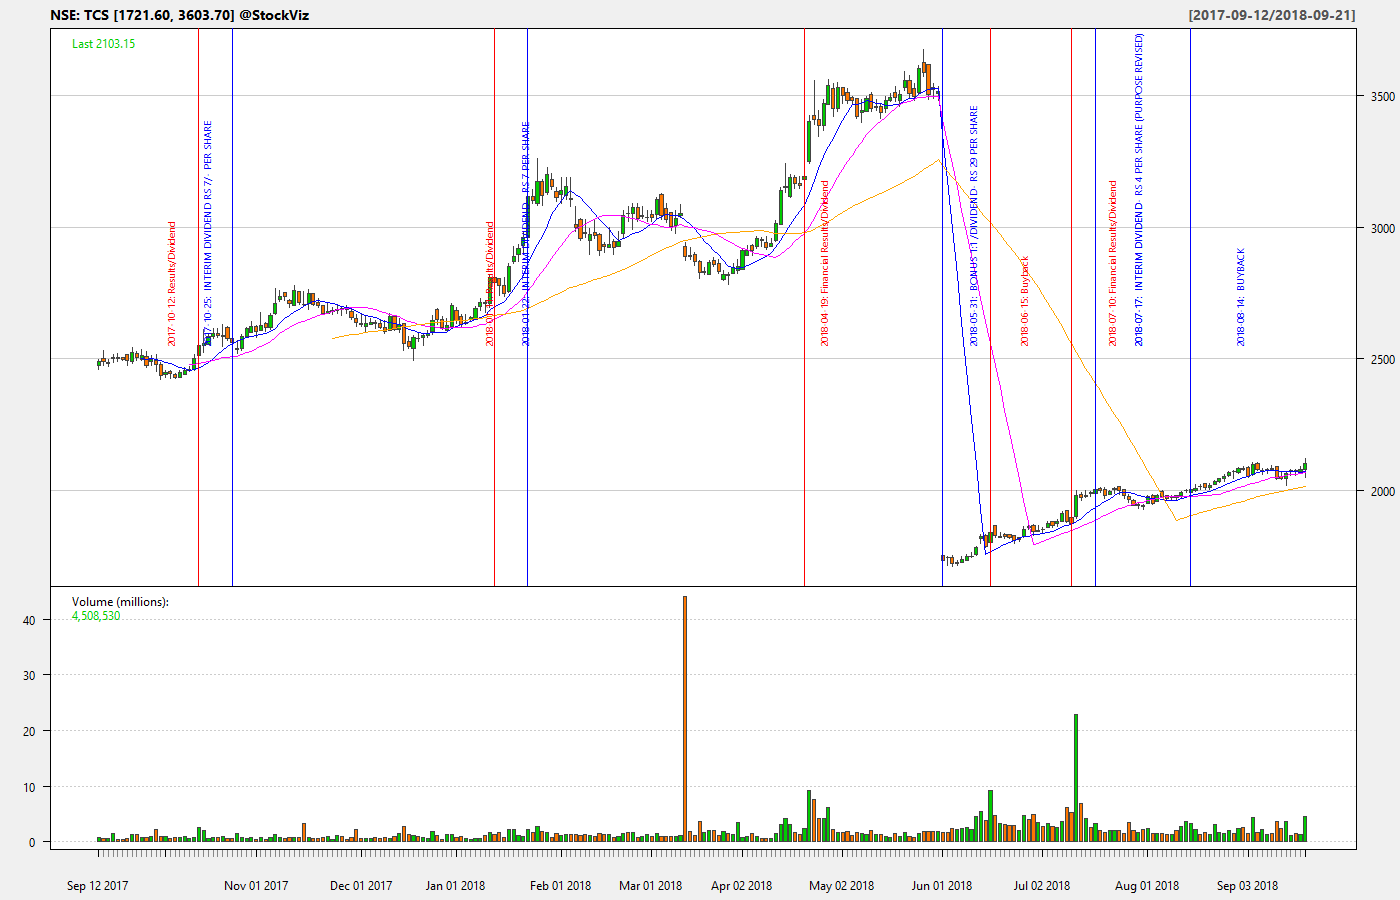
We have included some common indices to help investors identify index-hugging as well. You can run the Overlap Tool here. For an intro to the other tools available on StockViz Tools, please read this post.

StockViz Tools

Compare and Plot multiple time-series datasets

Ever wondered how the dollar adjusted NIFTY MIDCAP 100 index performed vs. US Midcaps? Wonder no more! You can now quickly run a comparison using our new Compare tool.

compre time-series

We have made a large number of datasets available:

NASDAQOMX The NASDAQ OMX TR USD Dataset
MF A pruned set of Indian mutual funds
FRED The St. Louis FRED dataset
THEME StockViz Themes
IN_NSE Indices available on the NSE
IN_BSE Indices available on the BSE
ETF_US US listed ETFs
EQ_US US listed Stocks
EQ_NSE Stocks listed on the NSE
EQ_BSE Stocks listed on the BSE
MCX Commodity futures listed on MCX
NCDEX Commodity futures listed on NCDEX

The “THEME” comparison tools also gives you the impact of STT and brokerage costs on returns.

So, now you can compare pretty much anything with everything.

When it comes to plotting a single time-series, we have made intraday prices on stocks listed on the NSE available. You can run these 10-days at a time:
chart time-series

The daily chart of NSE stocks also marks important corporate actions:
TCS daily time-series candle-stick with corporate actions

Keeping it free

The biggest challenge we faced was managing data storage costs. Earlier, we tried to upload all the data to the cloud but we quickly ran into performance bottlenecks and costs overruns. So we went back to the drawing board and designed a hybrid solution where the data and the analytics reside within our firewalls and only results are displayed to the user. This allows us to keep these tools free and open to everybody.

I want more!

If you want to see something here that would be of interest to other investors/traders, please WhatsApp us (+918026650232) with your ideas!