Tag: theme

Investment Theme Performance Roundup

WHAT IS A “THEME”?

A StockViz Investment Theme is a portfolio of stocks that follows a particular strategy. It is a convenient way for you to:

  1. stick to a strategy
  2. follow a preset rebalancing schedule
  3. think in terms of your portfolio strategy rather than individual stocks
  4. avoid common behavioral pitfalls
  5. systematically track your P&L and strategy performance

WHAT IS AN INVESTMENT STRATEGY?

An investment strategy is a specific way of going about the process of investing. It identifies specific variables that define a stock. Variables can be anything: risk, style, sector, balance-sheet items, etc..

By mapping specific Themes to your account, you ensure that you stay pure to your strategy allocation. And that there is no “flying by the seat of your pants” investing.

HOW HAVE YOUR THEMES PERFORMED?

Theme Commencement Performance NIFTYBEES Performance JUNIORBEES Performance
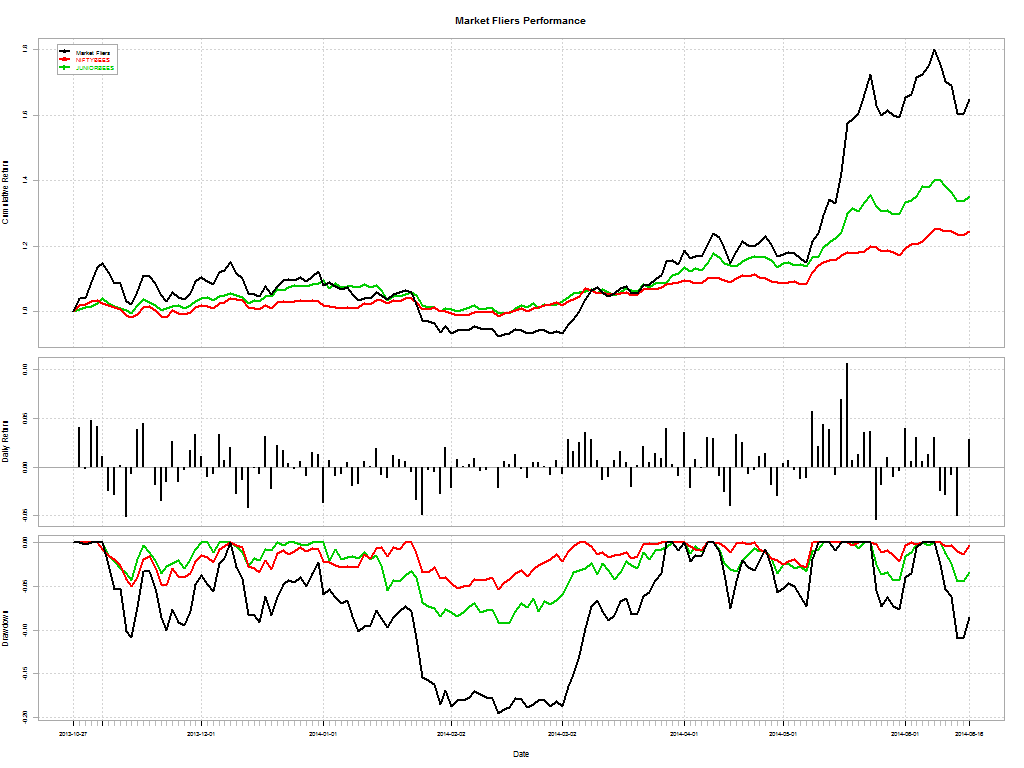
Market Fliers
2013-Oct-28
64.79%
24.5%
35.1%
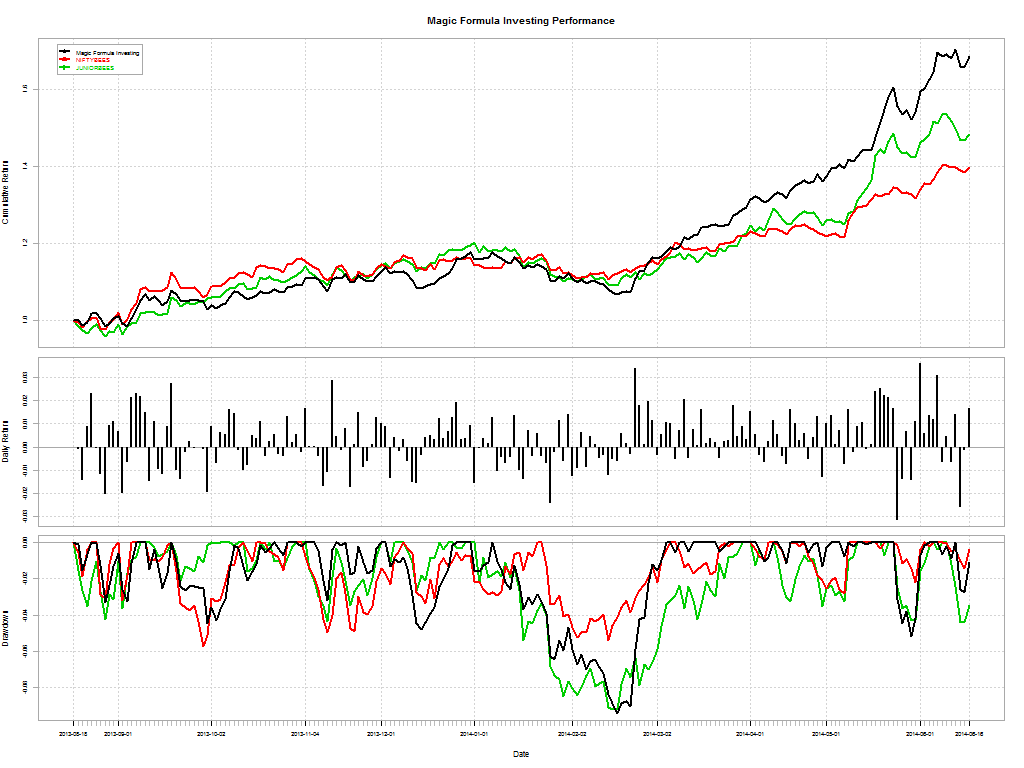
Magic Formula Investing
2013-Aug-19
68.67%
39.89%
48.38%
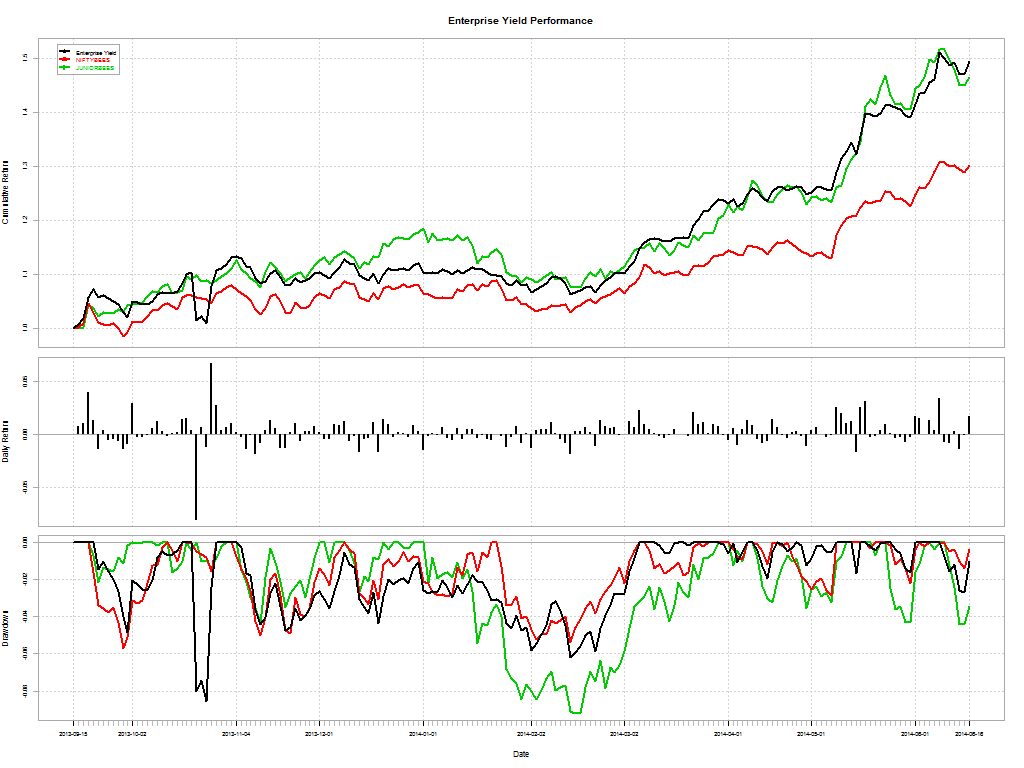
Enterprise Yield
2013-Sep-16
49.51%
30.24%
46.46%
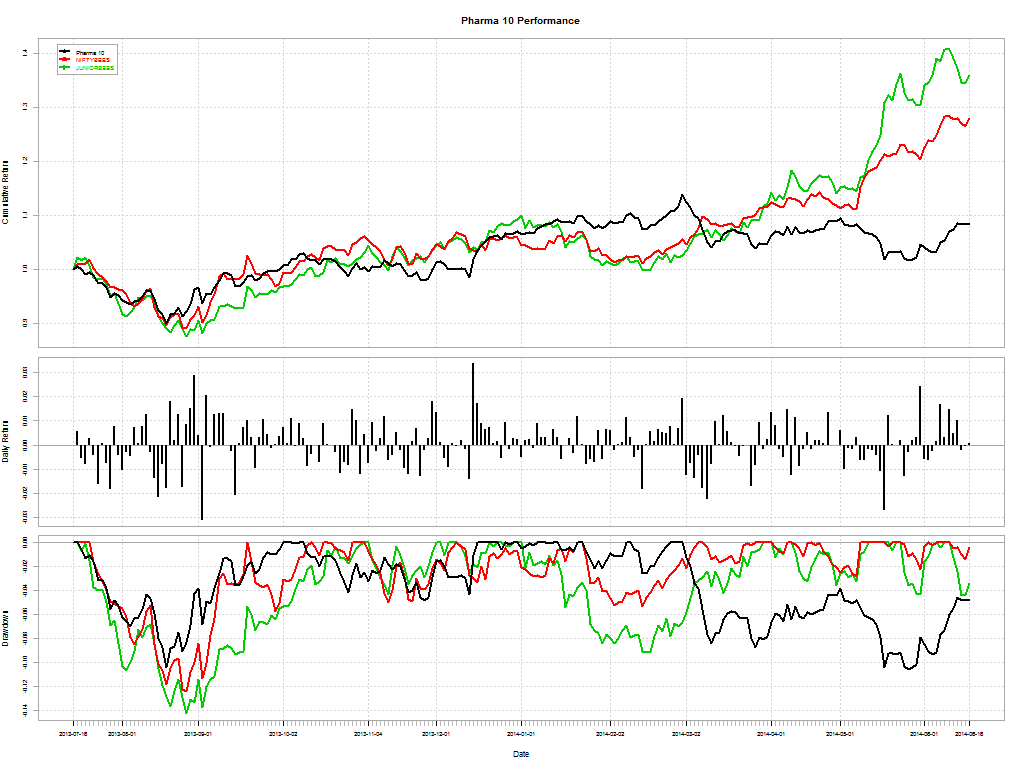
Pharma 10
2013-Jul-17
8.36%
27.88%
35.85%
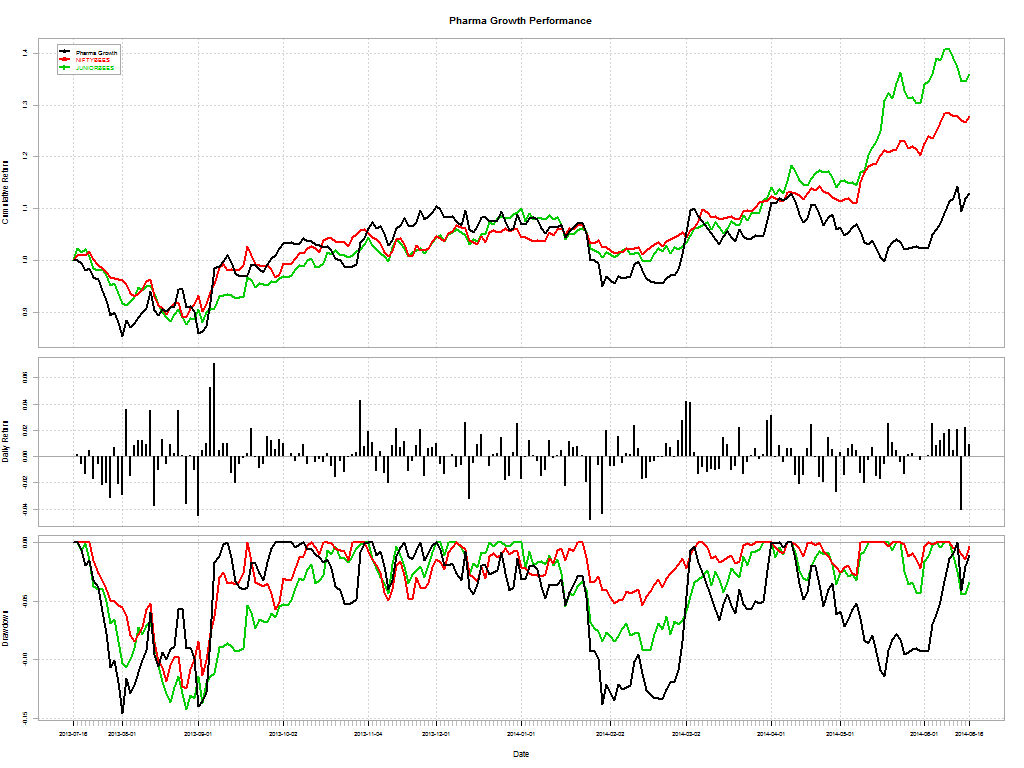
Pharma Growth
2013-Jul-17
13.01%
27.88%
35.85%
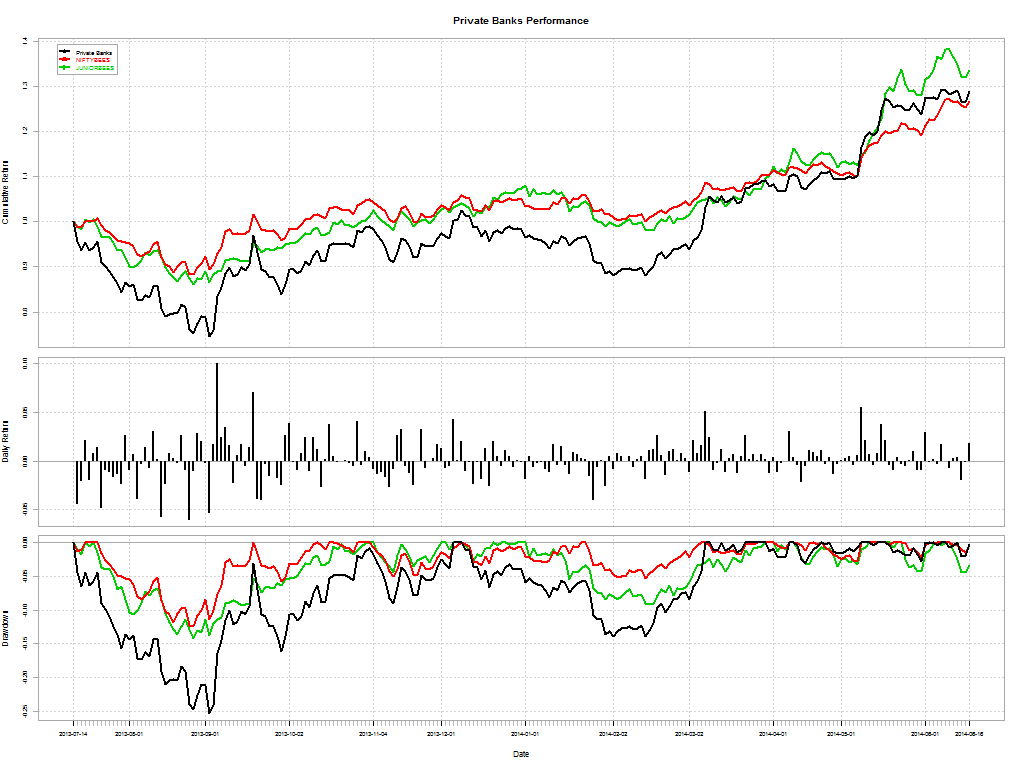
Private Banks
2013-Jul-15
28.82%
26.61%
33.45%
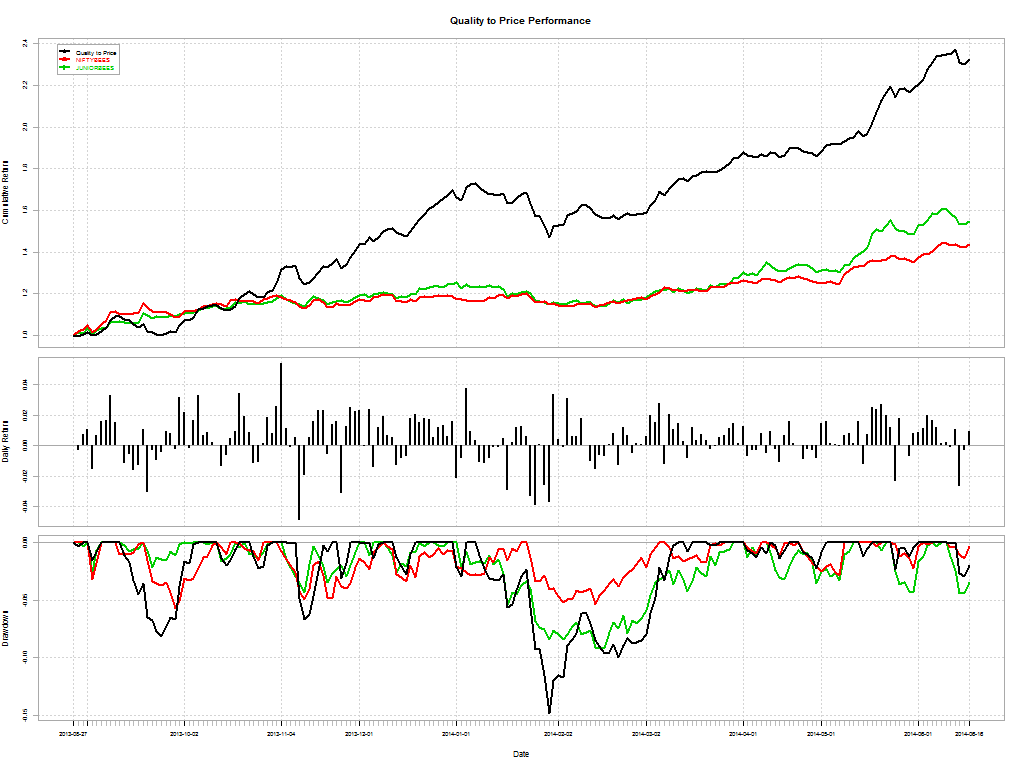
Quality to Price
2013-Aug-28
132.47%
43.5%
54.91%
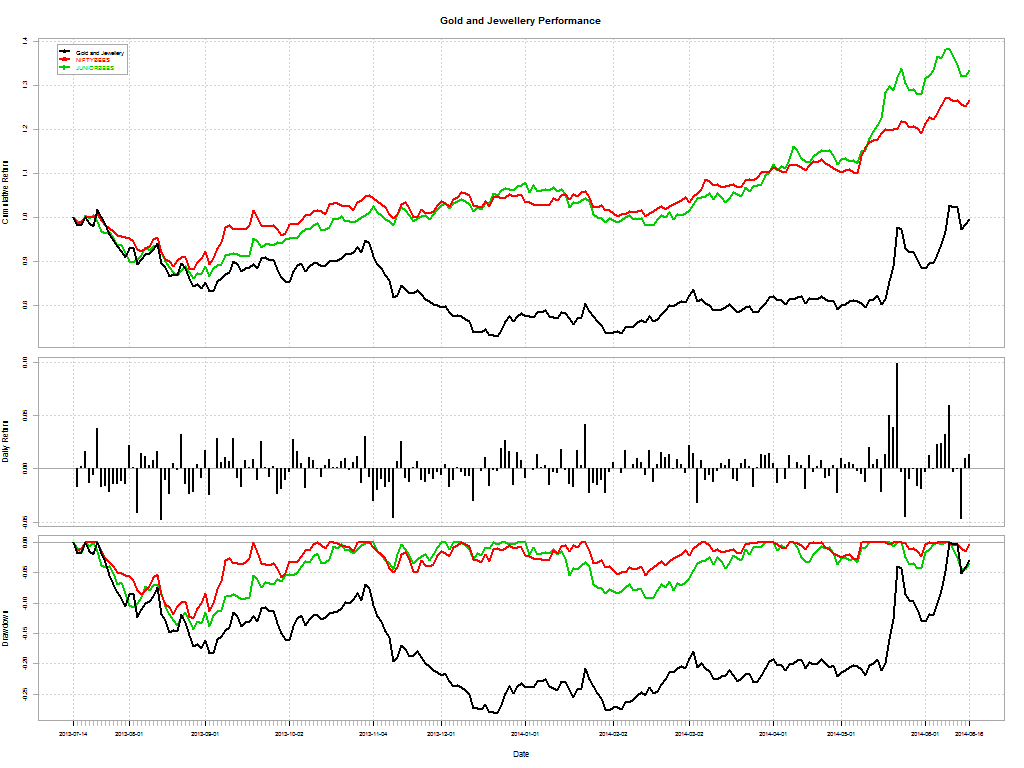
Gold and Jewellery
2013-Jul-15
-0.34%
26.61%
33.45%
Alcohol and Tobacco
2013-Jul-25
8.84%
29.05%
38.35%
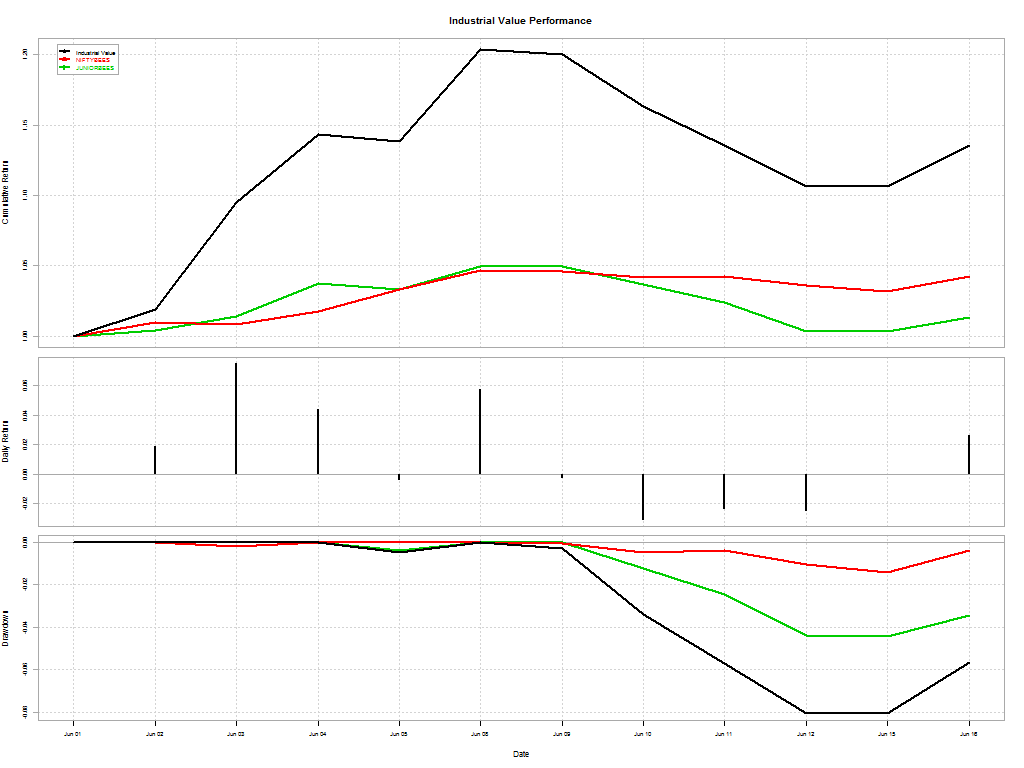
Industrial Value
2014-Jun-02
13.57%
4.27%
1.36%
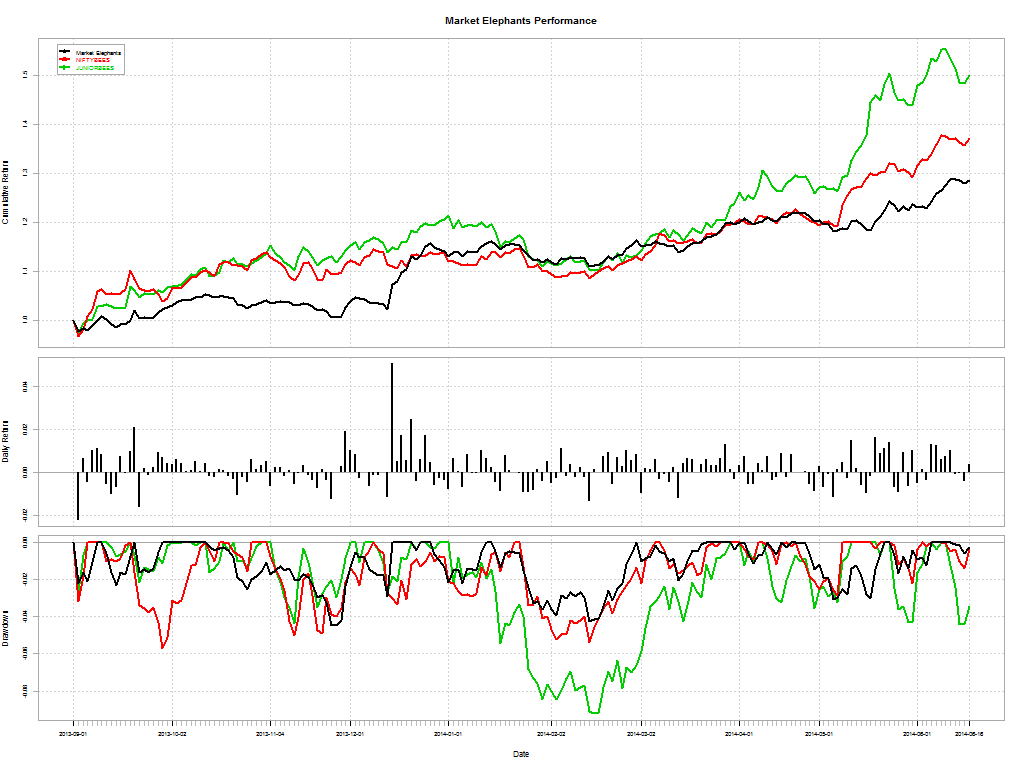
Market Elephants
2013-Sep-02
28.51%
37.15%
49.96%
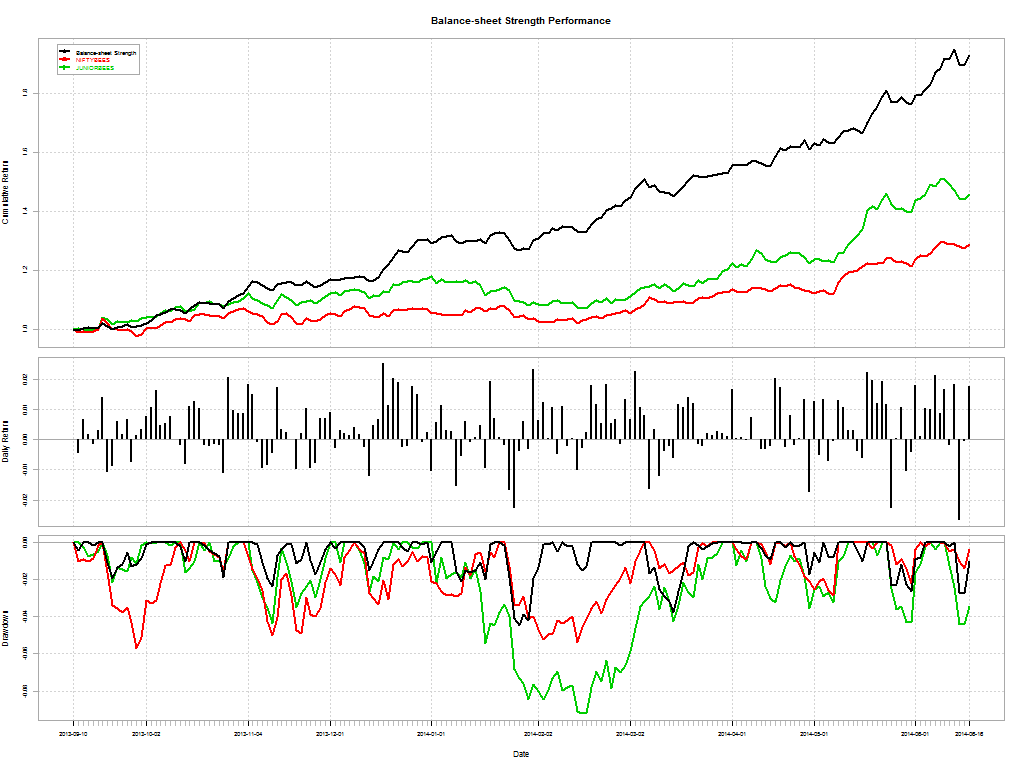
Balance-sheet Strength
2013-Sep-11
93%
28.88%
45.66%
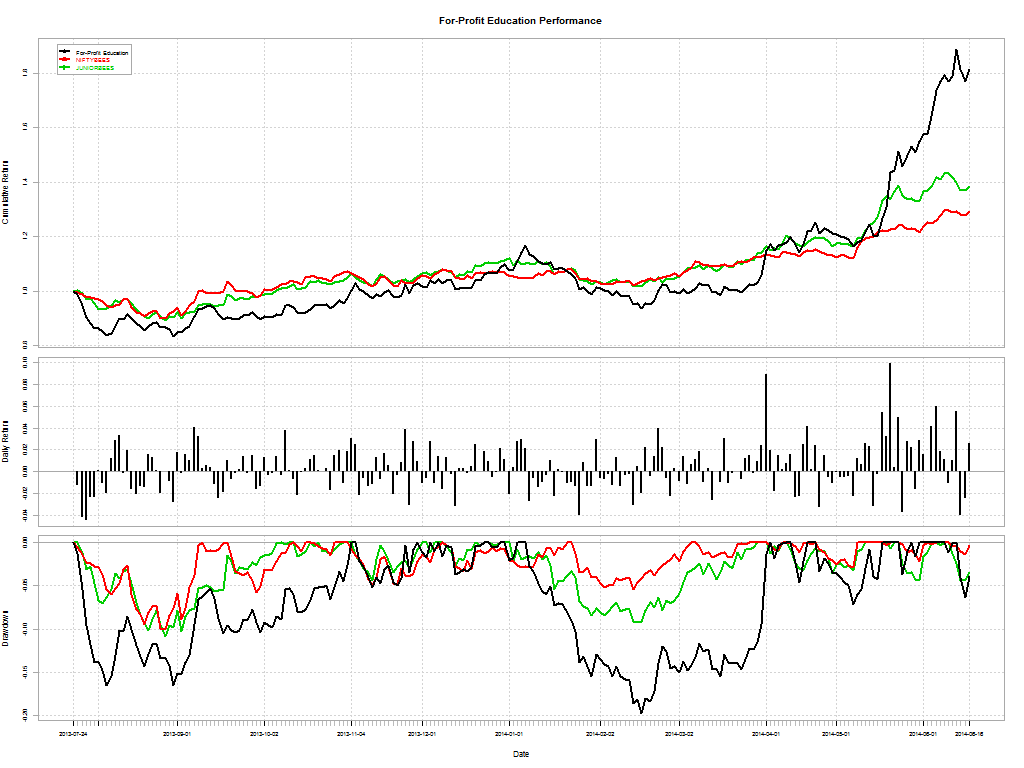
For-Profit Education
2013-Jul-25
81.33%
29.05%
38.35%
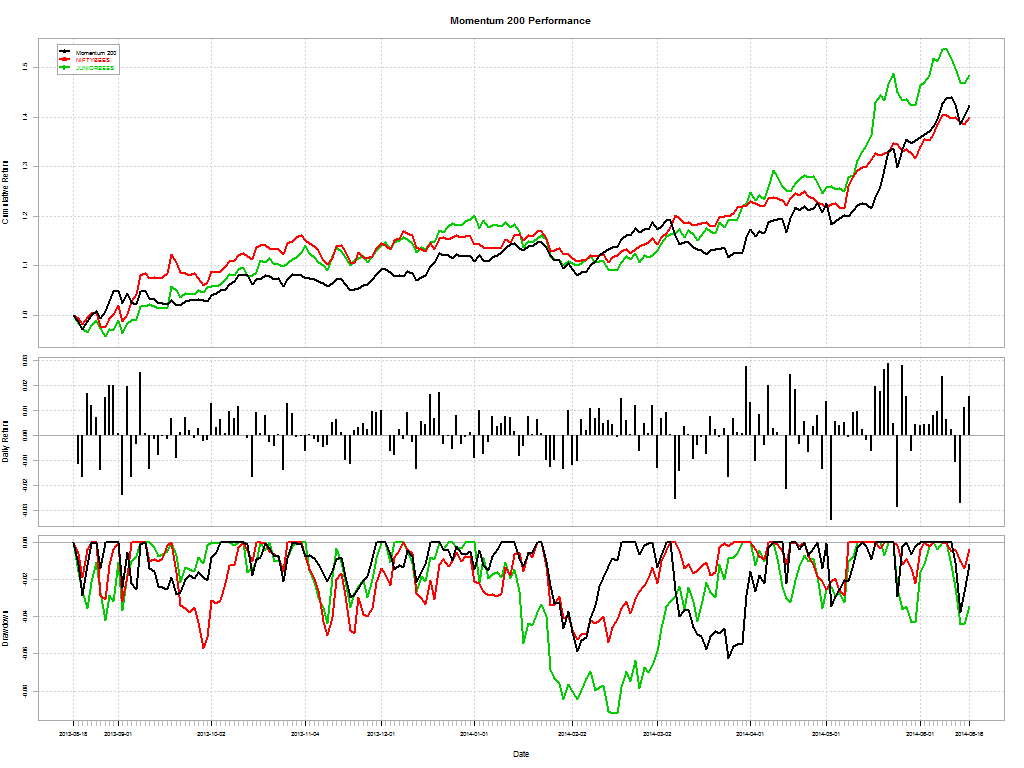
Momentum 200
2013-Aug-19
42.34%
39.89%
48.38%
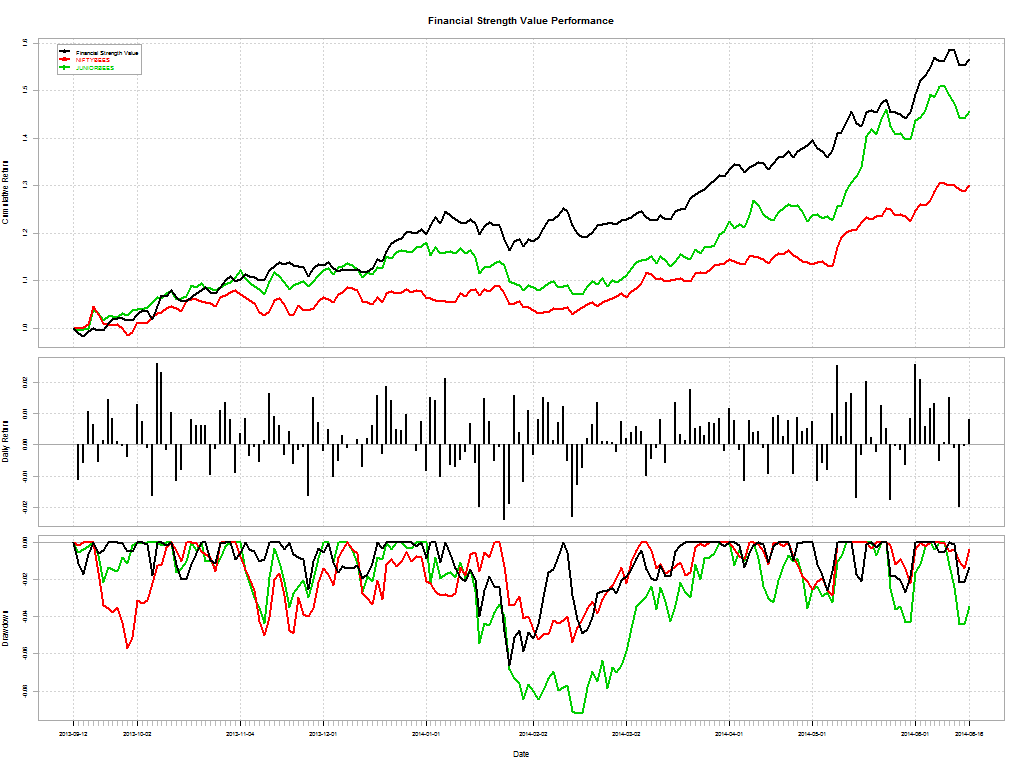
Financial Strength Value
2013-Sep-13
56.54%
30.06%
45.69%

Detail of draw-downs can be found here.

Performance Charts

Gold and Jewellery.2013-07-15.2014-06-17

Private Banks.2013-07-15.2014-06-17

Quality to Price.2013-08-28.2014-06-17

Enterprise Yield.2013-09-16.2014-06-17

Magic Formula Investing.2013-08-19.2014-06-17

Pharma 10.2013-07-17.2014-06-17

Pharma Growth.2013-07-17.2014-06-17

Market Fliers.2013-10-28.2014-06-17

Financial Strength Value.2013-09-13.2014-06-17

Momentum 200.2013-08-19.2014-06-17

Balance-sheet Strength.2013-09-11.2014-06-17

For-Profit Education.2013-07-25.2014-06-17

Industrial Value.2014-06-02.2014-06-17

Market Elephants.2013-09-02.2014-06-17

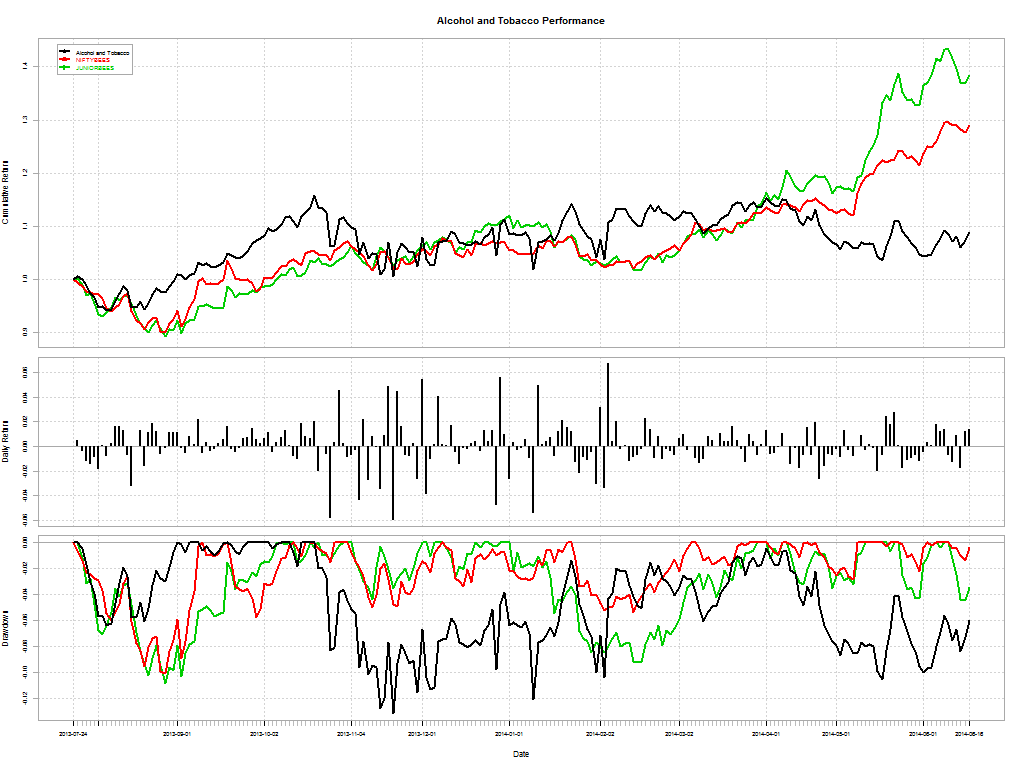
Alcohol and Tobacco.2013-07-25.2014-06-17

WHAT SHOULD I DO NEXT?

You should open a demat account with StockViz and invest through our Themes.
Smart Beta Strategy Return Analysis

The best part about StockViz Investment Themes is that you can setup a portfolio of stocks that follows a particular strategy. It is a convenient way for you to:

  1. stick to a strategy
  2. follow a preset rebalancing schedule
  3. think in terms of your portfolio strategy rather than individual stocks
  4. avoid common behavioral pitfalls
  5. systematically track your P&L and strategy performance

In StockViz, there are two smart-beta themes: Market Fliers tracks a high-volatility and high-beta portfolio while Market Elephants tracks a low-beta portfolio. Between the two strategies and the Nifty, what should an investor prefer?

Daily Returns

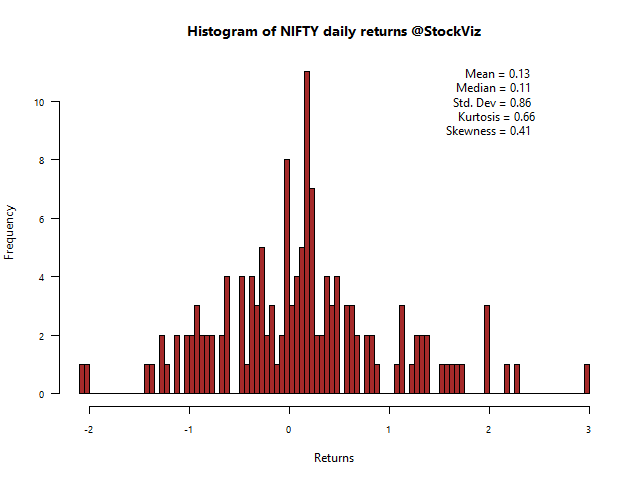
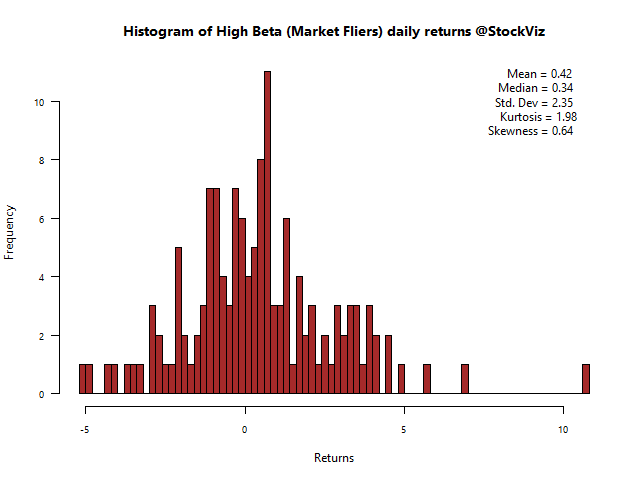
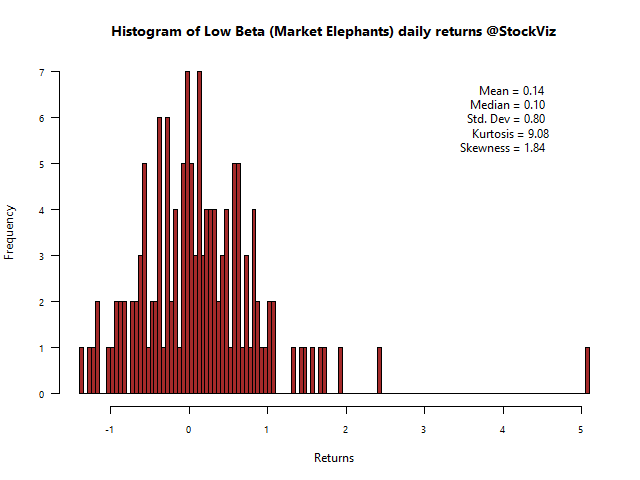
In a bull-market, such as the one we are in, it makes sense to be in a high-beta portfolio. Notice how narrow the low-beta histogram is compared to high-beta, indicating little variation in day-to-day returns. However, you cannot escape the gigantic 10%+ outlier in the Market Fliers.

Nifty

nifty-returns-histogram

High Beta (Market Fliers)

high-beta-returns-histogram

Low Beta (Market Elephants)

low-beta-returns-histogram

Drawdowns

Any investment will have drawdowns: it is the peak-to-trough decline during a specific period. Market fliers had a horrible couple of months in December-Jan where it saw a jaw-dropping 20% draw-down that took 29 days to recover from.

Nifty

From Trough To Depth Length To Trough Recovery
2013-Dec-10 2014-Feb-04 2014-Mar-06 -0.057 61 40 21
2013-Nov-05 2013-Nov-13 2013-Dec-09 -0.0519 24 7 17
2014-Apr-25 2014-May-07 2014-May-09 -0.0275 10 8 2
2014-Apr-11 2014-Apr-16 2014-Apr-21 -0.0178 5 3 2
2014-Apr-03 2014-Apr-04 2014-Apr-09 -0.0086 4 2 2

High Beta (Market Fliers)

From Trough To Depth Length To Trough Recovery
2013-Dec-09 2014-Feb-12 2014-Mar-27 -0.1955 75 46 29
2013-Nov-05 2013-Nov-12 2013-Dec-08 -0.1083 22 5 17
2014-Apr-10 2014-Apr-15 2014-May-11 -0.0751 18 3 15
2014-Apr-02 2014-Apr-02 2014-Apr-08 -0.0215 4 1 3
2014-Mar-31 2014-Mar-31 2014-Apr-01 -0.0092 2 1 1

Low Beta (Market Elephants)

From Trough To Depth Length To Trough Recovery
2014-Jan-15 2014-Feb-12 2014-Feb-27 -0.0427 31 21 10
2013-Nov-04 2013-Nov-25 2013-Dec-02 -0.0338 19 14 5
2014-Apr-24 2014-May-06 2014-May-21 -0.0309 19 8 11
2013-Dec-03 2013-Dec-12 2013-Dec-15 -0.024 8 7 1
2013-Dec-29 2014-Jan-06 2014-Jan-13 -0.0219 12 7 5

Performance

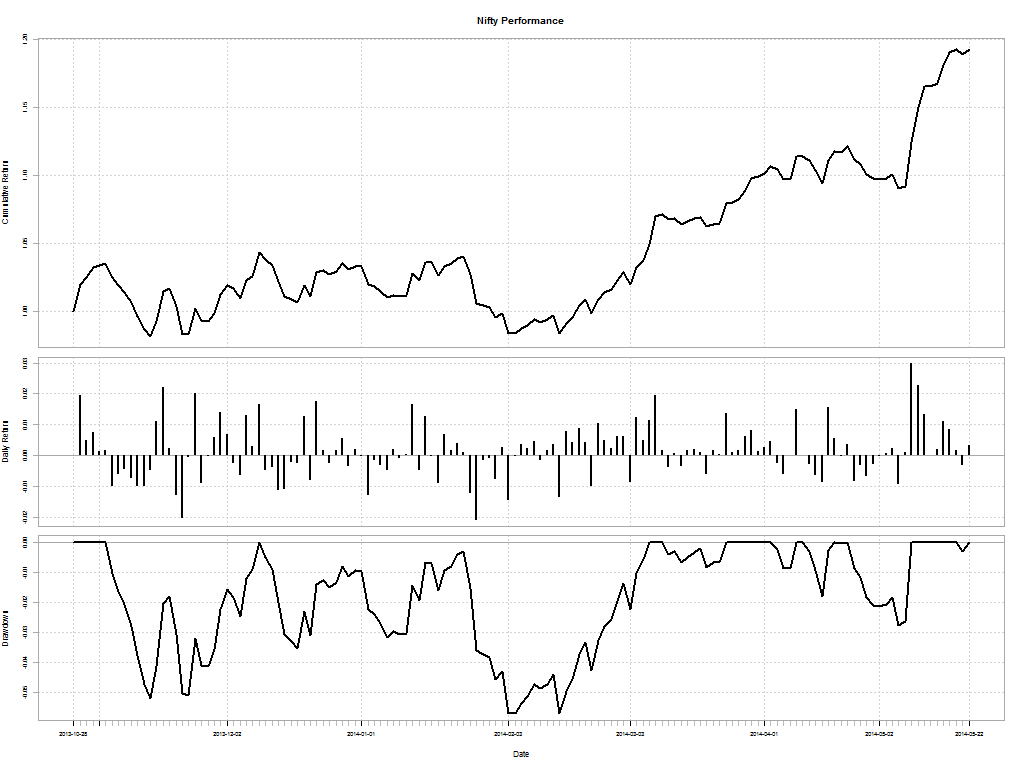
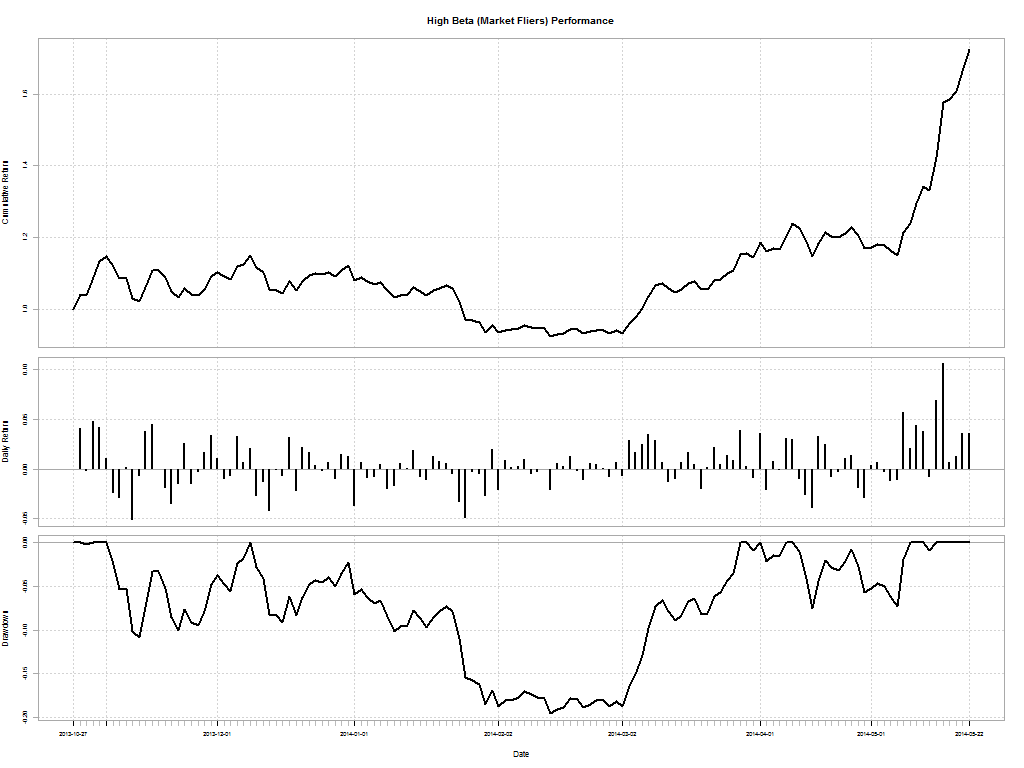
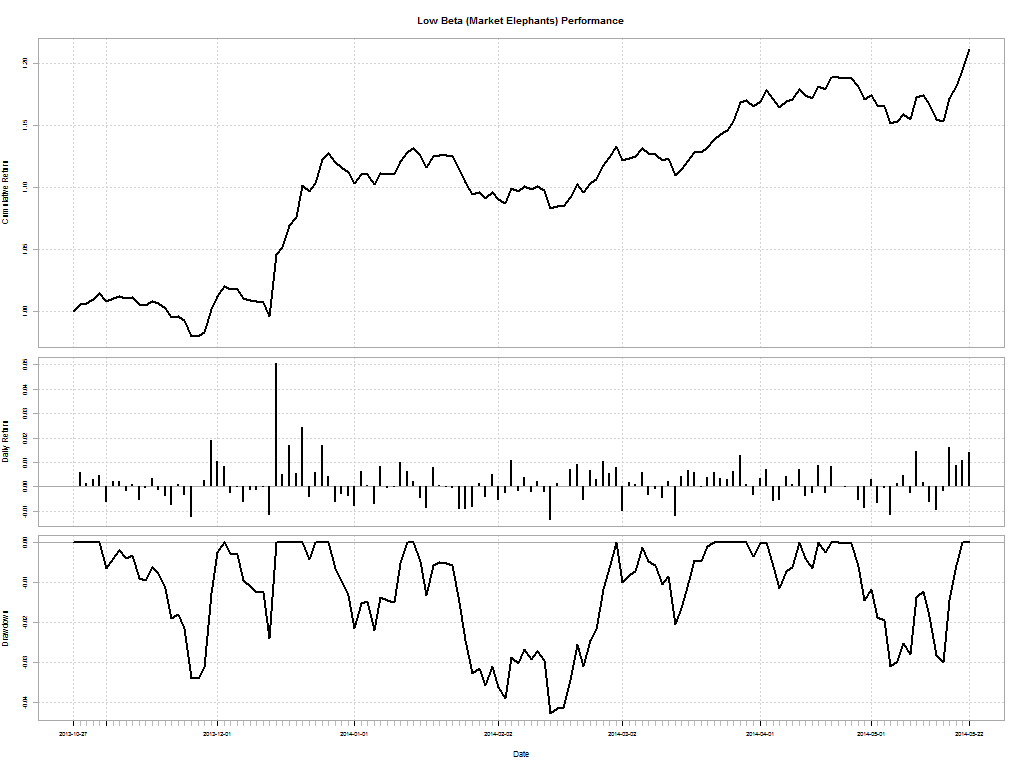
The wealth chart for market filers is basically a parabola at this point. During the period, the Nifty clocked in +19.26%, Market Fliers +72.42% and Market Elephants +21.16%

Nifty

nifty-returns

High Beta (Market Fliers)

high-beta-returns

Low Beta (Market Elephants)

low-beta-returns

Performance vs. Drawdown

How do you tell if these Themes are better than the Nifty? One way to measure relative performance is through the Calmar ratio and the Sterling ratio.

The Calmar ratio is a comparison of the average annual compounded rate of return and the maximum drawdown risk. The lower the Calmar Ratio, the worse the investment performed on a risk-adjusted basis over the specified time period; the higher the Calmar Ratio, the better it performed.

The Sterling ratio = Compounded Annual Return ÷ (Avg. Max Drawdown – 10%)

Just like the Calmar ratio, a higher Sterling ratio is generally better because it means that the investment is receiving a higher return relative to risk.

Calmar Ratio Sterling Ratio
Nifty 6.487609 2.35644
Market Fliers 8.720311 5.768798
Market Elephants 9.828884 2.942523

As you can see, smart beta strategies beat the Nifty both in absolute returns and in risk.


Note: The analysis starts from 2013-Oct-28.


Investment Theme Performance Roundup

WHAT IS A “THEME””?

A StockViz Investment Theme is a portfolio of stocks that follows a particular strategy. It is a convenient way for you to:

  1. stick to a strategy
  2. follow a preset rebalancing schedule
  3. think in terms of your portfolio strategy rather than individual stocks
  4. avoid common behavioral pitfalls
  5. systematically track your P&L and strategy performance

WHAT IS AN INVESTMENT STRATEGY?

An investment strategy is a specific way of going about the process of investing. It identifies specific variables that define a stock. Variables can be anything: risk, style, sector, balance-sheet items, etc..

We also have themes based on what other brokers have recommended at different points in time.

By mapping specific Themes to your account, you ensure that you stay pure to your strategy allocation. And that there is no “flying by the seat of your pants” investing.

How have your themes performed?

Since March 3rd this year, here’s how they have performed:

It was a time when both high-beta and value performed nicely. Velocity, one of our momentum themes, got walloped because it was tech and pharma heavy.

Previous performance roundup can be found here.

How have other brokers performend?

Since March 3rd this year, here’s how they have performed:

What if I had just invested in ETFs?

PSUBNKBEES +41.41%
BANKBEES +28.06%
INFRABEES +23.61%
JUNIORBEES +13.08%
NIFTYBEES +10.07%
GOLDBEES -3.42%
PSU banks – you can hate them all you want, but this was one heck of a recovery trade. What is surprising is that most themes ended up beating the Nifty and the Jr. Nifty ETFs.

WHAT SHOULD I DO NEXT?

You should open a demat account with StockViz and invest through our Themes.
Charting Theme Performance

Quality to Price

A StockViz Investment Theme is a portfolio of stocks that follows a particular strategy. It is a specific way of going about the process of investing. It identifies specific variables that define an equity portfolio like risk, style, sector, balance-sheet items, etc… and by mapping specific Themes to your account, you ensure that you stay pure to your strategy allocation.

We now have sufficient performance data for us to chart Theme performance across different holding periods. For example, the chart above shows what Rs.100 invested in the Quality to Price Theme would be worth if the investment was made (from right-to-left) 5 days ago, 10 days ago, 20 days ago, etc…

You can explore more themes and their performance in detail here.
 

Investment Theme Performance Roundup

What is a “Theme”?

A StockViz Investment Theme is a portfolio of stocks that follows a particular strategy. It is a convenient way for you to:

  1. stick to a strategy
  2. follow a preset rebalancing schedule
  3. think in terms of your portfolio strategy rather than individual stocks
  4. avoid common behavioral pitfalls
  5. systematically track your P&L and strategy performance

What is an investment strategy?

An investment strategy is a specific way of going about the process of investing. It identifies specific variables that define a stock. Variables can be anything: risk, style, sector, balance-sheet items, etc..

By mapping specific Themes to your account, you ensure that you stay pure to your strategy allocation. And that there is no “flying by the seat of your pants” investing.

How have Investment Themes performed?

Splendidly. Here’s a roundup:

Theme Inception Date Returns (%) Annualized Returns(%)
Quality to Price 2013-08-28 57.99 116.31
Balance-sheet Strength 2013-09-11 41.75 90.7
Growth with Moat 2013-08-05 22.2 39.54
Financial Strength Value 2013-09-13 21.72 47.76
IT 3rd Benchers 2013-11-06 18.95 61.77
Velocity 2013-11-12 18.21 62.73
Momentum 200 2013-08-19 17.39 33.23
Market Elephants 2013-09-02 15.32 31.61
Magic Formula Investing 2013-08-19 15.06 28.78
Efficient Growth 2013-08-05 11.19 19.93
Enterprise Yield 2013-09-16 10.27 23.01
Consistent10 2013-11-18 9.82 35.87
Long Term Equity 2013-11-18 7.81 28.5
ADAG Mania 2013-07-25 4.44 7.51
Market Fliers 2013-10-28 -6.67 -20.12

What should I do next?

You should open a demat account with StockViz and invest through our Themes.