Tag: theme

India Hedge funds under-perform a simple Momentum strategy

Long/short equity funds, which make up a bulk of the India-specific funds, are up 47% year-to-date.

LiveMint recently ran an article, “India hedge funds outperform, but investors remain sceptical.” (link)

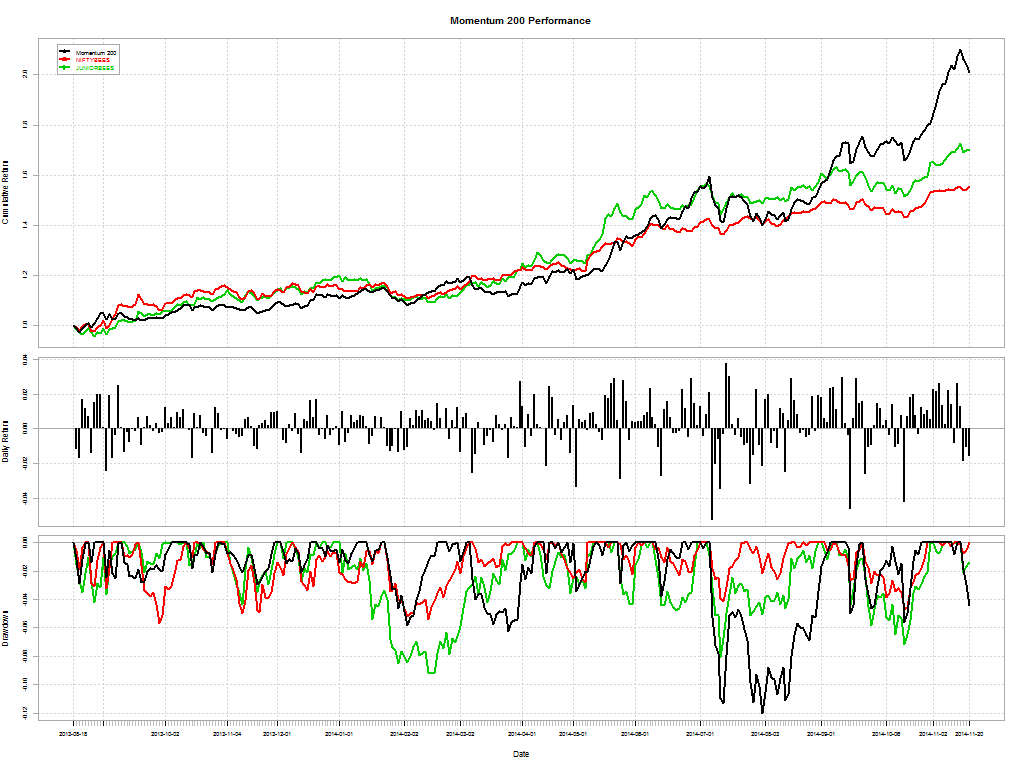
I don’t have access to the report quoted in the article and I am not sure if the returns are after fees and profit-sharing. But what is surprising is that these funds under-performed a basic, un-levered, momentum strategy. In the same period, our Momentum 200 Theme is up 61.54% and you can take all of it to the bank.

If you are charging 2 and 20, you should do better. Besides, most of them haven’t been through a down-cycle. And yes, Momentum will totally get crushed in a down-cycle, but at least investors know what they are getting into. For all you know, hedge funds, being the black-boxes that they are, could be just long momentum.

Turns out investor skepticism is warranted after all.
momentum.performance

Fly or Die: Last Year’s Diwali Picks

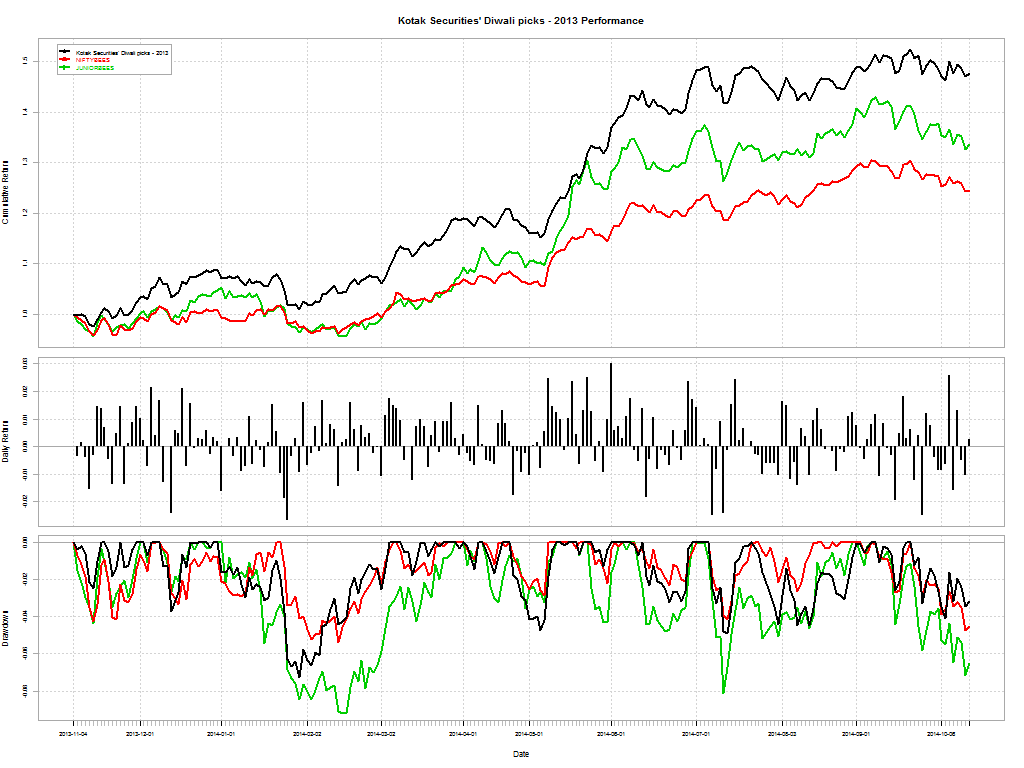
It is that time of the year again when brokerage houses try and pick stocks for “muhurat trading.” Let’s see how they fared with their 2013 picks. NIFTY is up +27% since last Diwali.

Kotak Securities

Kotak picked 11 stocks that returned about +50%. Sharpe: 0.16732

kotak's 2013 Diwali picks

Microsec

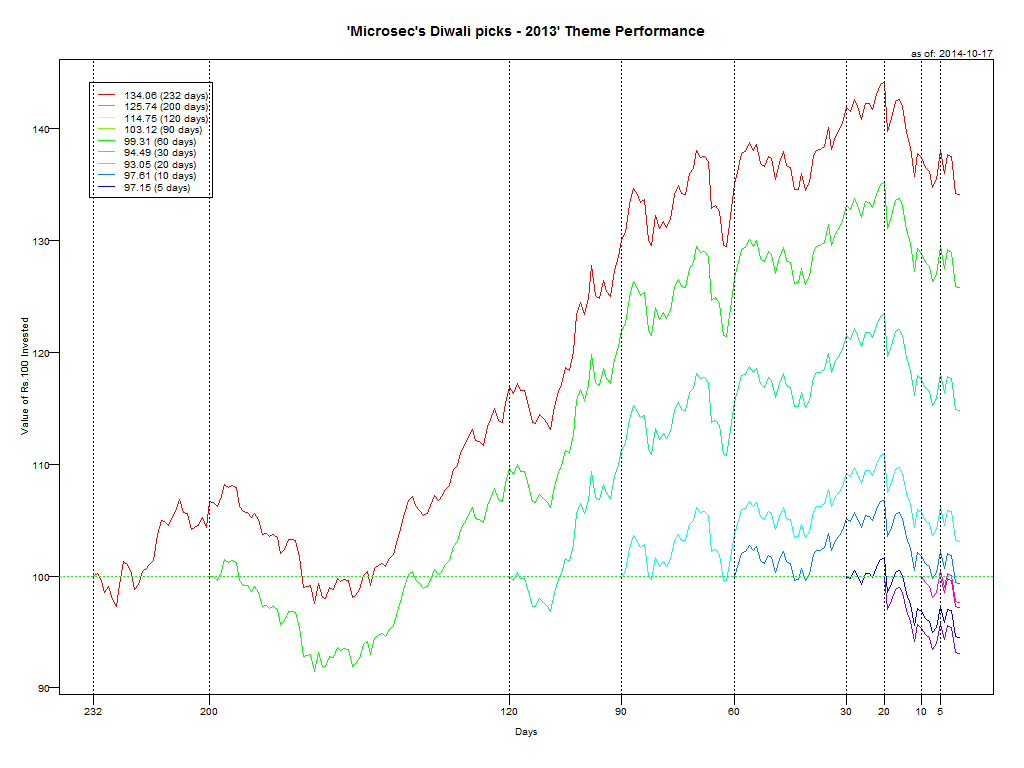
Microsec picked 9 stocks that returned about +37%. Sharpe: 0.12822; but their portfolio has been pummeled lately.

microsec's 2013 Diwali picks

Globe

Globe’s 10 stocks returned about +37% but with a much lower Sharpe (0.11445) compared to Kotak and Microsec. It hit its peak sometime in July and its been sliding since then.

globe's 2013 Diwali Picks

Prabhudas Lilladher

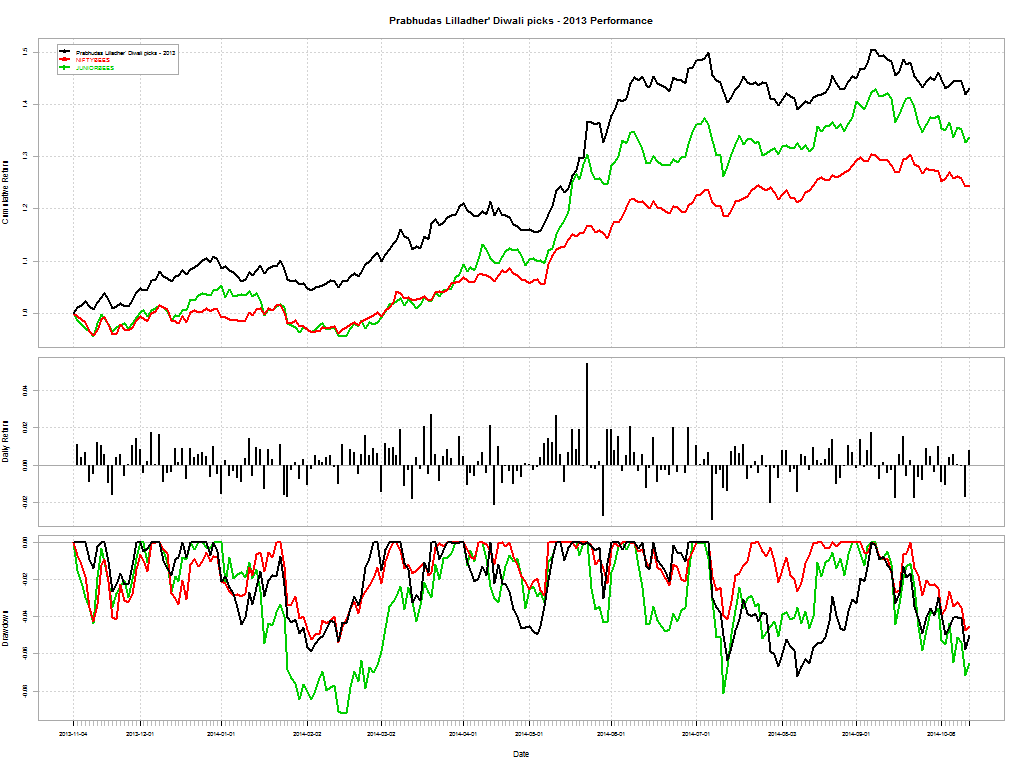
Prabhudas Lilladher picked 4 stocks. Got to admire their courage here. +45% since Diwali, Sharpe: 0.15509.

Prabhudas Lilladher's 2013 Diwali stock picks

2014 Picks

We have created new themes to track brokers’ 2014 Diwali picks. Kotak, Globe and ET have published their recommendations so far.

You can find all Broker Recommendations here.

Decisions Under Uncertainty

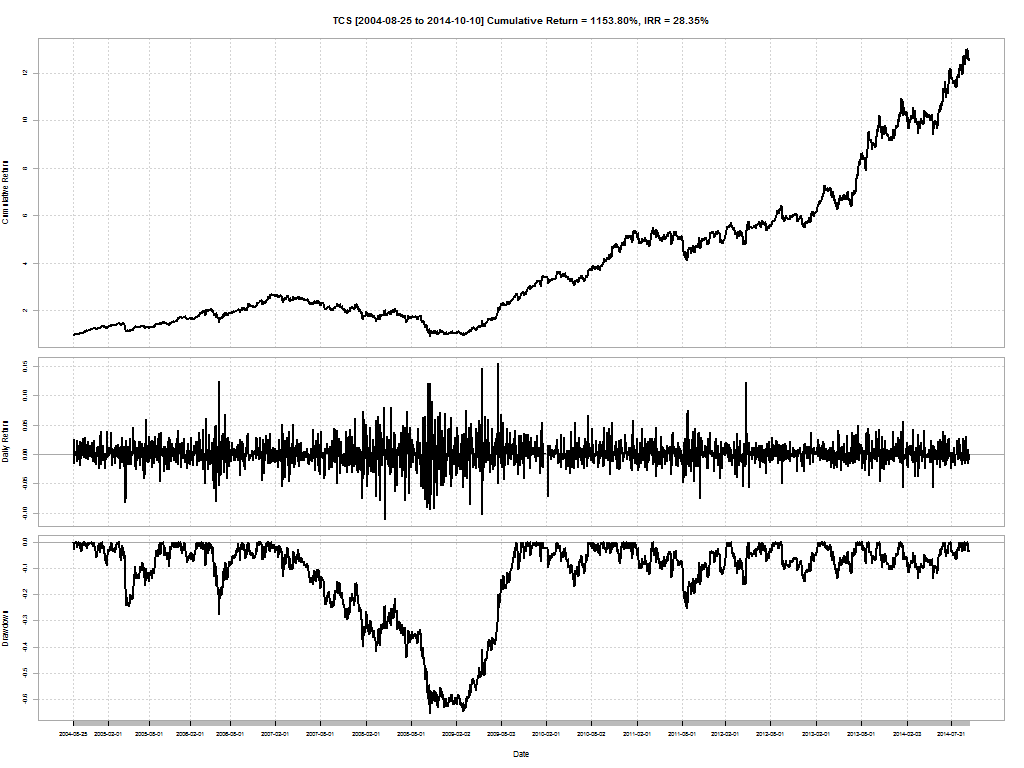
TCS has been a tremendous wealth creator. Between 2004-8-25 and now, its has turned in a cumulative return of 1164% with an IRR of 28.35% during that period. So you should just “buy right and sit tight”, yeah?

TCS.performance

But before you hang that on your wall, let me take you back to Jan 2007. TCS started sliding on global worries and did stop until losing 65.52% of its value. It took 458 days to make a bottom and another 249 days to climb back up from it. If you think the meltdown in 2007/8 was a once-in-a-lifetime affair, then let me point out that the second worst drawdown for TCS was 27.40% back in 2006. And before that, 24% in 2005.

tcs drawdown

In my experience, 99% of the investors out there would have dumped the stock. That 28.35% IRR is wishful thinking for most investors because not only would they have dumped the stock at maximum pain (peak drawdown) but they would have failed to get back into the stock as well.

But does this mean you should never sell a stock? Have a look at Reliance Infrastructure as a counter example.

RELINFRA.performance

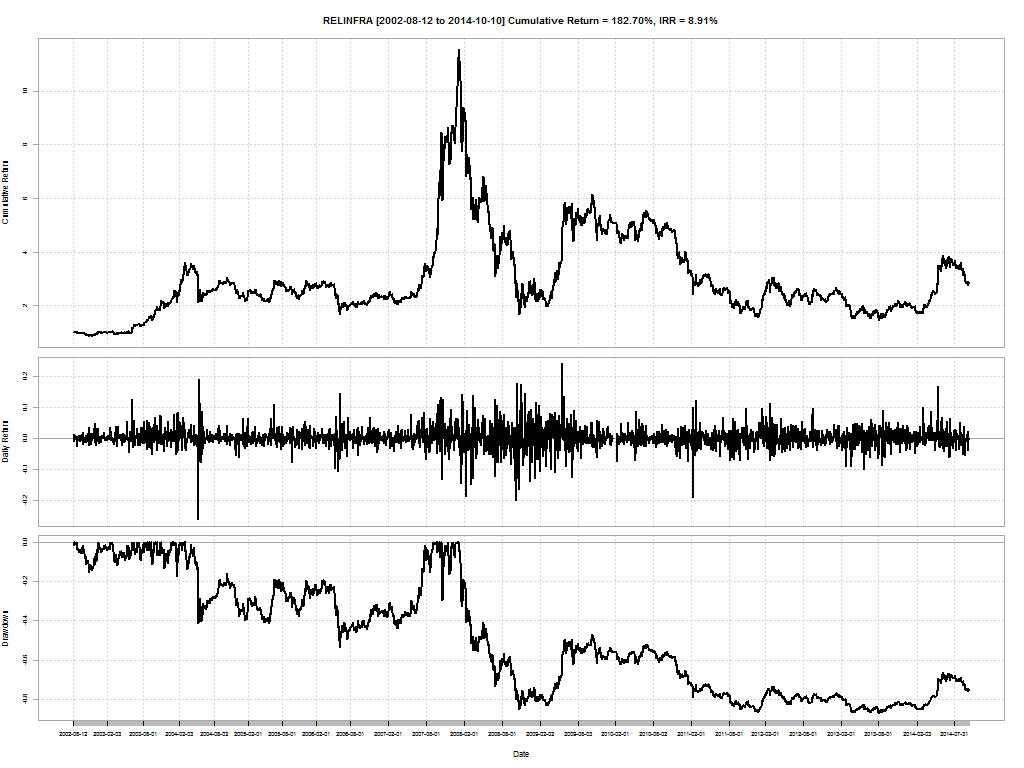
It is yet to recover from the 87% drawdown in 2008! It has been a value destroyer since early 2008.

relinfra drawdown

So does this mean that you should have a “stop loss”? How should you manage whiplash? How do you keep track of all the reasons you bought a stock and if it still fits that criteria? If you sell a stock, what do you replace it with?

The key to making decisions under uncertainty is to have a process. A process that

  1. identifies investment opportunities based on pre-selected parameters (value, momentum, factor, beta, etc…),
  2. has a set holding period, based on the intricacies from (a) and current market conditions, and
  3. forces stocks out of the portfolio based on (a) and (b)

This where StockViz Themes come into the picture. Themes are technology wrappers around different investment strategies that make it convenient for investors to follow a process.

To know what combinations of Themes are right for your risk appetite and investment horizon, get in touch with us now!

Using SMA to Reduce Volatility of Returns

Introduction

We saw how a CNX 100 50-day tactical investment strategy boosts returns of a naive buy-and-hold strategy (here) even while considering trading costs and other friction (here.) To visualize how this works, lets have a look at the histogram of daily returns since 2010 (1150 trading days.)

Naive buy-and-hold

bh-returns-2010
Daily Returns
<= -2%
36 days
<= -1%
165 days
>= +2%
41 days
>= +1%
188 days
Average
+0.04%
Std. Dev.
1.07

200-day SMA switch

200-sma-returns-2010
Daily Returns
<= -2%
16 days
<= -2%
85 days
>= +2%
21 days
>= +1%
122 days
Average
+0.07%
Std. Dev.
0.79

100-day SMA switch

100-sma-returns-2010
Daily Returns
<= -2%
11 days
<= -2%
66 days
>= +2%
21 days
>= +1%
114 days
Average
+0.09%
Std. Dev.
0.74

50-day SMA switch

50-sma-returns-2010
Daily Returns
<= -2%
7 days
<= -2%
53 days
>= +2%
24 days
>= +1%
110 days
Average
+0.11%
Std. Dev.
0.71

Conclusion

Even after considering trading costs, impact costs and tracking error, this strategy comes out way ahead of a naive buy-and-hold strategy. Better returns than buy-and-hold with lower volatility and at a low cost!

You can follow the Theme here.

50-Day SMA CNX 100 with Friction

There is always friction

One of our readers made a very astute observation yesterday:

comment

It is true that every strategy has friction. Friction in terms of trading costs, tracking error, whiplash, etc. So we put the 50-Day SMA CNX 100 that we discussed yesterday through the wringer to see what happens in the real world.

Modeling friction

We charge a pretty low brokerage of 0.2%. A two way buy and sell would cost 0.4%. Impact cost is probably 0.2%. For a total of 0.6% in friction. Lets round it up to 1% to give us a margin of comfort.

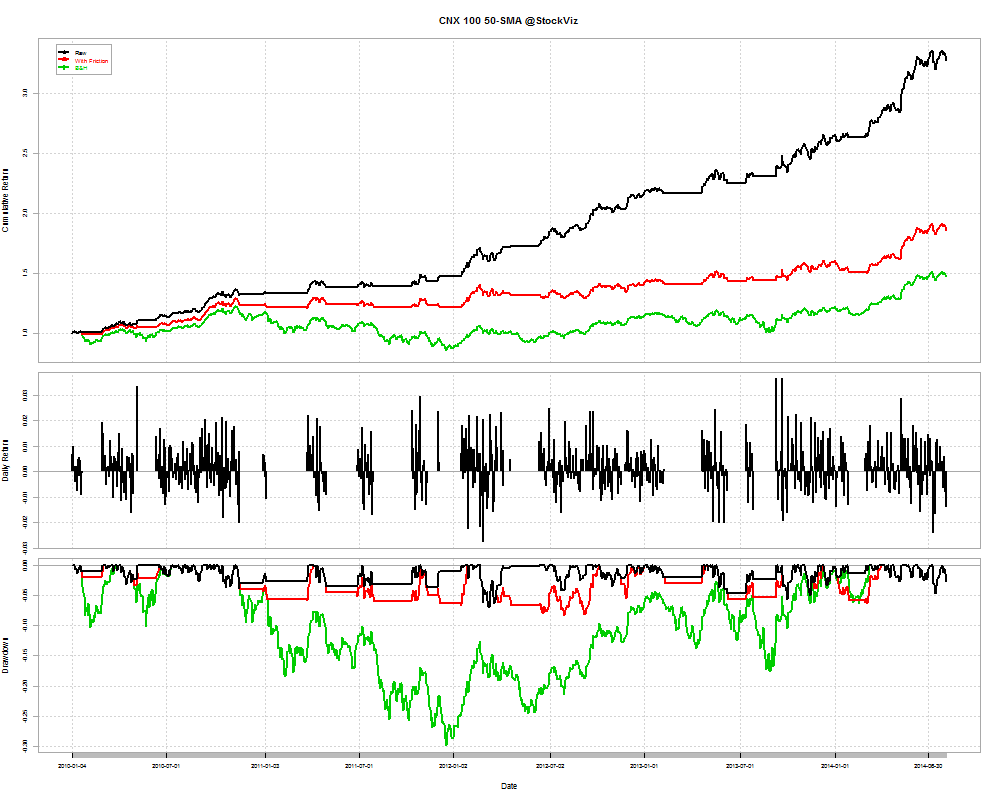
Whenever a trade happens, we will deduct 1% from the notional amount to account for this friction. From the start of 2010 to now, there were 1146 trading days, out of which, the strategy would have resulted in trades for 56 of them. Now lets compare the Raw 50-day CNX 100 with the Buy-and-Hold (B&H) and Friction scenarios.

CNX 100-friction-returns-2010

The investor still comes out as a winner with a cumulative return of 0.86 vs. 0.47 in buy-and-hold.

Accounting for tracking error

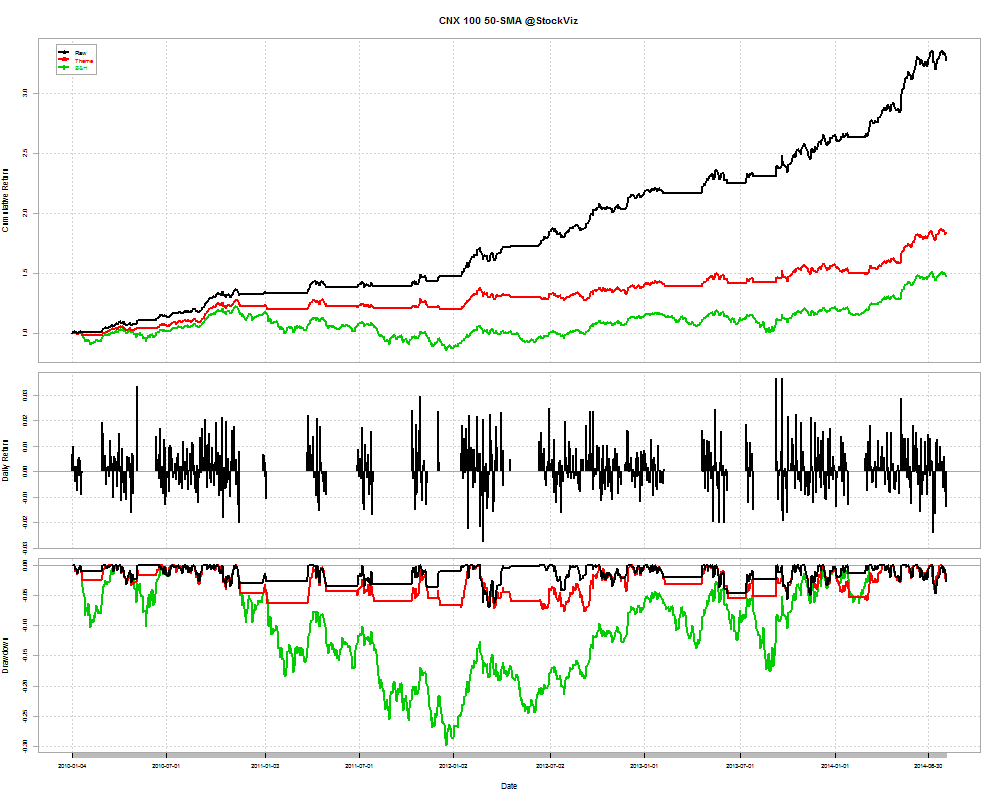
The above analysis used the CNX 100 index to model friction. However, in the real world, you cannot own fractional shares. This gives rise to tracking error. What would the numbers look like if we used the ETFs themselves?

CNX 100-etf-returns-2010

The investor still comes out as a winner with a cumulative return of 0.84.

Conclusion

Even after considering trading costs, impact costs and tracking error, this strategy comes out way ahead of a naive buy-and-hold strategy.

You can follow the Theme here.