Tag: momentum

Index Update 23.05.2015

MOMENTUM

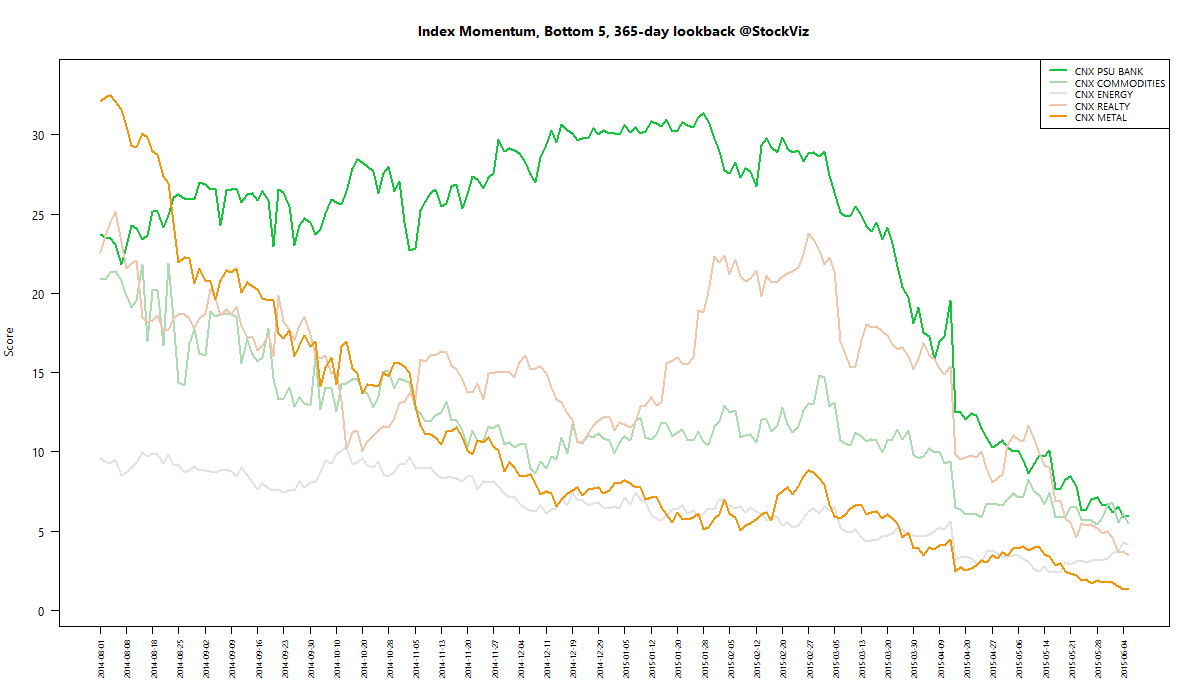
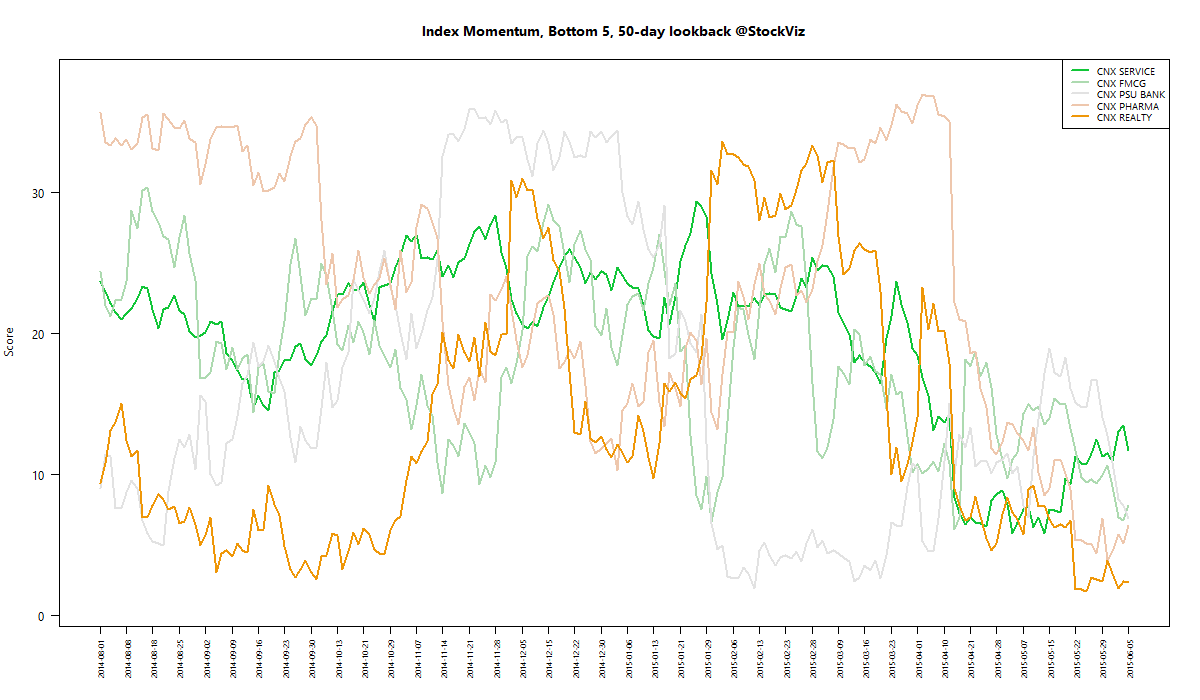
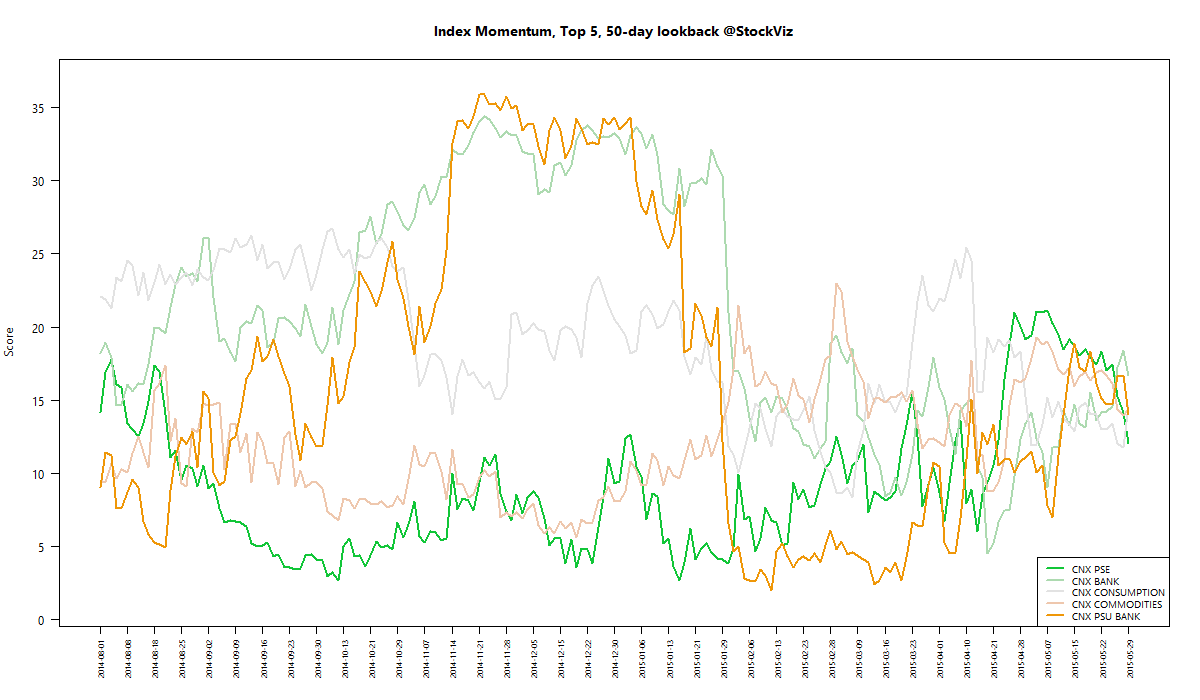
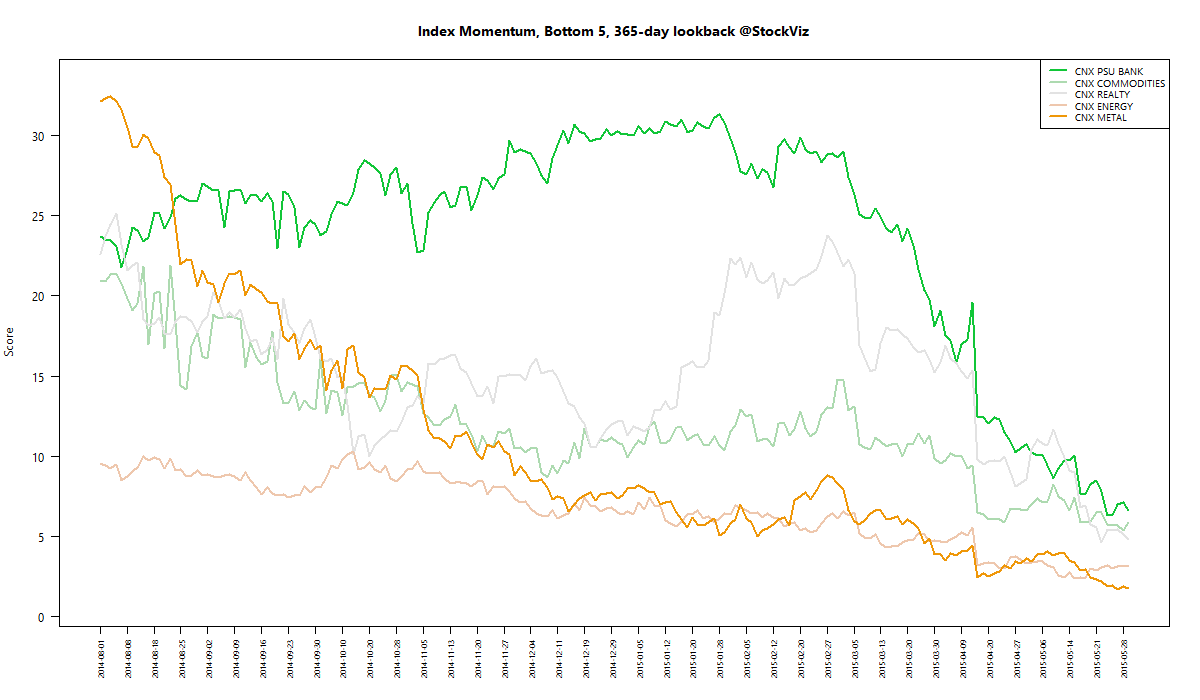
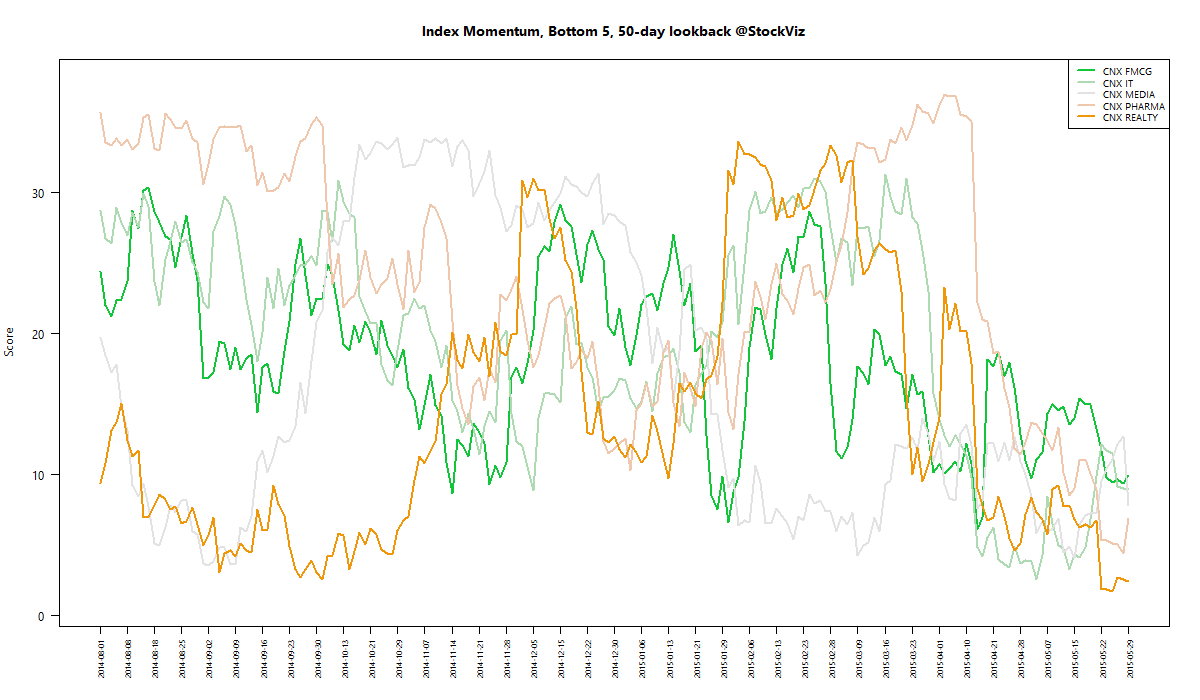
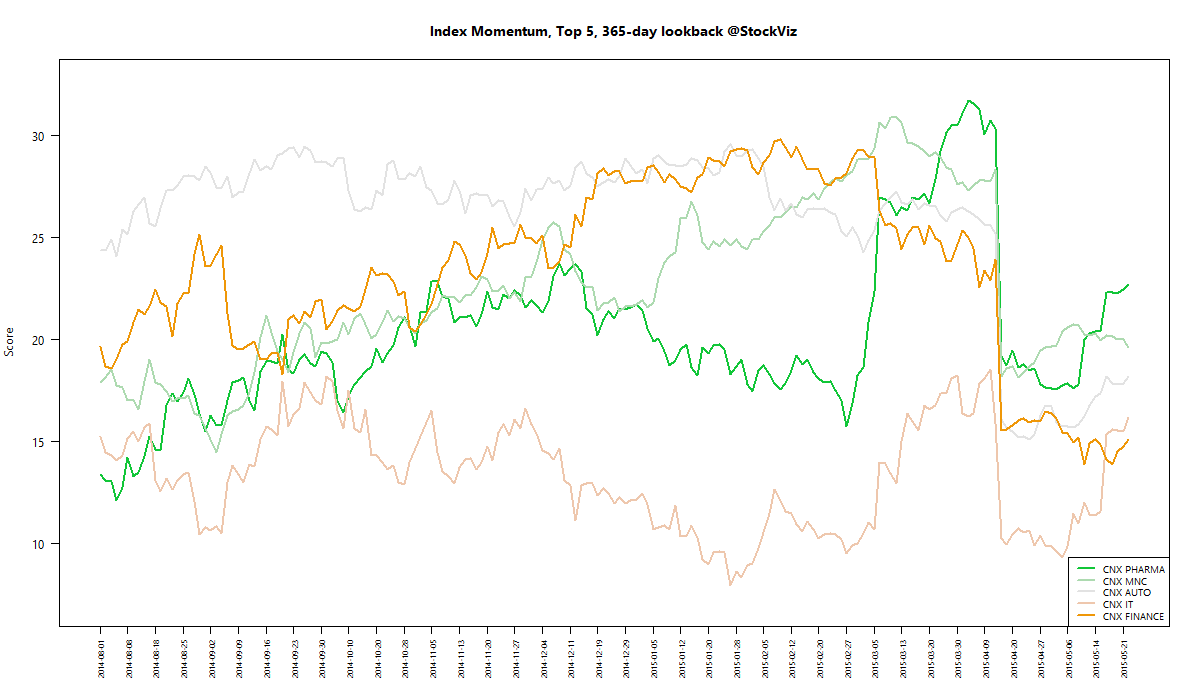
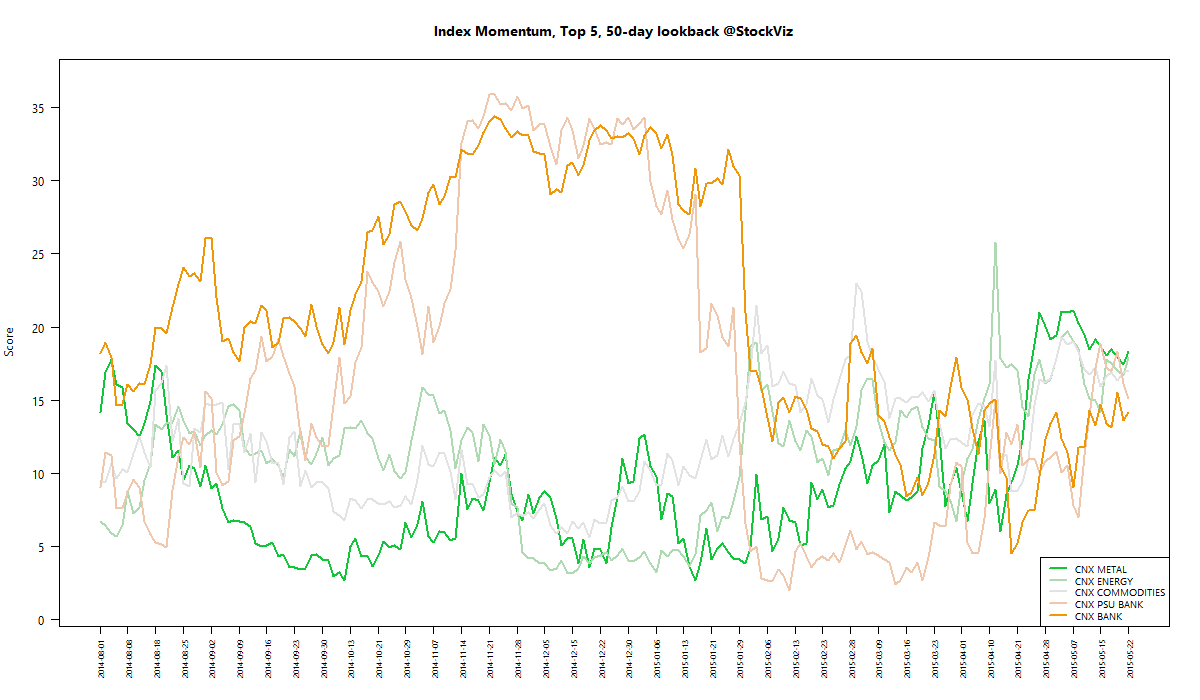
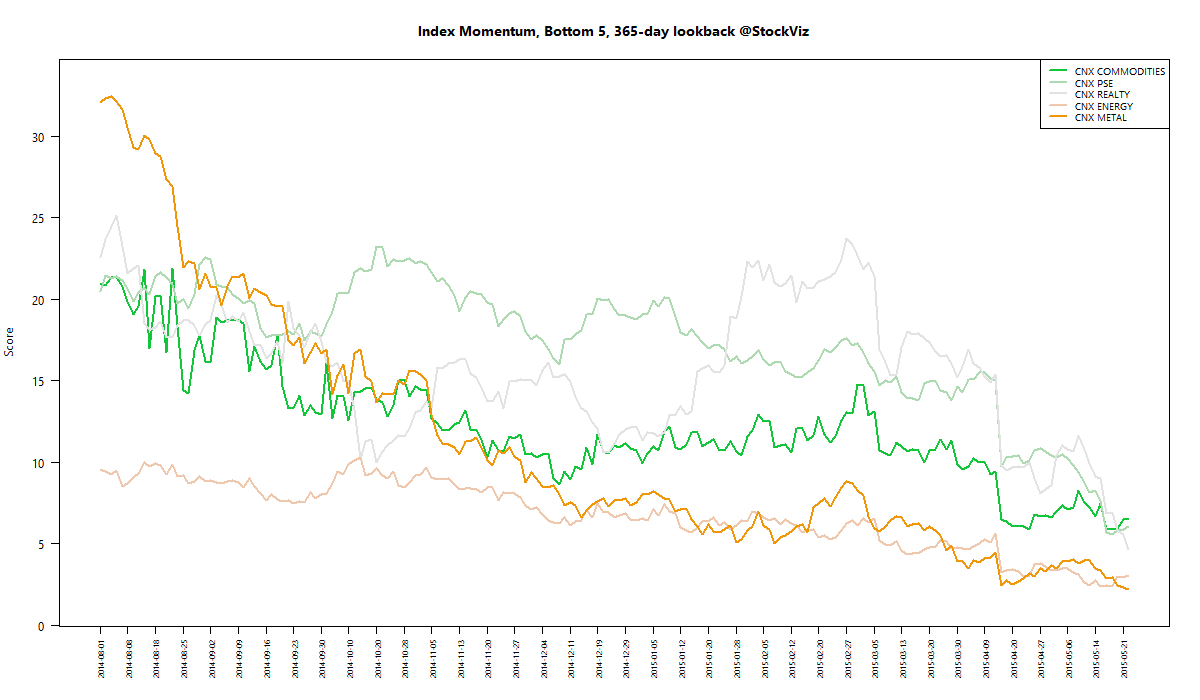
We run our proprietary momentum scoring algorithm on indices just like we do on stocks. You can use the momentum scores of sub-indices to get a sense for which sectors have the wind on their backs and those that are facing headwinds.

Traders can pick their longs in sectors with high short-term momentum and their shorts in sectors with low momentum. Investors can use the longer lookback scores to position themselves using our re-factored index Themes.

You can see how the momentum algorithm has performed on individual stocks here.

Here are the best and the worst sub-indices:
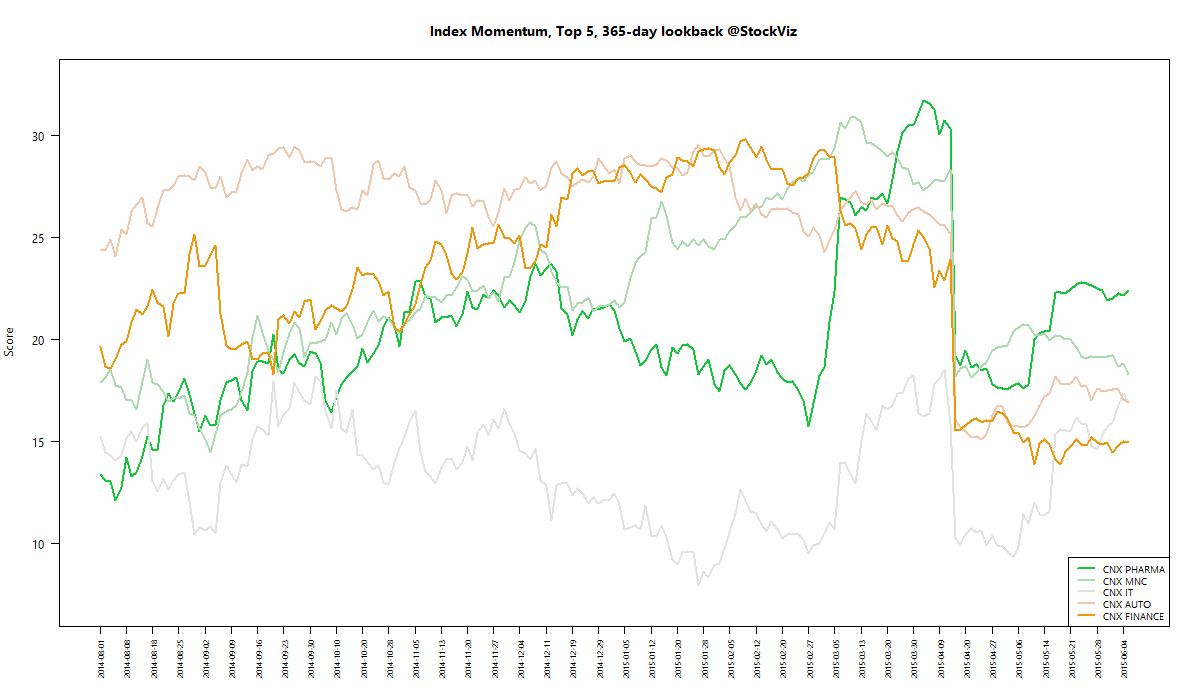
index momentum best 365 2015-05-22 png

index momentum best 50 2015-05-22 png

index momentum worst 365 2015-05-22 png

index momentum worst 50 2015-05-22 png

Refactored Index Performance

50-day performance, from March 10, 2015 through May 22, 2015:

Trend Model Summary

Index Signal % From Peak Day of Peak
CNX AUTO SHORT
5.69
2015-Jan-27
CNX BANK SHORT
10.32
2015-Jan-27
CNX ENERGY SHORT
29.07
2008-Jan-14
CNX FMCG SHORT
9.54
2015-Feb-25
CNX INFRA SHORT
49.37
2008-Jan-09
CNX IT SHORT
87.72
2000-Feb-21
CNX MEDIA SHORT
29.01
2008-Jan-04
CNX METAL SHORT
56.14
2008-Jan-04
CNX MNC SHORT
3.97
2015-Mar-12
CNX NIFTY SHORT
5.97
2015-Mar-03
CNX PHARMA SHORT
8.25
2015-Apr-08
CNX PSE SHORT
26.16
2008-Jan-04
CNX REALTY SHORT
89.23
2008-Jan-14
Pharma and banks seem to be perking up.
And boy-oh-boy! MNCs have more or less covered their draw-down.

Practical Momentum – Conclusion

Recap

We began the exploration of a practical way to execute momentum using derivatives. We found that:

  1. A lookback period of one year works best (Part I)
  2. Because of survivorship bias, long-short underperforms long-only (Part II)
  3. Hedging with single-name put options doesn’t work(Part III)
  4. Larger long-only portfolios have smaller drawdowns and better performance than smaller long-only portfolios (Part III)

Conclusion

The way things stand, Momentum is best executed using a broad basket of stocks. There is no mechanical way to maintain a momentum driven derivative portfolio. You can explore long-only equity momentum here.

Practical Momentum Part III – Hedging

Introduction

In Part II of our Practical Momentum series, we saw how adding a volatility adjustment significantly improved portfolio returns. However, we were left with a nagging observation that long-only returns were much higher than long-short returns. The problem with a long-only futures portfolio is that draw-downs can wipe you out. But what if we hedged the portfolio?

You can hedge a portfolio in two ways: (a) buy individual put options, and (b) calculate the beta of the portfolio and short an appropriate multiple of NIFTY futures. The problem with option (b) is that it will not protect you against idiosyncratic risk. For example, say you are long a pharma stock and the USFDA issues an import alert, the stock will tank irrespective of the NIFTY. So for the purposes of this simulation, we will try option (a)

Hedged Long-Only Momentum

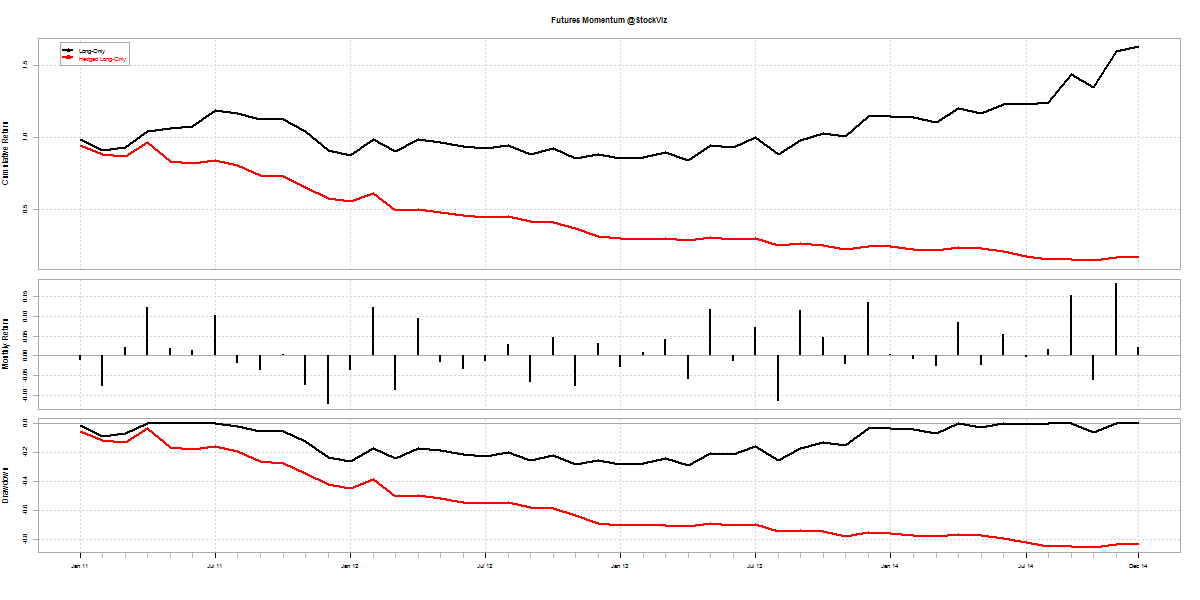
With 5 long-futures hedged with long put-options below the purchase price:

black line shows long-only; red shows hedged long-only

hedged.momentum

A portfolio hedged with single-name put options performs poorly:

  • There is always a d between the option payout and the underlying
  • ?-decay eats away more of the option value than the protection it offers

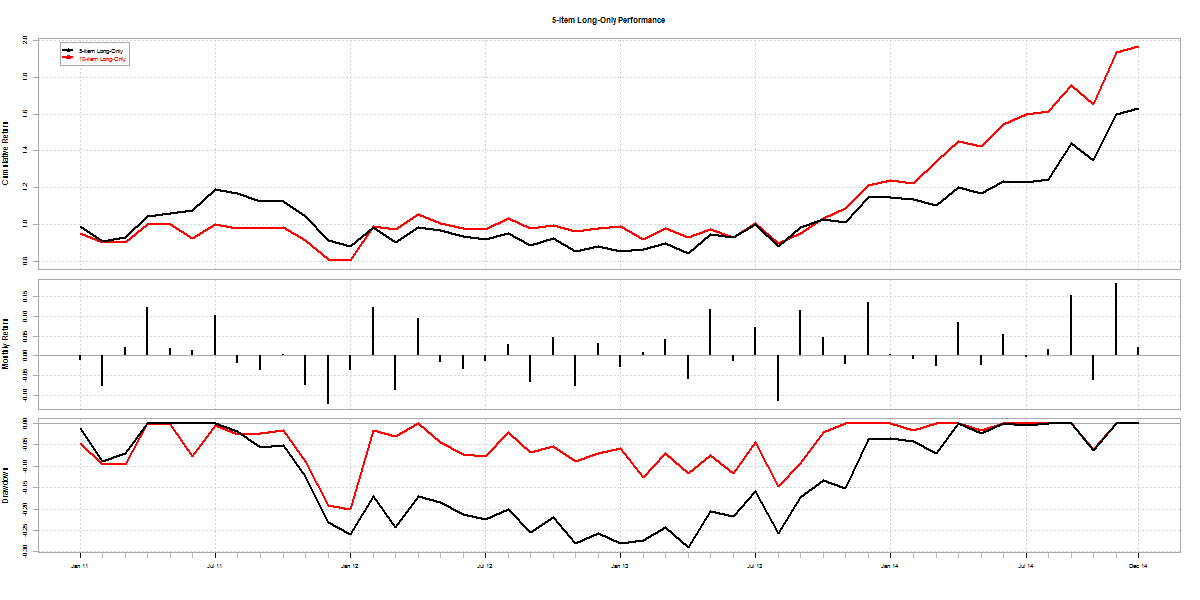
Another way to make draw-downs shallower is to diversify. When we increased the number of stocks in our long-only equity momentum portfolio from 10 to 20, it reduced portfolio volatility and boosted returns. Here’s how a 10-count long-only momentum portfolio compares with the 5 from above:

black line shows a 5-item long-only portfolio returns; red shows 10
five10.momentum

Conclusion

The problem with leveraged momentum is that losses can wipe you out. Hedging it with single-name options doesn’t work. Are we stuck with unlevered momentum? We will explore this in the next post. Stay tuned!

Practical Momentum, Part II – Volatility Adjustment

Introduction

Previously, we ran back-tests on long-only and long-short momentum algorithm over a couple of look-back periods. We found that (a) momentum with a one-year look-back period out-performed one with a 100-day look-back, and (b) a long-only portfolio significantly out-performed a long-short portfolio. We hypothesize that this is probably because the universe of stocks that we are forced to consider was heavily plucked. But what if we added a volatility metric into the mix to smooth out draw-downs?

Long-only Momentum

First, lets take a look at the long-only portfolio; both with a one-year look-back:

The red line is the volatility adjusted momentum; black is naive momentum; and green is buy & hold Nifty
long-only-momentum.volatility.2005-2010

long-only-momentum.volatility.2011-2014.

By year:

long-only-momentum2
Adding volatility into the mix did nothing to drawdowns but boosted returns considerably – with volatility adjusted momentum out-performing the naive version in 7 out of 10 years.

Long-short Momentum

Long-short ended up under-performing long-only once again:

The red line is long-short momentum; black is long-only momentum; and green is buy & hold Nifty
long-short-momentum.volatility.2005-2010

long-short-momentum.volatility.2011-2014

By year:

long-short-momentum2

Conclusion

Over the long run, long-only momentum with volatility adjustment outperformed the long-short version. However, while long-only tanked with the rest of the market in 2008, long-short was in the green. So if you are one of those guys who ask “how did this strategy perform in 2008?” Well, it performed pretty well. But would you have stuck by it when it got shellacked in 2013?

The problem with steep drawdowns is that it makes implementing the strategy with derivatives or leverage difficult. Margin calls might force you to abandon the strategy just before it turns. Next, we will explore a hedged long-only momentum strategy. Stay tuned!

Index Update 16.05.2015

MOMENTUM

We run our proprietary momentum scoring algorithm on indices just like we do on stocks. You can use the momentum scores of sub-indices to get a sense for which sectors have the wind on their backs and those that are facing headwinds.

Traders can pick their longs in sectors with high short-term momentum and their shorts in sectors with low momentum. Investors can use the longer lookback scores to position themselves using our re-factored index Themes.

You can see how the momentum algorithm has performed on individual stocks here.

Here are the best and the worst sub-indices:
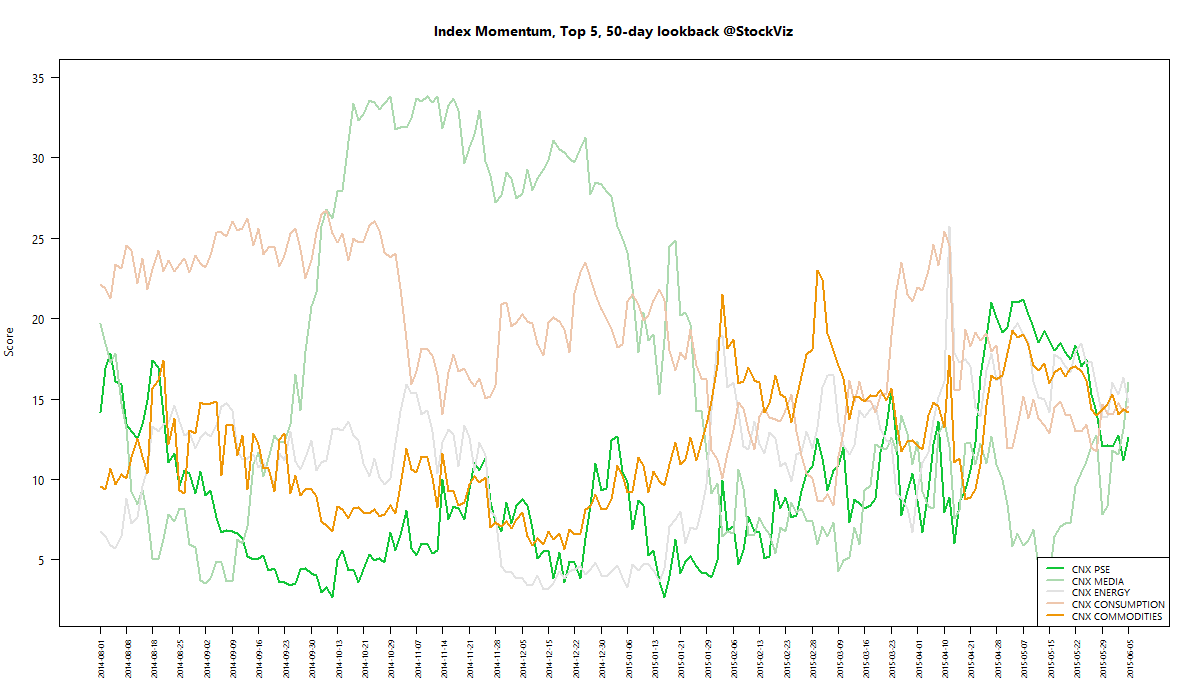
index momentum best 365 2015-05-15 png

index momentum best 50 2015-05-15 png

index momentum worst 365 2015-05-15 png

index momentum worst 50 2015-05-15 png

Refactored Index Performance

50-day performance, from March 02, 2015 through May 15, 2015:

Trend Model Summary

Index Signal % From Peak Day of Peak
CNX AUTO SHORT
6.15
2015-Jan-27
CNX BANK SHORT
11.54
2015-Jan-27
CNX ENERGY SHORT
30.63
2008-Jan-14
CNX FMCG SHORT
10.31
2015-Feb-25
CNX INFRA SHORT
50.32
2008-Jan-09
CNX IT SHORT
88.30
2000-Feb-21
CNX MEDIA SHORT
31.75
2008-Jan-04
CNX METAL SHORT
55.90
2008-Jan-04
CNX MNC SHORT
5.04
2015-Mar-12
CNX NIFTY SHORT
8.16
2015-Mar-03
CNX PHARMA SHORT
11.11
2015-Apr-08
CNX PSE SHORT
27.10
2008-Jan-04
CNX REALTY SHORT
89.34
2008-Jan-14
It looks like Autos and Pharma may be green-shooting. A rate cut would help autos and rupee depreciation can act as a tailwind for pharma.