Index Update 30.01.2016

MOMENTUM

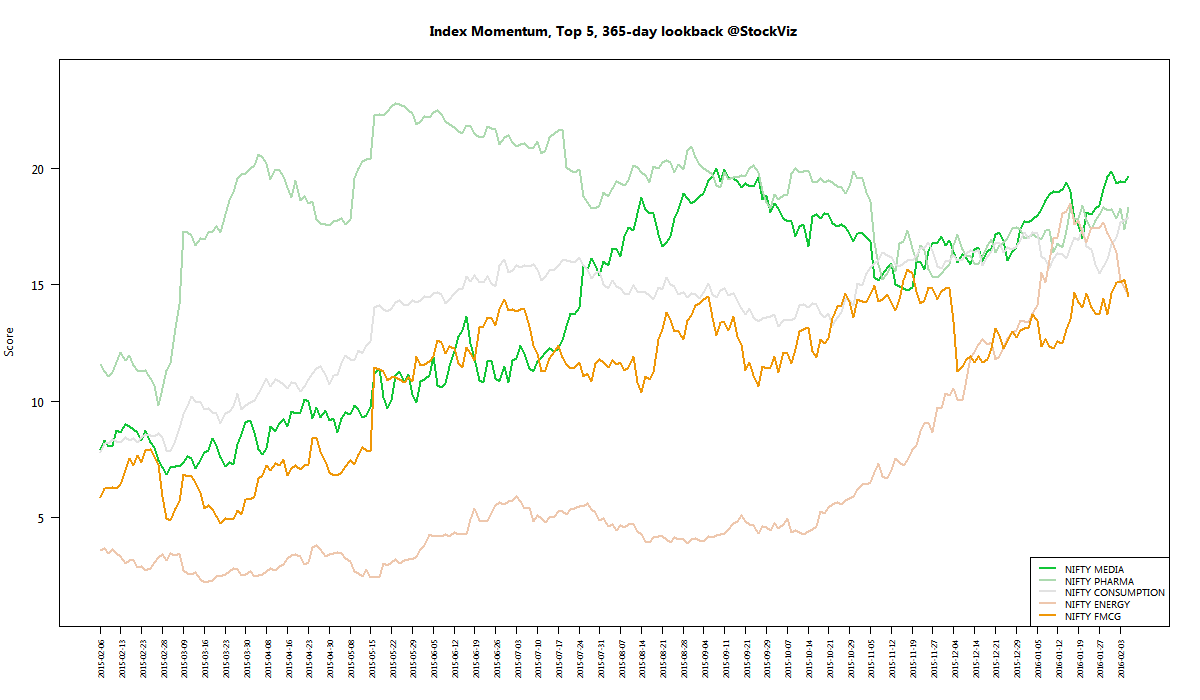
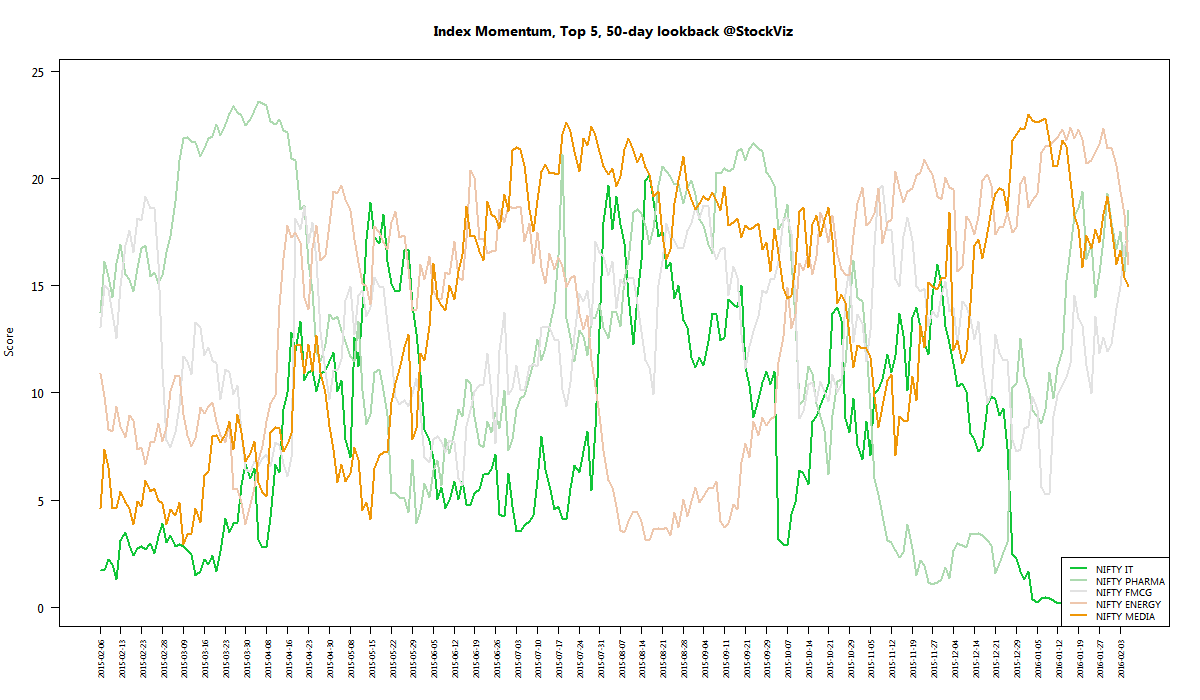
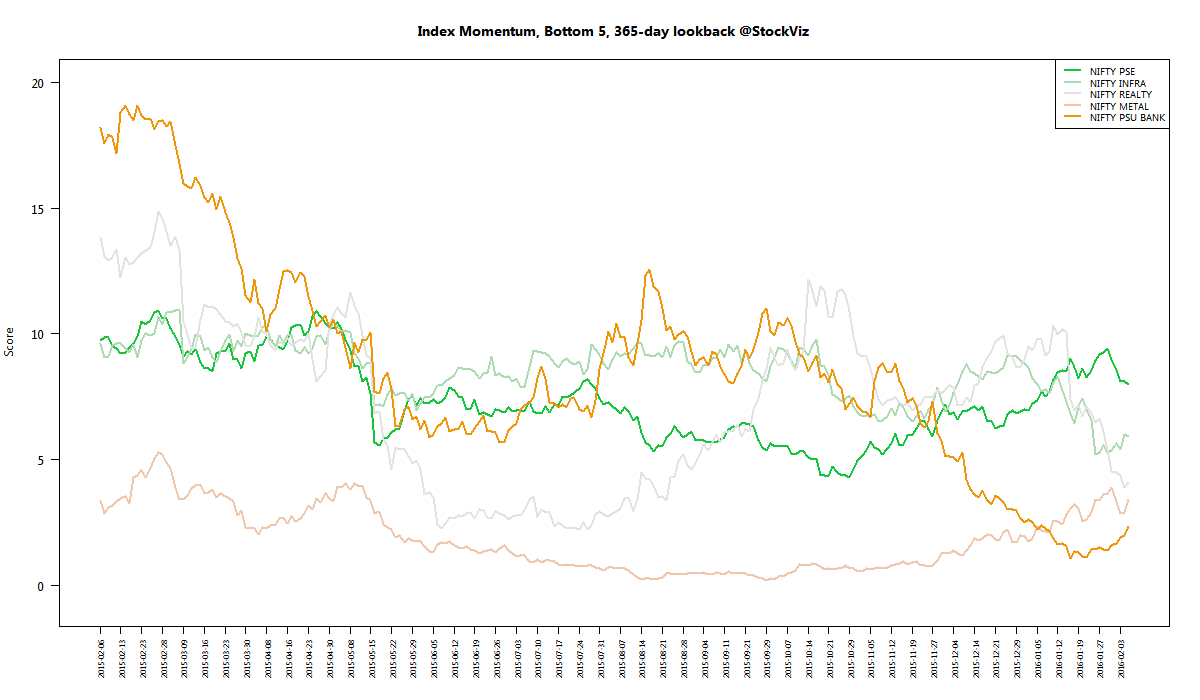
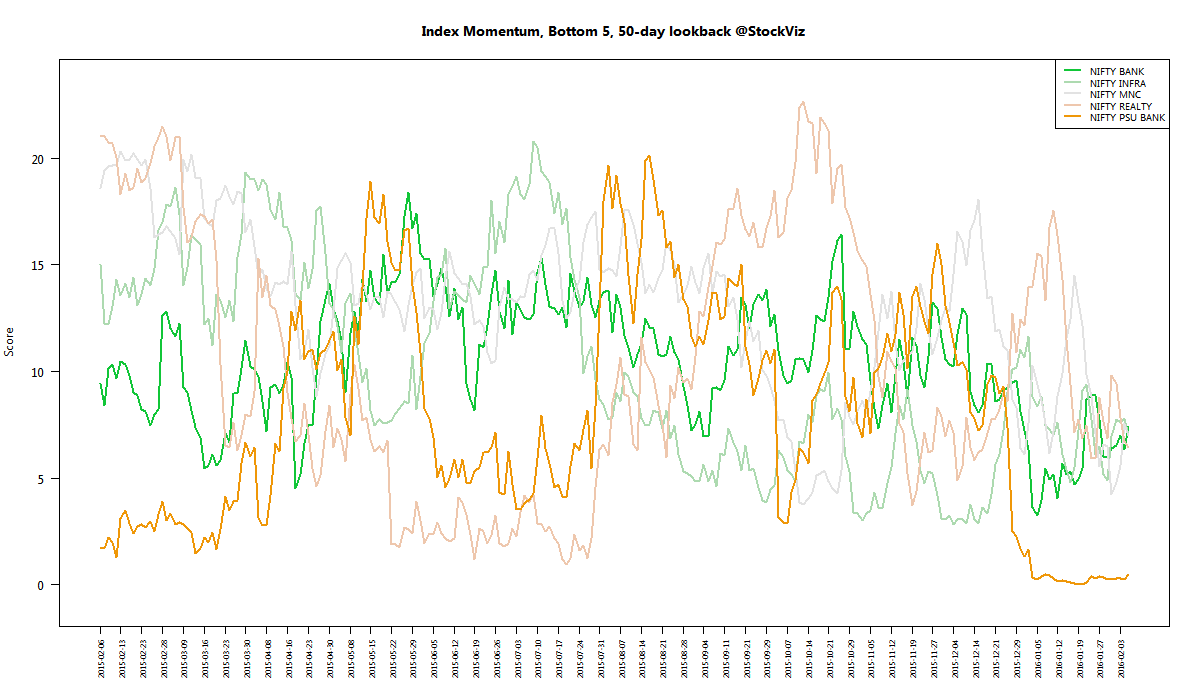
We run our proprietary momentum scoring algorithm on indices just like we do on stocks. You can use the momentum scores of sub-indices to get a sense for which sectors have the wind on their backs and those that are facing headwinds.

Traders can pick their longs in sectors with high short-term momentum and their shorts in sectors with low momentum. Investors can use the longer lookback scores to position themselves using our re-factored index Themes.

You can see how the momentum algorithm has performed on individual stocks here.

Here are the best and the worst sub-indices:

index momentum best 365 2016-01-29 png

index momentum best 50 2016-01-29 png

index momentum worst 365 2016-01-29 png

index momentum worst 50 2016-01-29 png

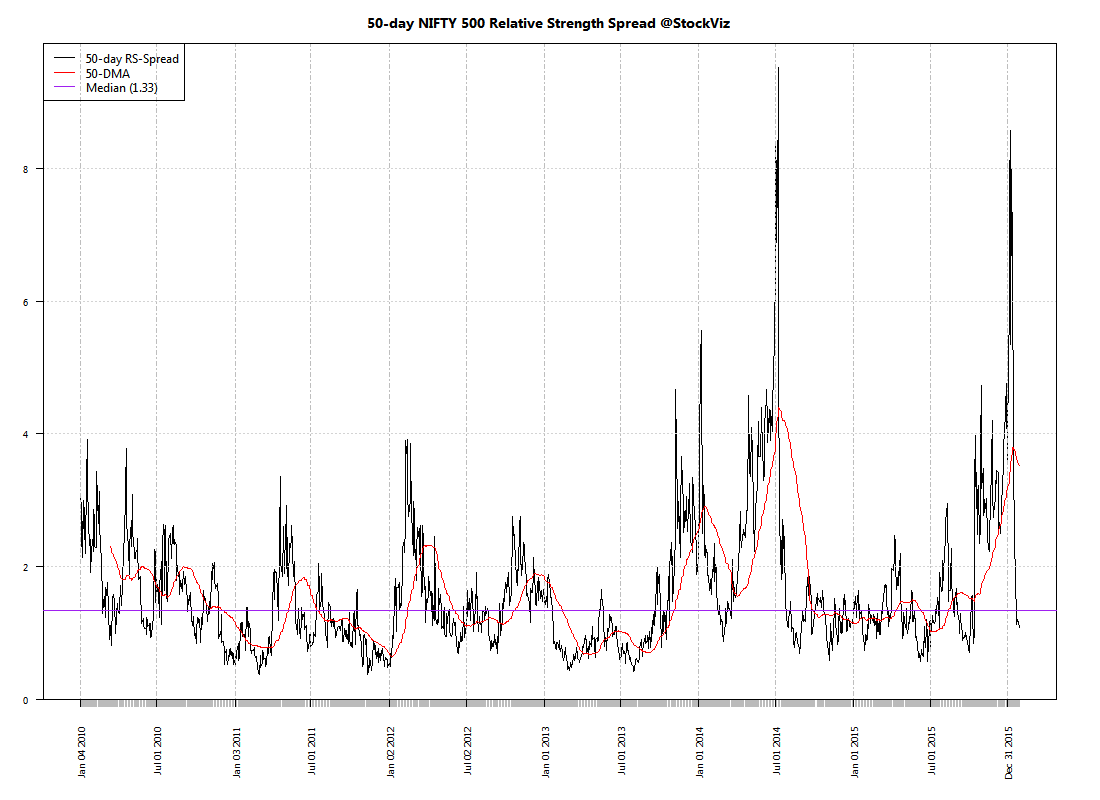
Relative Strength Spread

NIFTY_500 relative-spread-index 50 2016-01-29 png

Refactored Index Performance

50-day performance, from November 18, 2015 through January 29, 2016:

Trend Model Summary

Index Signal % From Peak Day of Peak
NIFTY AUTO SHORT
16.42
2015-Jan-27
NIFTY BANK SHORT
24.48
2015-Jan-27
NIFTY COMMODITIES LONG
37.22
2008-Jan-04
NIFTY CONSUMPTION SHORT
10.38
2015-Aug-05
NIFTY ENERGY LONG
29.10
2008-Jan-14
NIFTY FIN SERVICE SHORT
21.30
2015-Jan-28
NIFTY FMCG SHORT
14.18
2015-Feb-25
NIFTY INFRA SHORT
61.28
2008-Jan-09
NIFTY IT LONG
88.23
2000-Feb-21
NIFTY MEDIA LONG
16.13
2008-Jan-04
NIFTY METAL LONG
69.81
2008-Jan-04
NIFTY MNC LONG
17.75
2015-Aug-10
NIFTY PHARMA LONG
15.00
2015-Apr-08
NIFTY PSE LONG
36.55
2008-Jan-04
NIFTY PSU BANK SHORT
57.35
2010-Nov-05
NIFTY REALTY LONG
91.83
2008-Jan-14
NIFTY SERV SECTOR SHORT
16.69
2015-Mar-03
Pharma seems to be clawing its way back up the momentum charts…

Market-Cap Deciles, Part II

We had introduced the concept of dividing the universe of stocks by market-cap deciles a while ago (StockViz.) Here are some observations.

Returns

The last year has been spectacular for small- and mid-cap stocks.

From August-2014 to Now:
decile all

For 2015:
decile 2015

So far in 2016:
decile 2016-JAN
Note: Deciles go from 1 (micro-cap) to 10 (mega-cap)

In 2015:

  1. If you had blindly invested in an equal-weight portfolio of ~145 micro-cap stocks, you would have been up ~70%
  2. Every other decile out-performed the mega-caps (decile #1)
  3. Note how the standard-deviation of returns compress as you walk up the cap

Migrations

migrations 2015
Free-float market-cap is a volatile measure in itself – when you use that to classify stocks, you end up with quite a bit of movement between deciles. Something to keep in mind while using deciles for analysis.

Market breadth indicator

The mega-cap decile (decile #1) can be used as a crude market-timing indicator. If you track the number of stocks in the decile that went up vs. the number that went down, you end up with a proxy for breadth.

long-short-nifty

Even though technically it beat the buy-and-hold NIFTY 50, the indicator produces too many trades and it doesn’t offer a large enough margin of out-performance to be useful in live trading.

Next steps

We will continue to poke around and share what we find!

Definition: Drawdown

Drawdown, of an investment, is the peak-to-trough decline during a specific period.

It is not uncommon for stock indices to drawdown 30% in a year. Here’s how we see it.

Nifty 50 Drawdowns

drawdowns.nifty50

Nifty Midcap 100 Drawdowns

drawdowns.midcap100

Explainer

Drawdowns take their time to form and can be identified into three distinct points:

  1. The day from which the investment started going down. ‘From’ in the above images.
  2. The day on which the investment stopped going down. ‘Trough’ in the above images.
  3. The day on which the investment recouped all its losses from (1). ‘To’ in the above images.

The number of days the whole processes took is the ‘Length’ of the drawdown. ‘Recovery’ shows the number of days it took to get back to it initial value.

Path dependency

The yearly breakup shown above doesn’t give the real picture of how the investment actually performed during the entire stretch of time. For example, here’s NIFTY 50 vs. MIDCAP 100:

Between 2004-01-01 and 2016-01-20, NIFTY 50 has returned a cumulative 282.24% with an IRR of 11.76% vs. NIFTY MIDCAP 100's cumulative return of 394.05% and an IRR of 14.16%.

Depending on where your starting point is, you end up with different drawdown and return profiles. You can fool around with that here: svz.bz

Take-away

Returns go hand-in-hand with drawdowns. Seasoned investors wait for it (in bond funds) to enter, most long-term investors learn to ignore them and continue their dollar cost averaging (aka SIP.)

Index Update 16.01.2016

MOMENTUM

We run our proprietary momentum scoring algorithm on indices just like we do on stocks. You can use the momentum scores of sub-indices to get a sense for which sectors have the wind on their backs and those that are facing headwinds.

Traders can pick their longs in sectors with high short-term momentum and their shorts in sectors with low momentum. Investors can use the longer lookback scores to position themselves using our re-factored index Themes.

You can see how the momentum algorithm has performed on individual stocks here.

Here are the best and the worst sub-indices:

index momentum best 365 2016-01-15 png

index momentum best 50 2016-01-15 png

index momentum worst 365 2016-01-15 png

index momentum worst 50 2016-01-15 png

Relative Strength Spread

NIFTY_500 relative-spread-index 50 2016-01-15 png

Refactored Index Performance

50-day performance, from November 03, 2015 through January 15, 2016:

Trend Model Summary

Index Signal % From Peak Day of Peak
NIFTY AUTO LONG
17.09
2015-Jan-27
NIFTY BANK LONG
26.02
2015-Jan-27
NIFTY COMMODITIES SHORT
37.60
2008-Jan-04
NIFTY CONSUMPTION LONG
10.19
2015-Aug-05
NIFTY ENERGY SHORT
28.34
2008-Jan-14
NIFTY FIN SERVICE LONG
22.84
2015-Jan-28
NIFTY FMCG LONG
14.35
2015-Feb-25
NIFTY INFRA LONG
60.96
2008-Jan-09
NIFTY IT SHORT
88.49
2000-Feb-21
NIFTY MEDIA LONG
18.33
2008-Jan-04
NIFTY METAL LONG
70.43
2008-Jan-04
NIFTY MNC LONG
15.76
2015-Aug-10
NIFTY PHARMA LONG
18.59
2015-Apr-08
NIFTY PSE SHORT
36.99
2008-Jan-04
NIFTY PSU BANK LONG
56.98
2010-Nov-05
NIFTY REALTY LONG
91.74
2008-Jan-14
NIFTY SERV SECTOR LONG
18.49
2015-Mar-03
Pretty much every sub-index has a negative 50-day return…

Theme: Quality to Price Update 04.01.2016

held since returns (%)
EVERESTIND
2014-Jul-07
+16.77
GEOMETRIC
2014-Mar-13
+54.95
HITECHPLAS
2014-Jul-07
+175.89
INFINITE
2014-Oct-07
+23.97
MASTEK
2013-Aug-28
+19.14
MBECL
2014-Mar-13
+55.23
OMAXAUTO
2015-Jan-19
+57.58
SUNCLAYLTD
2015-Jan-19
+18.68
TRIDENT
2014-Oct-07
+97.03
UFLEX
2014-Jul-07
+41.59
WSTCSTPAPR
2014-Jul-07
+19.07
LUMAXIND
2015-Jul-07
+50.39
SUNDRMBRAK
2015-Jul-07
+11.55
GARWALLROP
2015-Jul-07
+71.68
HARITASEAT
2015-Jul-07
+146.41
ORIENTBELL
2015-Jul-07
+18.60
SURYAROSNI
2015-Jul-07
+8.86
AGCNET
2015-Jul-07
-12.67
UCALFUEL
2015-Jul-07
+29.00
CANTABIL
2015-Jul-07
+5.85
Since the last rebalance on 2015-Jul-07 till 2016-Jan-01, this strategy has returned +37.90%

You can find more details about the Quality to Price Theme here.