Equities
| MINTs | |
|---|---|
| JCI(IDN) | -0.14% |
| INMEX(MEX) | +0.12% |
| NGSEINDX(NGA) | -0.96% |
| XU030(TUR) | +2.39% |
| BRICS | |
|---|---|
| IBOV(BRA) | +7.81% |
| SHCOMP(CHN) | -2.18% |
| NIFTY(IND) | +1.44% |
| INDEXCF(RUS) | +4.38% |
| TOP40(ZAF) | +0.72% |
Commodities
| Energy | |
|---|---|
| Natural Gas | +9.63% |
| Brent Crude Oil | +19.35% |
| WTI Crude Oil | +18.78% |
| Ethanol | +7.67% |
| Heating Oil | +16.52% |
| RBOB Gasoline | +12.21% |
| Metals | |
|---|---|
| Gold 100oz | +4.91% |
| Silver 5000oz | +16.23% |
| Palladium | +9.91% |
| Copper | +3.65% |
| Platinum | +10.43% |
Currencies
| MINTs | |
|---|---|
| USDIDR(IDN) | -0.45% |
| USDMXN(MEX) | -0.99% |
| USDNGN(NGA) | -0.03% |
| USDTRY(TUR) | -0.91% |
| BRICS | |
|---|---|
| USDBRL(BRA) | -4.40% |
| USDCNY(CHN) | +0.38% |
| USDINR(IND) | +0.12% |
| USDRUB(RUS) | -3.34% |
| USDZAR(ZAF) | -3.57% |
| Agricultural | |
|---|---|
| Cattle | -13.57% |
| Lean Hogs | +14.21% |
| Soybean Meal | +22.41% |
| Feeder Cattle | -10.82% |
| Wheat | +1.48% |
| Coffee (Arabica) | -5.56% |
| Coffee (Robusta) | +5.78% |
| Corn | +11.55% |
| Cotton | +8.51% |
| Lumber | -5.54% |
| Orange Juice | -12.86% |
| Soybeans | +12.23% |
| Sugar #11 | +6.16% |
| Cocoa | +7.24% |
| White Sugar | +5.30% |
Credit Indices
| Index | Change |
|---|---|
| Markit CDX EM | +0.60% |
| Markit CDX NA HY | +0.89% |
| Markit CDX NA IG | -4.40% |
| Markit iTraxx Asia ex-Japan IG | -6.15% |
| Markit iTraxx Australia | -9.74% |
| Markit iTraxx Europe | -1.61% |
| Markit iTraxx Europe Crossover | -9.50% |
| Markit iTraxx Japan | -21.20% |
| Markit MCDX (Municipal CDS) | +0.33% |
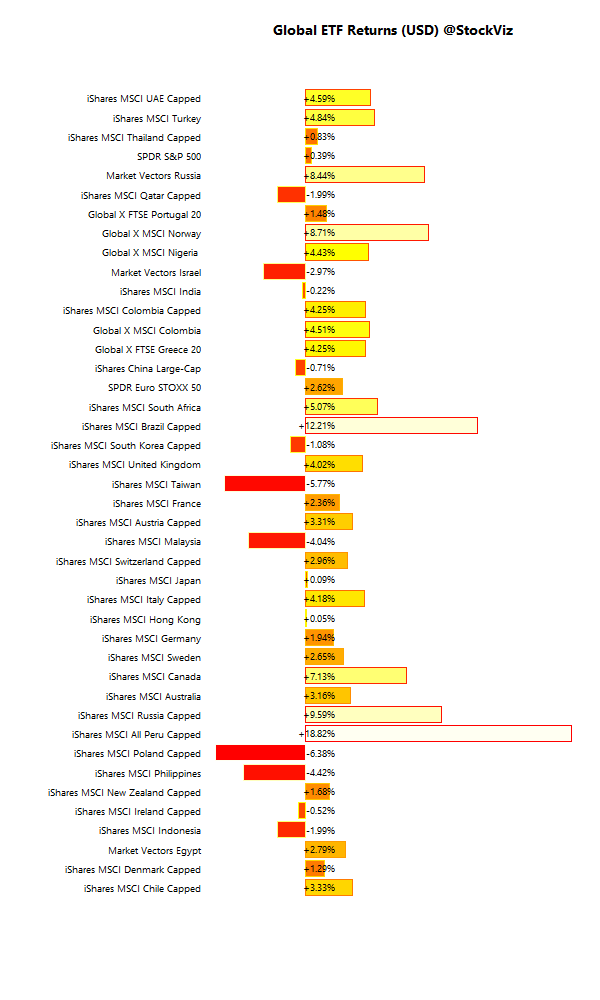
International ETFs (USD)
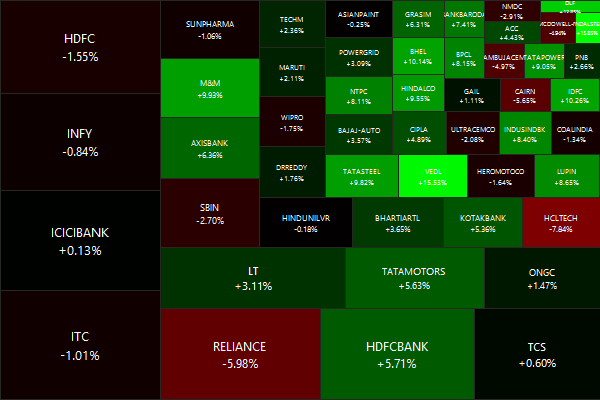
Nifty Heatmap
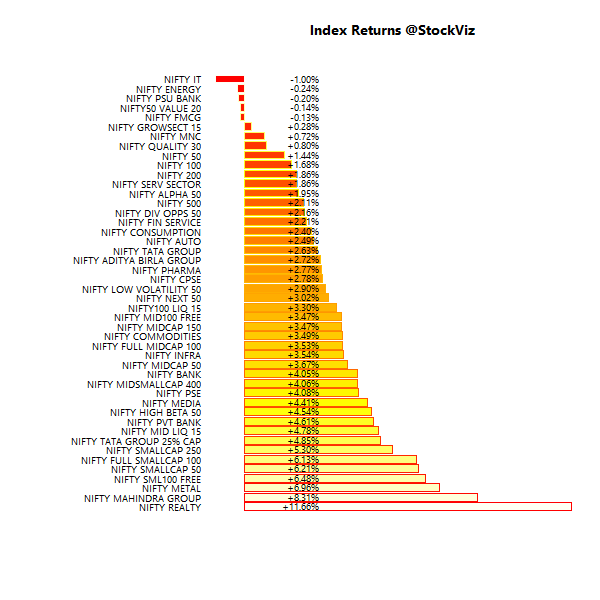
Index Returns
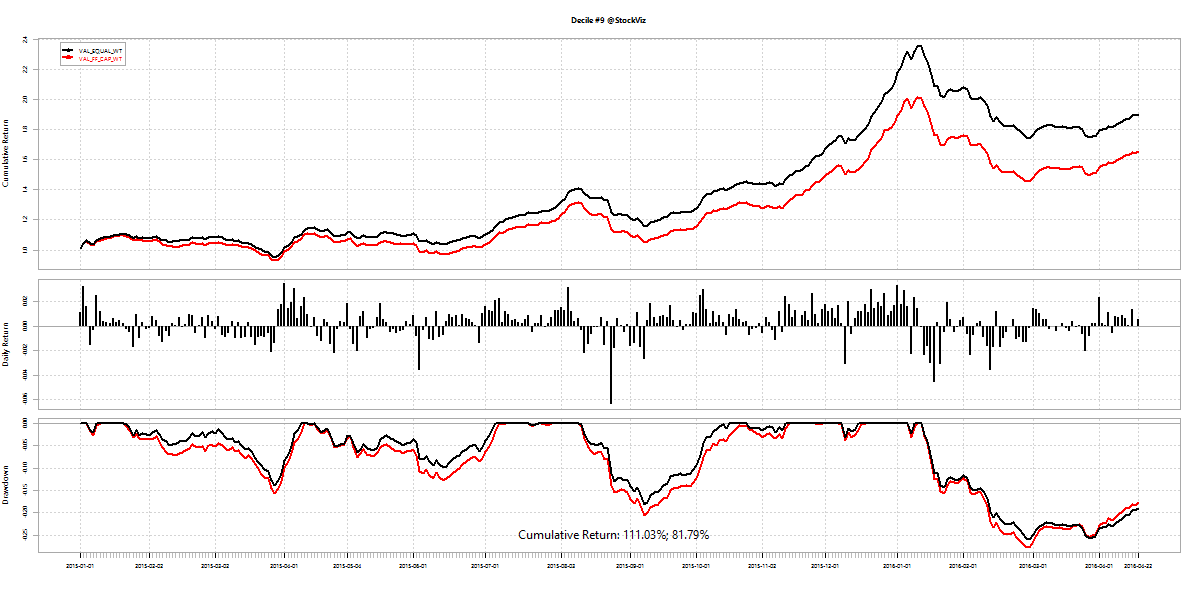
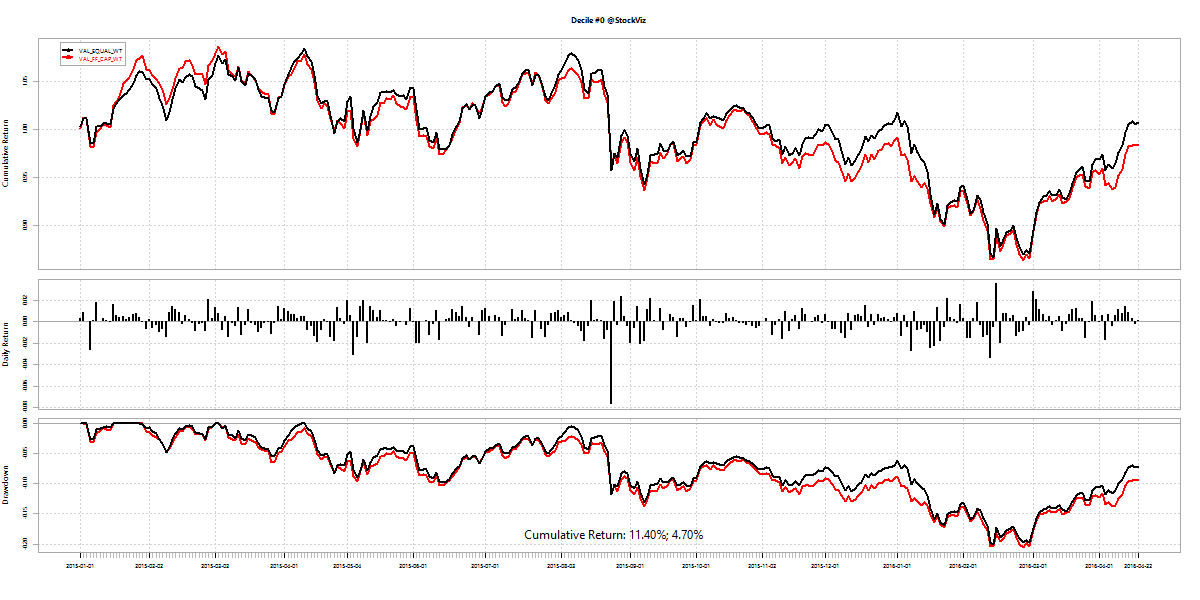
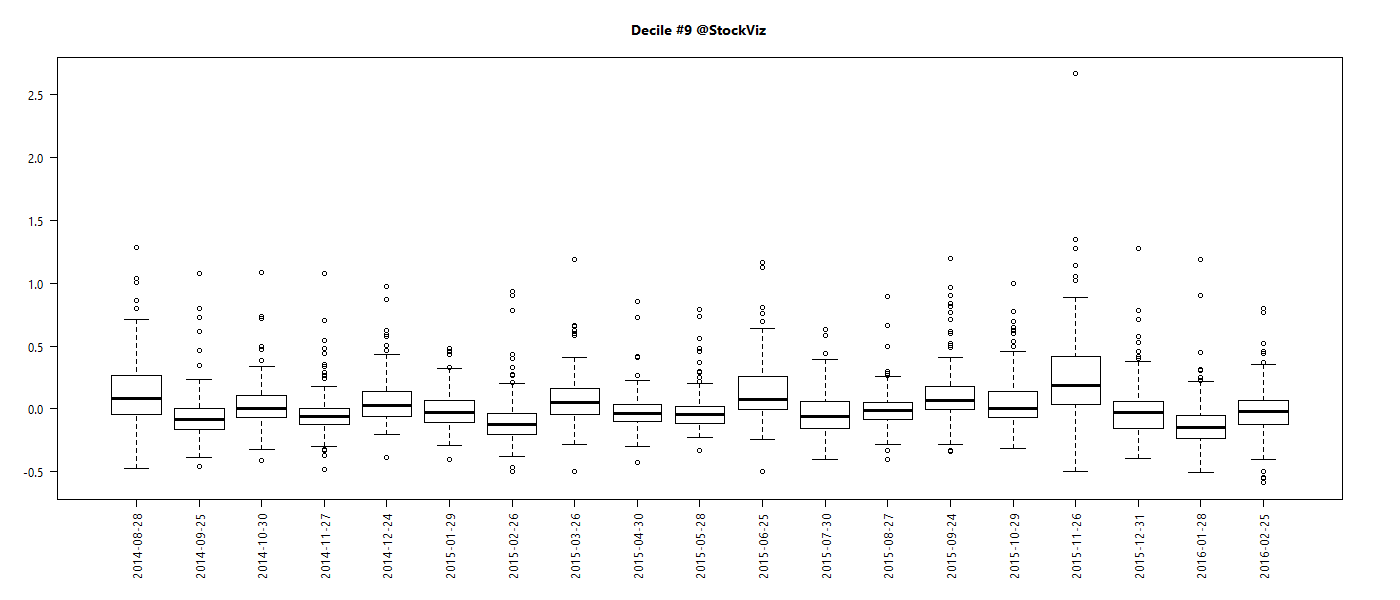
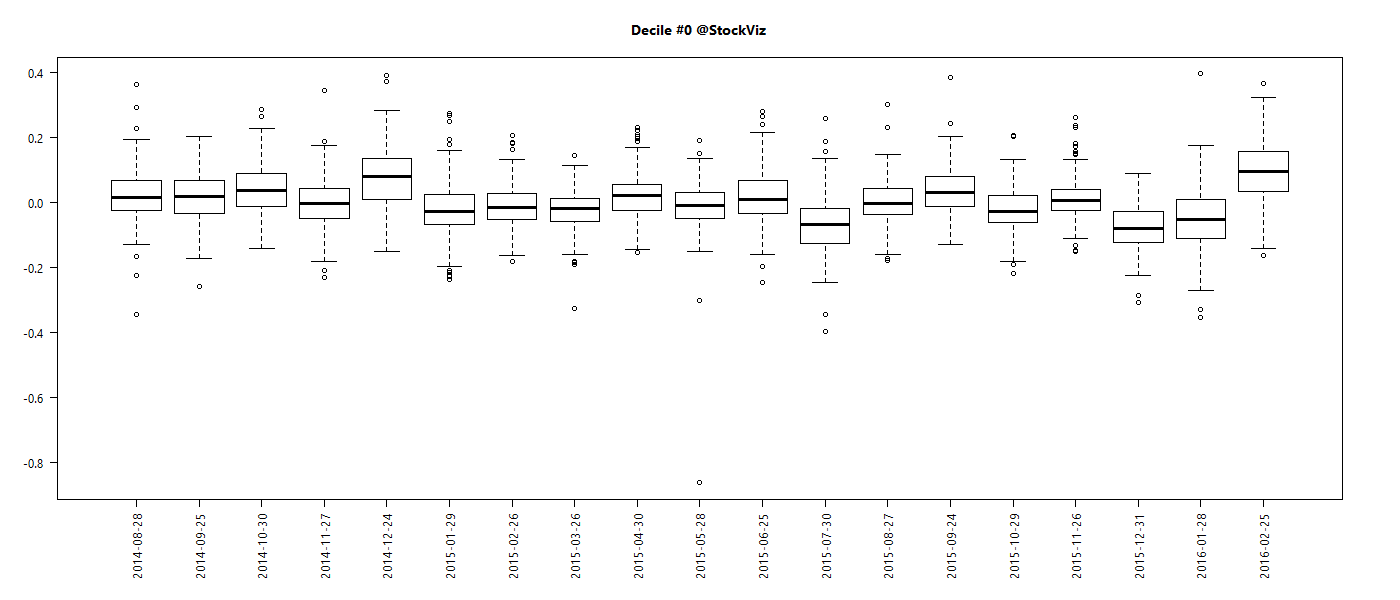
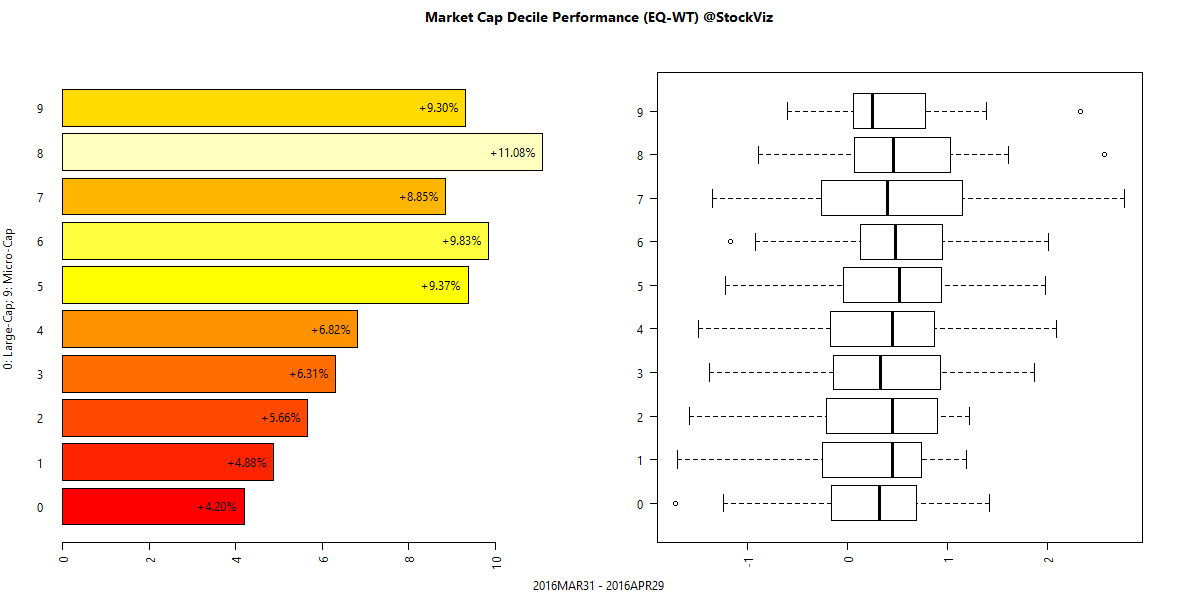
Market Cap Decile Performance
Top Winners and Losers
ETF Performance
| GOLDBEES | +5.98% |
| BANKBEES | +3.70% |
| JUNIORBEES | +3.05% |
| INFRABEES | +2.94% |
| CPSEETF | +2.69% |
| PSUBNKBEES | +1.03% |
| NIFTYBEES | +0.49% |
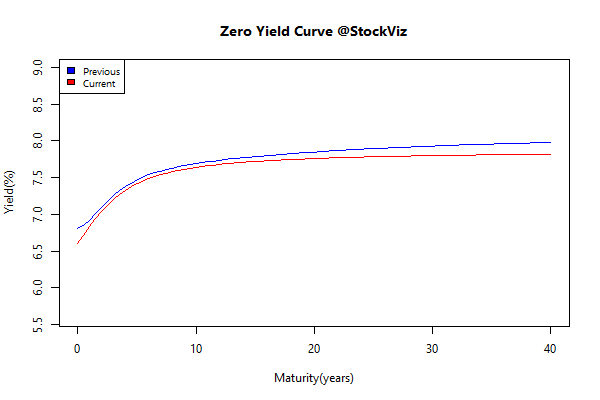
Yield Curve
Bond Indices
| Sub Index | Change in YTM | Total Return(%) |
|---|---|---|
| 0 5 | -0.05 | +0.77% |
| 5 10 | -0.06 | +0.92% |
| 10 15 | -0.04 | +0.94% |
| 15 20 | -0.12 | +1.75% |
| 20 30 | -0.08 | +1.50% |
Investment Theme Performance
| Quality to Price | +9.29% |
| Enterprise Yield | +8.01% |
| Velocity | +5.67% |
| High Beta | +5.47% |
| Magic Formula | +4.77% |
| Momentum | +4.70% |
| Low Beta | +4.23% |
| Low Volatility | +4.11% |
| Balance Sheet Strength | +4.00% |
| Financial Strength Value | +3.56% |
| Acceleration | +3.11% |
| High Alpha | +2.64% |
| High Sharpe | +2.57% |
| Tactical CNX 100 | +1.76% |
| HighIR Momentum | +0.44% |
Equity Mutual Funds
Bond Mutual Funds
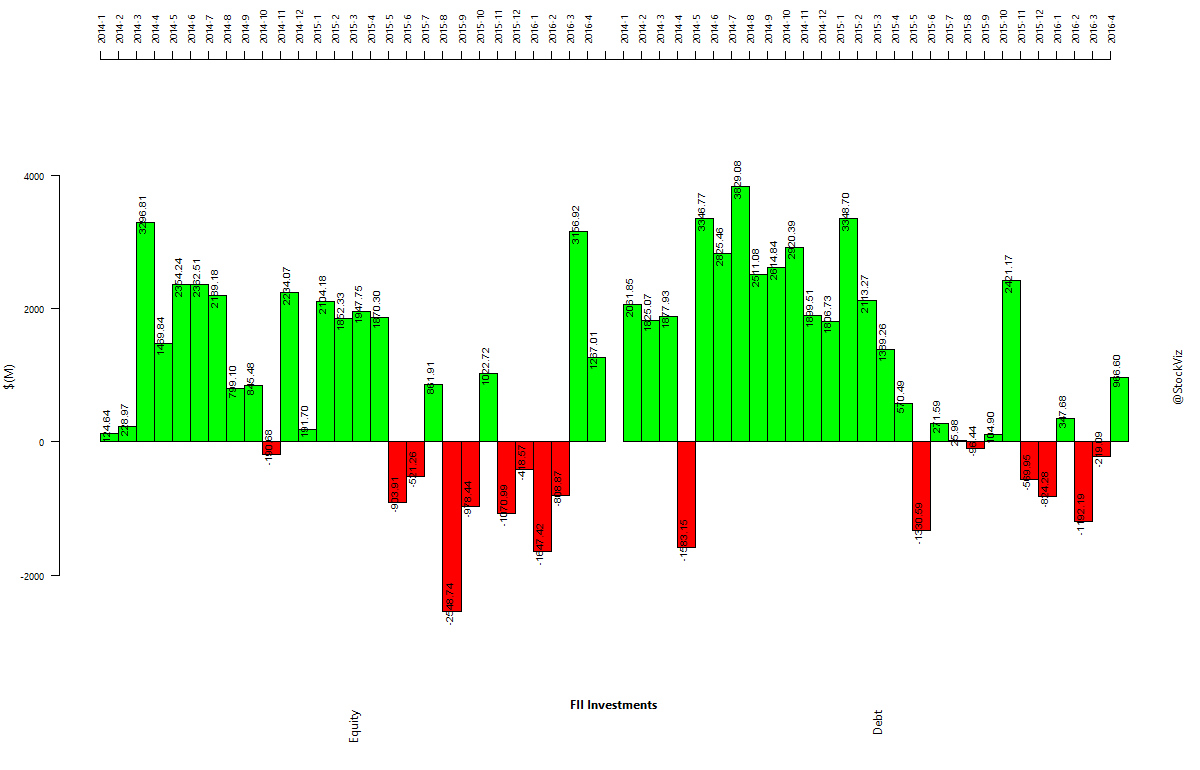
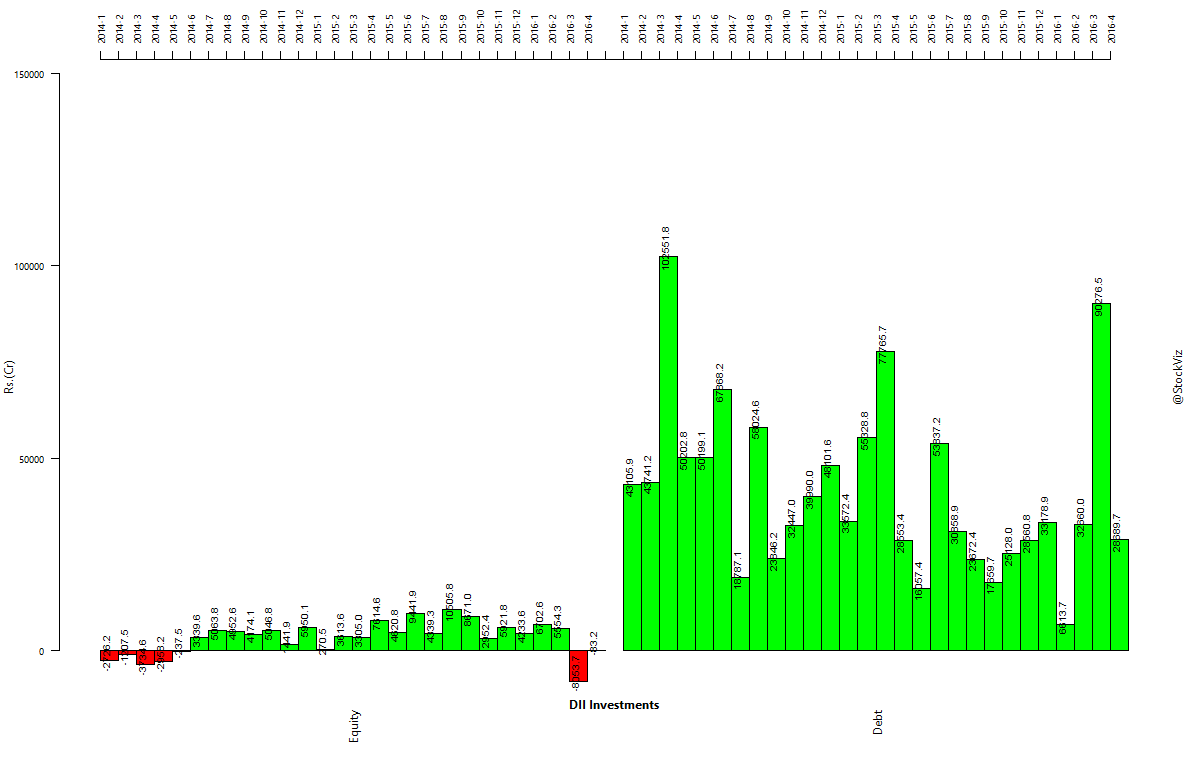
Institutional flows
FII’s seen renewing their love affair with Indian bonds…
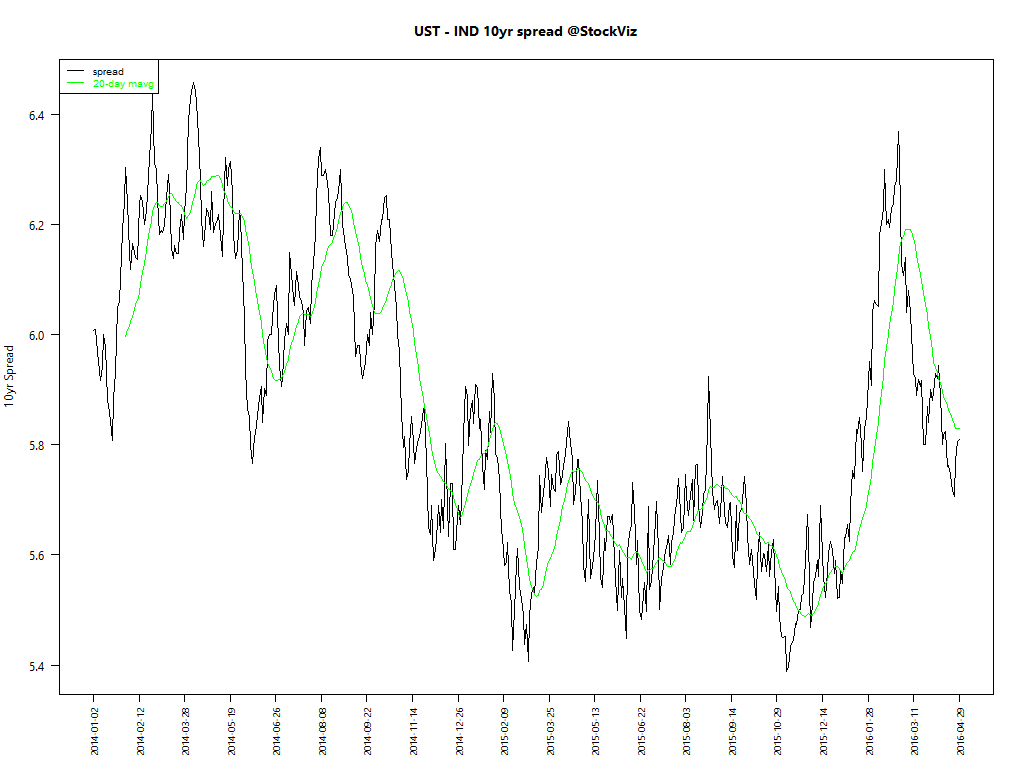
US Treasuries
Gilts are in the process of normalizing.
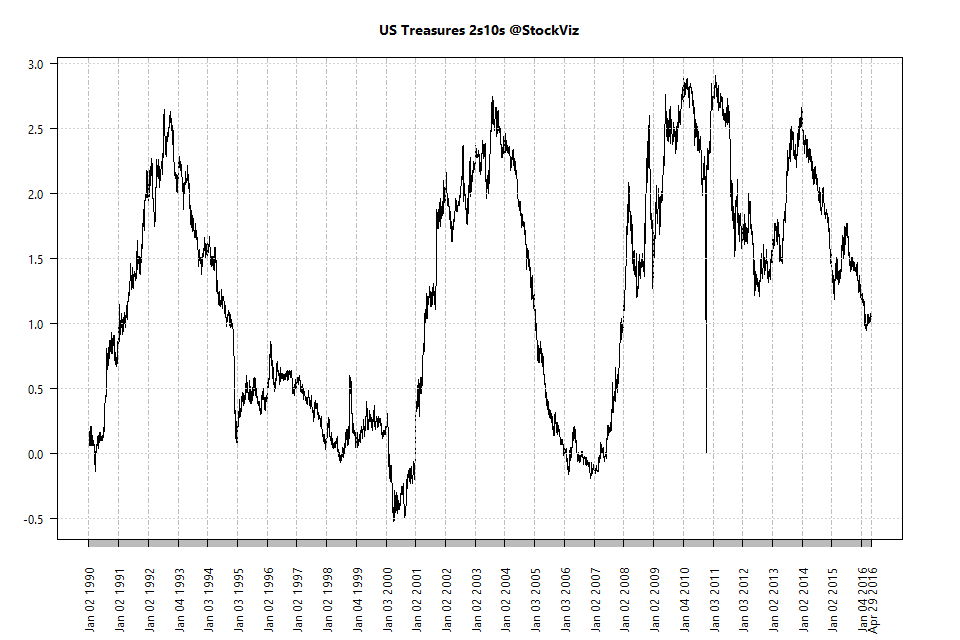
Is spread between 2s and 10s calling a bluff on a Fed rate hike?
Thought to sum up the month
Chance plays a far larger role in life outcomes than most people realize. And yet, the luckiest among us appear especially unlikely to appreciate our good fortune. Wealthy people overwhelmingly attribute their own success to hard work rather than to factors like luck or being in the right place at the right time.
That’s troubling, because seeing ourselves as self-made—rather than as talented, hardworking, and lucky—leads us to be less generous and public-spirited. It may even make the lucky less likely to support the conditions (such as high-quality public infrastructure and education) that made their own success possible.
Source: Why Luck Matters More Than You Might Think
What I read this month
What I Learned Losing a Million Dollars: